EV Decarbonization Strategy weighs life-cycle emissions and climate targets, highlighting mode shift to public transit, cycling, and walking, grid decarbonization, renewable energy, and charging infrastructure to cut greenhouse gases while reducing private car dependence.
Key Points
A plan to cut transport emissions by pairing EV adoption with mode shift, clean power, and less private car use.
✅ Prioritize mode shift: transit, cycling, and walking.
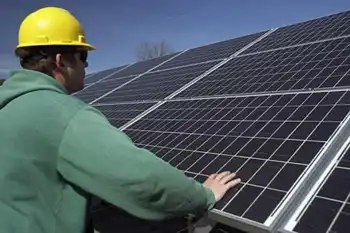
✅ Electrify remaining vehicles with clean, renewable power.
✅ Expand charging, improve batteries, and manage critical minerals.
California recently announced that it plans to ban the sales of gas-powered vehicles by 2035, a move similar to a 2035 electric vehicle mandate seen elsewhere, Ontario has invested $500 million in the production of electric vehicles (EVs) and Tesla is quickly becoming the world's highest-valued car company.
It almost seems like owning an electric vehicle is a silver bullet in the fight against climate change, but it isn't, as a U of T study explains today. What we should also be focused on is whether anyone should use a private vehicle at all.
As a researcher in sustainable mobility, I know this answer is unsatisfying. But this is where my latest research has led.
Battery EVs, such as the Tesla Model 3 - the best selling EV in Canada in 2020 - have no tailpipe emissions. But they do have higher production and manufacturing emissions than conventional vehicles, and often run on electricity that comes from fossil fuels.
Almost 18 per cent of the electricity generated in Canada came from fossil fuels in 2019, and even as Canada's EV goals grow more ambitious today, the grid mix varies from zero in Quebec to 90 per cent in Alberta.
Researchers like me compare the greenhouse gas emissions of an alternative vehicle, such as an EV, with those of a conventional vehicle over a vehicle lifetime, an exercise known as a life-cycle assessment. For example, a Tesla Model 3 compared with a Toyota Corolla can provide up to 75 per cent reduction in greenhouse gases emitted per kilometre travelled in Quebec, but no reductions in Alberta.
Hundreds of millions of new cars
To avoid extreme and irreversible impacts on ecosystems, communities and the overall global economy, we must keep the increase in global average temperatures to less than 2 C - and ideally 1.5 C - above pre-industrial levels by the year 2100.
We can translate these climate change targets into actionable plans. First, we estimate greenhouse gas emissions budgets using energy and climate models for each sector of the economy and for each country. Then we simulate future emissions, taking alternative technologies into account, as well as future potential economic and societal developments.
I looked at the U.S. passenger vehicle fleet, which adds up to about 260 million vehicles, while noting the potential for Canada-U.S. collaboration in this transition, to answer a simple question: Could the greenhouse gas emissions from the sector be brought in line with climate targets by replacing gasoline-powered vehicles with EVs?
The results were shocking. Assuming no changes to travel behaviours and a decarbonization of 80 per cent of electricity, meeting a 2 C target could require up to 300 million EVs, or 90 per cent of the projected U.S. fleet, by 2050. That would require all new purchased vehicles to be electric from 2035 onwards.
To put that into perspective, there are currently 880,000 EVs in the U.S., or 0.3 per cent of the fleet. Even the most optimistic projections, despite hype about an electric-car revolution gaining steam, from the International Energy Agency suggest that the U.S. fleet will only be at about 50 per cent electrified by 2050.
Massive and rapid electrification
Still, 90 per cent is theoretically possible, isn't it? Probably, but is it desirable?
In order to hit that target, we'd need to very rapidly overcome all the challenges associated with EV adoption, such as range anxiety, the higher purchase cost and availability of charging infrastructure.
A rapid pace of electrification would severely challenge the electricity infrastructure and the supply chain of many critical materials for the batteries, such as lithium, manganese and cobalt. It would require vast capacity of renewable energy sources and transmission lines, widespread charging infrastructure, a co-ordination between two historically distinct sectors (electricity and transportation systems) and rapid innovations in electric battery technologies. I am not saying it's impossible, but I believe it's unlikely.
Read more: There aren't enough batteries to electrify all cars - focus on trucks and buses instead
So what? Shall we give up, accept our collective fate and stop our efforts at electrification?
On the contrary, I think we should re-examine our priorities and dare to ask an even more critical question: Do we need that many vehicles on the road?
Buses, trains and bikes
Simply put, there are three ways to reduce greenhouse gas emissions from passenger transport: avoid the need to travel, shift the transportation modes or improve the technologies. EVs only tackle one side of the problem, the technological one.
And while EVs do decrease emissions compared with conventional vehicles, we should be comparing them to buses, including leading electric bus fleets in North America, trains and bikes. When we do, their potential to reduce greenhouse gas emissions disappears because of their life cycle emissions and the limited number of people they carry at one time.
If we truly want to solve our climate problems, we need to deploy EVs along with other measures, such as public transit and active mobility. This fact is critical, especially given the recent decreases in public transit ridership in the U.S., mostly due to increasing vehicle ownership, low gasoline prices and the advent of ride-hailing (Uber, Lyft)
Governments need to massively invest in public transit, cycling and walking infrastructure to make them larger, safer and more reliable, rather than expanding EV subsidies alone. And we need to reassess our transportation needs and priorities.
The road to decarbonization is long and winding. But if we are willing to get out of our cars and take a shortcut through the forest, we might get there a lot faster.
Author: Alexandre Milovanoff - Postdoctoral Researcher, Environmental Engineering, University of Toronto 
Related News