Washington County solar farm incentives aim to steer projects to industrial sites with tax breaks, underground grid connections, decommissioning bonds, and wildlife corridors, balancing zoning, historic preservation, and Maryland renewable energy mandates.
Key Points
Policies steer solar to industrial sites with tax breaks, buried lines, and bonds, aligning with zoning and state goals.
✅ Tax breaks to favor rooftops and parking canopies
✅ Bury new grid lines to shift projects to industrial parks
✅ Require decommissioning bonds and wildlife corridors
Incentives for establishing solar farms at industrial spaces instead of on prime farmland are among the ideas the Washington County Planning Commission is recommending for the county to update its policies regarding solar farms.
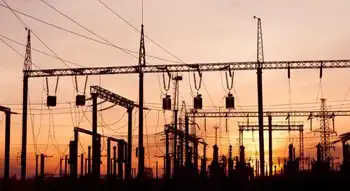
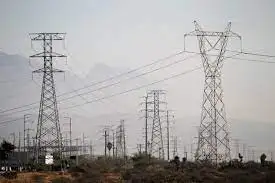
Potential incentives would include tax breaks on solar equipment and requiring developers to put power-grid connections and line extensions underground, a move tied to grid upgrade cost debates in other regions, Planning Commission members said during a Monday meeting.
The tax break could make it more attractive for a developer to put a solar farm on a roof or over a parking lot, similar to California's building-solar requirement policies that favor rooftop generation, which could cost more than putting it on farmland, said Commission member Dave Kline, who works for FirstEnergy.
Requiring a company to bury new transmission lines could steer them to industrial or business parks where, theoretically, transmission lines are more readily available, Kline said Wednesday in a phone interview.
Chairman Clint Wiley suggested talking to industrial property owners to create a list of industrial sites that make sense for a solar site, which could generate extra income for the property owner.
Commission members also talked about requiring a wildlife corridor. Anne Arundel County requires such a corridor if a solar site is over 15 acres, according to Jill Baker, deputy director of planning and zoning. The solar site is broken into sections so animals such as deer can get through, she said.
However, that means the solar farm would take up more agricultural land, Commission member Jeremiah Weddle said. Weddle, a farmer, has repeatedly voiced concerns about solar farms using prime farmland.
County zoning law already states solar farms are prohibited in Rural Legacy Areas, Priority Preservation Areas, and within Antietam Overlay zones that preserve the Antietam National Battlefield viewshed. They also cannot be built on land with permanent preservation easements, Baker said.
However, a big reason county officials are looking to strengthen county policies for solar generating systems, or solar farms, is a recent court decision that ruled the Maryland Public Service Commission can preempt county zoning law when it comes to large solar farms.
County zoning law defines a solar energy generating system as a solar facility, with multiple solar arrays, tied into the power grid and whose primary purpose is to generate power to distribute and/or sell into the public utility grid rather than consuming that power on site.
The Maryland Court of Appeals ruled in July that the Public Service Commission can preempt local zoning regarding solar farms larger than 2 megawatts. But the ruling also stated local government is a "significant participant in the process" and the state commission must give "due consideration" to local zoning laws.
County officials are looking at recommendations for solar farms, whether they are over 2 megawatts or not.
Solar farms are a popular issue statewide, especially with Maryland solar subscriptions expanding, and were discussed at a recent Maryland Association of Counties meeting for planners, Planning and Zoning Director Stephen Goodrich said.
The thinking is the best way for counties to express their opinions about a solar project is to participate in the state commission's local public hearings, where issues like how solar owners are paid often arise, Goodrich said. Another popular idea is for the county to continue to follow its process, which requires a public hearing for a special exception to establish a solar farm. That will help the county form an opinion, on individual cases, to offer the state commission, he said.
Recommendations discussed by the Planning Commission include:
A break on personal property taxes, which is on equipment, including affordable battery storage that can firm output, to steer developers away from areas where the county doesn't want solar farms. The Board of County Commissioners have been split on tax-break agreements for solar farms, with a majority recently granting a few.
Protecting valuable historic sites.
Requiring a decommissioning bond for removing the equipment at the end of the solar farm's life. The bond is protection in case the company goes bankrupt. The county commissioners have been making such a bond a requirement when granting recent tax breaks.
Looking at allowing solar farms in stormwater-management areas.
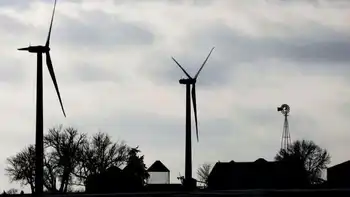
Other counties, particularly in Western Maryland and on the Eastern Shore, are having issues with solar farms even as research to improve solar and wind advances, because land is cheaper and there are wide-open spaces, Goodrich said.
Many solar projects are being developed or proposed because state lawmakers passed legislation requiring 50% of electricity produced in the state to come from renewable sources by 2030, and a federal plan to expand solar is also shaping expectations. Of that 50%, 14.5% is to come from solar energy.
In Maryland, the average number of homes that can be powered by 1 megawatt of solar energy is about 110, according to the Solar Energy Industries Association's website.
Related News