DoE is pessimistic about LED lighting

By Electricity Forum


CSA Z462 Arc Flash Training - Electrical Safety Essentials

Our customized live online or in‑person group training can be delivered to your staff at your location.

  • Live Online
  • 6 hours Instructor-led
  • Group Training Available
Regular Price:
$249
Coupon Price:
$199
Reserve Your Seat Today
According to a recent announcement from the U.S. Department of Energy (DoE), within the next five years we should expect to see a significant market uptake for LED lighting, followed by widespread adoption over the next 20 years. That is too pessimistic.

DarnellÂ’s latest analysis of trends in the LED market has identified and quantified a major inflection point for rapidly accelerating adoption of LEDs in general illumination applications in the next few years.

Darnell’s First Edition of “LED Driver ICs: Application Drivers, Technology Developments & Product Introduction Trends” provides a detailed roadmap of the successive application segments that will push growth for solid state lighting between now and 2020. The growth trajectory identified for high-brightness light-emitting diodes (HB-LEDs) is based on a detailed and quantitative analysis of application demands along with a projection of the anticipated improvements in the price-performance capabilities of HB-LEDs. Several factors are colliding that will result in an accelerated market inflection point and increasing growth rates for LEDs and LED Driver ICs.

“The impending displacement of cold-cathode fluorescent lamps (CCFLs) by LED backlights in the laptop computer market is only one of the most-visible indicators,” stated Jeff Shepard, President of Darnell Group. “We analyzed over 50 application sub-segments in detail to arrive at our growth trajectories. Growth is accelerating in numerous market segments including video signs and billboards, automotive lighting, and others. Growth in these applications will drive down the cost of LEDs faster than anticipated by the DoE,” concludes Shepard.

A key finding of this analysis is that the number of LEDs used in a typical application will increase in the near-term. In the longer-term, the LED Driver market is expected to go “full circle” from driving a small number of LEDs in handsets today, to larger numbers of LEDs as backlights in various LCD applications in the next stage of its evolution, to even larger numbers of LEDs in the next stage in platforms such as automobiles and larger video displays.

As a result of the growing number of LEDs in the dominant applications, the cost of LEDs will continue to drop dramatically until they finally become cost-effective for general illumination. At that time, the number of LEDs in a typical application will drop back to where it is today, but for use in very-high-volume general illumination applications.

Currently, LED lamps “are at least two orders of magnitude more expensive than traditional light sources,” making them several years away from significant market penetration for general illumination. Combined with this is a temporary slowdown in the growth of the high-efficiency lighting market (including CFLs and other technologies). Aggressive price erosion is occurring in the HB-LED market, which is expected to continue. Darnell’s latest analysis provides unique and in-depth analysis of this dynamic, high-growth market.

Related News

How Electricity Gets Priced in Europe and How That May Change

EU Power Market Overhaul targets soaring electricity prices by decoupling gas from power, boosting renewables, refining price caps, and stabilizing grids amid inflation, supply shocks, droughts, nuclear outages, and intermittent wind and solar.


Key Points

EU plan to redesign electricity pricing, curb gas-driven costs, boost renewables, and protect consumers from volatility.

✅ Decouples power prices from marginal gas generation

✅ Caps non-gas revenues to fund consumer relief

✅ Supports grid stability with storage, demand response, LNG


While energy prices are soaring around the world, Europe is in a particularly tight spot. Its heavy dependence on Russian gas -- on top of droughts, heat waves, an unreliable fleet of French nuclear reactors and a continent-wide shift to greener but more intermittent sources like solar and wind -- has been driving electricity bills up and feeding the highest inflation in decades. As Europe stands on the brink of a recession, and with the winter heating season approaching, officials are considering a major overhaul of the region’s power market to reflect the ongoing shift from fossil fuels to renewables.

1. How is electricity priced? 
Unlike oil or natural gas, there’s no efficient way to save lots of electricity to use in the future, though projects to store electricity in gas pipes are emerging. Commercial use of large-scale batteries is still years away. So power prices have been set by the availability at any given moment. When it’s really windy or sunny, for example, then more is produced relatively cheaply and prices are lower. If that supply shrinks, then prices rise because more generators are brought online to help meet demand -- fueled by more expensive sources. The way the market has long worked is that it is that final technology, or type of plant, needed to meet the last unit of consumption that sets the price for everyone. In Europe this year, that has usually meant natural gas. 

2. What is the relationship between power and gas? 
Very close. Across western Europe, gas plants have been a vital part of the energy infrastructure for decades, with Irish price spikes highlighting dispatchable power risks, fed in large part by supplies piped in from Siberia. Gas-fired plants were relatively quick to build and the technology straightforward, at least compared with nuclear plants and burns cleaner than coal. About 18% of Europe’s electricity was generated at gas plants last year; in 2020 about 43% of the imported gas came from Russia. Even during the depths of the Cold War, there’d never been a serious supply problem -- until the relationship with Russia deteriorated this year after it invaded Ukraine. Diversifying away from Russia, such as by increasing imports of liquefied natural gas, requires new infrastructure that takes a lot of time and money.

3. Why does it work this way? 
In theory, the relationship isn’t different from that with coal, for example. But production hiccups and heatwave curbs on plants from nuclear in France to hydro in Spain and Norway significantly changed the generation picture this year, and power hit records as plants buckled in the heat. Since coal-fired and nuclear plants are generally running all the time anyway, gas plants were being called upon more often -- at times just to keep the lights on as summer temperatures hit records. And with the war in Ukraine resulting in record gas prices, that pushed up overall production costs. It’s that relationship that has made the surging gas price the driver for electricity prices. And since the continent is all connected, it has pushed up prices across the region. The value of the European power market jumped threefold last year, to a record 836 billion euros ($827 billion today).

4. What’s being considered? 
With large parts of European industry on its knees and households facing jumps in energy bills of several hundred percent, as record electricity prices ripple through markets, the pressure on governments and the European Union to intervene has never been higher. One major proposal is to impose a price cap on electricity from non-gas producers, with the difference between that and the market price channeled to relief for consumers. While it sounds simple, any such changes would rip up a market design that’s worked for decades and could threaten future investments because of unintended consequences.


5. How did this market evolve?
The Nordic region and the British market were front-runners in the 1990s, then Germany followed and is now the largest by far. A trader can buy and sell electricity delivered later on same day in blocks of an hour or even down to 15-minute periods, to meet sudden demand or take advantage of price differentials. The price for these contracts is decided entirely by the supply and demand, how much the wind is blowing or which coal plants are operating, for example. Demand tends to surge early in the morning and late afternoon. This system was designed when fossil fuels provided the bulk of power. Now there are more renewables, which are less predictable, with wind and solar surpassing gas in EU generation last year, and the proposed changes reflect that shift. 

6. What else have governments done?
There are also traders who focus on longer-dated contracts covering periods several years ahead, where broader factors such as expected economic output and the extent to which renewables are crowding out gas help drive prices. This year’s wild price swings have prompted countries including Germany, Sweden and Finland to earmark billions of euros in emergency liquidity loans to backstop utilities hit with sudden margin calls on their trading.


Related News

View more

UK low-carbon electricity generation stalls in 2019

UK low-carbon electricity 2019 saw stalled growth as renewables rose slightly, wind expanded, nuclear output fell, coal hit record lows, and net-zero targets demand faster deployment to cut CO2 intensity below 100gCO2/kWh.


Key Points

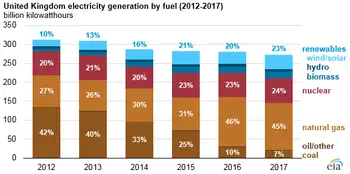
Low-carbon sources supplied 54% of UK power in 2019, up just 1TWh; wind grew, nuclear fell, and coal dropped to 2%.

✅ Wind up 8TWh; nuclear down 9TWh amid outages

✅ Fossil fuels 43% of generation; coal at 2%

✅ Net-zero needs 15TWh per year added to 2030


The amount of electricity generated by low-carbon sources in the UK stalled in 2019, Carbon Brief analysis shows.

Low-carbon electricity output from wind, solar, nuclear, hydro and biomass rose by just 1 terawatt hour (TWh, less than 1%) in 2019. It represents the smallest annual increase in a decade, where annual growth averaged 9TWh. This growth will need to double in the 2020s to meet UK climate targets while replacing old nuclear plants as they retire.

Some 54% of UK electricity generation in 2019 came from low-carbon sources, including 37% from renewables and 20% from wind alone, underscoring wind's leading role in the power mix during key periods. A record-low 43% was from fossil fuels, with 41% from gas and just 2% from coal, also a record low. In 2010, fossil fuels generated 75% of the total.

Carbon Brief’s analysis of UK electricity generation in 2019 is based on figures from BM Reports and the Department for Business, Energy and Industrial Strategy (BEIS). See the methodology at the end for more on how the analysis was conducted.

The numbers differ from those published earlier in January by National Grid, which were for electricity supplied in Great Britain only (England, Wales and Scotland, but excluding Northern Ireland), including via imports from other countries.

Low-carbon low
In 2019, the UK became the first major economy to target net-zero greenhouse gas emissions by 2050, increasing the ambition of its legally binding Climate Change Act.

To date, the country has cut its emissions by around two-fifths since 1990, with almost all of its recent progress coming from the electricity sector.

Emissions from electricity generation have fallen rapidly in the decade since 2010 as coal power has been almost phased out and even gas output has declined. Fossil fuels have been displaced by falling demand and by renewables, such as wind, solar and biomass.

But Carbon Brief’s annual analysis of UK electricity generation shows progress stalled in 2019, with the output from low-carbon sources barely increasing compared to a year earlier.

The chart below shows low-carbon generation in each year since 2010 (grey bars) and the estimated level in 2019 (red). The pale grey bars show the estimated future output of existing low-carbon sources after old nuclear plants retire and the pale red bars show the amount of new generation needed to keep electricity sector emissions to less than 100 grammes of CO2 per kilowatt hour (gCO2/kWh), the UK’s nominal target for the sector.

 Annual electricity generation in the UK by fuel, terawatt hours, 2010-2019. Top panel: fuel by fuel. Bottom panel: cumulative total generation from all sources. Source: BEIS energy trends, BM Reports and Carbon Brief analysis. Chart by Carbon Brief using Highcharts.
As the chart shows, the UK will require significantly more low-carbon electricity over the next decade as part of meeting its legally binding climate goals.

The nominal 100gCO2/kWh target for 2030 was set in the context of the UK’s less ambitious goal of cutting emissions to 80% below 1990 levels by 2050. Now that the country is aiming to cut emissions to net-zero by 2050, that 100gCO2/kWh indicator is likely to be the bare minimum.

Even so, it would require a rapid step up in the pace of low-carbon expansion, compared to the increases seen over the past decade. On average, low-carbon generation has risen by 9TWh each year in the decade since 2010 – including a rise of just 1TWh in 2019.

Given scheduled nuclear retirements and rising demand expected by the Committee on Climate Change (CCC) – with some electrification of transport and heating – low-carbon generation would need to increase by 15TWh each year until 2030, just to meet the benchmark of 100gCO2/kWh.

For context, the 3.2 gigawatt (GW) Hinkley C new nuclear plant being built in Somerset will generate around 25TWh once completed around 2026. The world’s largest offshore windfarm, the 1.2GW Hornsea One scheme off the Yorkshire coast, will generate around 5TWh each year.

The new Conservative government is targeting 40GW of offshore wind by 2030, up from today’s figure of around 8GW. If policies are put in place to meet this goal, then it could keep power sector emissions below 100gCO2/kWh, depending on the actual performance of the windfarms built.

However, new onshore wind and solar, further new nuclear or other low-carbon generation, such as gas with carbon capture and storage (CCS), is likely to be needed if demand is higher than expected, or if the 100gCO2/kWh benchmark is too weak in the context of net-zero by 2050.

The CCC says it is “likely” to “reflect the need for more rapid deployment” of low-carbon towards net-zero emissions in its advice on the sixth UK carbon budget for 2033-2037, due in September.

Trading places
Looking more closely at UK electricity generation in 2019, Carbon Brief’s analysis shows why there was so little growth for low-carbon sources compared to the previous year.

There was another increase for wind power in 2019 (up 8TWh, 14%), with record wind generation as several large new windfarms were completed including the 1.2GW Hornsea One project in October and the 0.6GW Beatrice offshore windfarm in Q2 of 2019. But this was offset by a decline for nuclear (down 9TWh, 14%), due to ongoing outages for reactors at Hunterston in Scotland and Dungeness in Kent.

(Analysis of data held by trade organisation RenewableUK suggests some 0.6GW of onshore wind capacity also started operating in 2019, including the 0.2GW Dorenell scheme in Moray, Scotland.)

As a result of these movements, the UK’s windfarms overtook nuclear for the first time ever in 2019, becoming the country’s second-largest source of electricity generation, and earlier, wind and solar together surpassed nuclear in the UK as momentum built. This is shown in the figure below, with wind (green line, top panel) trading places with nuclear (purple) and gas (dark blue) down around 25% since 2010 but remaining the single-largest source.

 Annual electricity generation in the UK by fuel, terawatt hours, 2010-2019. Top panel: fuel by fuel. Bottom panel: cumulative total generation from all sources. Source: BEIS energy trends, BM Reports and Carbon Brief analysis. Chart by Carbon Brief using Highcharts.
The UK’s currently suspended nuclear plants are due to return to service in January and March, according to operator EDF, the French state-backed utility firm. However, as noted above, most of the UK’s nuclear fleet is set to retire during the 2020s, with only Sizewell B in Suffolk due to still be operating by 2030. Hunterston is scheduled to retire by 2023 and Dungeness by 2028.

Set against these losses, the UK has a pipeline of offshore windfarms, secured via “contracts for difference” with the government, at a series of auctions. The most recent auction, in September 2019, saw prices below £40 per megawatt hour – similar to current wholesale electricity prices.

However, the capacity contracted so far is not sufficient to meet the government’s target of 40GW by 2030, meaning further auctions – or some other policy mechanism – will be required.

Coal zero
As well as the switch between wind and nuclear, 2019 also saw coal fall below solar for the first time across a full year, echoing the 2016 moment when wind outgenerated coal across the UK, after it suffered another 60% reduction in electricity output. Just six coal plants remain in the UK, with Aberthaw B in Wales and Fiddlers Ferry in Cheshire closing in March.

Coal accounted for just 2% of UK generation in 2019, a record-low coal share since centralised electricity supplies started to operate in 1882. The fuel met 40% of UK needs as recently as 2012, but has plummeted thanks to falling demand, rising renewables, cheaper gas and higher CO2 prices.

The reduction in average coal generation hides the fact that the fuel is now often not required at all to meet the UK’s electricity needs. The chart below shows the number of days each year when coal output was zero in 2019 (red line) and the two previous years (blue).

 Cumulative number of days when UK electricity generation from renewable sources has been higher than that from fossil fuels. Source: BEIS energy trends, BM Reports and Carbon Brief analysis. Chart by Carbon Brief using Highcharts.
The 83 days in 2019 with zero coal generation amount to nearly a quarter of the year and include the record-breaking 18-day stretch without the fuel.

Great Britain has been running for a record TWO WEEKS without using coal to generate electricity – the first time this has happened since 1882.

The country’s grid has been coal-free for 45% of hours in 2019 so far.https://www.carbonbrief.org/countdown-to-2025-tracking-the-uk-coal-phase-out …

Coal generation was set for significant reductions around the world in 2019 – including a 20% reduction for the EU as a whole – according to analysis published by Carbon Brief in November.

Notably, overall UK electricity generation fell by another 9TWh in 2019 (3%), bringing the total decline to 58TWh since 2010. This is equivalent to more than twice the output from the Hinkley C scheme being built in Somerset. As Carbon Brief explained last year, falling demand has had a similar impact on electricity-sector CO2 emissions as the increase in output from renewables.

This is illustrated by the fact that the 9TWh reduction in overall generation translated into a 9TWh (6%) cut in fossil-fuel generation during 2019, with coal falling by 10TWh and gas rising marginally.

Increasingly renewable
As fossil-fuel output and overall generation have declined, the UK’s renewable sources of electricity have continued to increase. Their output has risen nearly five-fold in the past decade and their share of the UK total has increased from 7% in 2010 to 37% in 2019.

As a result, the UK’s increasingly renewable grid is seeing more minutes, hours and days during which the likes of wind, solar and biomass collectively outpace all fossil fuels put together, and on some days wind is the main source as well.

The chart below shows the number of days during each year when renewables generated more electricity than fossil fuels in 2019 (red line) and each of the previous four years (blue lines). In total, nearly two-fifths of days in 2019 crossed this threshold.

 Cumulative number of days when the UK has not generated any electricity from coal. Source: BEIS energy trends, BM Reports and Carbon Brief analysis. Chart by Carbon Brief using Highcharts.
There were also four months in 2019 when renewables generated more of the UK’s electricity than fossil fuels: March, August, September and December. The first ever such month came in September 2018 and more are certain to follow.

National Grid, which manages Great Britain’s high-voltage electricity transmission network, is aiming to be able to run the system without fossil fuels by 2025, at least for short periods. At present, it sometimes has to ask windfarm operators to switch off and gas plants to start running in order to keep the electricity grid stable.

Note that biomass accounted for 11% of UK electricity generation in 2019, nearly a third of the total from all renewables. Some two-thirds of the biomass output is from “plant biomass”, primarily wood pellets burnt at Lynemouth in Northumberland and the Drax plant in Yorkshire. The remainder was from an array of smaller sites based on landfill gas, sewage gas or anaerobic digestion.

The CCC says the UK should “move away” from large-scale biomass power plants, once existing subsidy contracts for Drax and Lynemouth expire in 2027.

Using biomass to generate electricity is not zero-carbon and in some circumstances could lead to higher emissions than from fossil fuels. Moreover, there are more valuable uses for the world’s limited supply of biomass feedstock, the CCC says, including carbon sequestration and hard-to-abate sectors with few alternatives.

Methodology
The figures in the article are from Carbon Brief analysis of data from BEIS Energy Trends chapter 5 and chapter 6, as well as from BM Reports. The figures from BM Reports are for electricity supplied to the grid in Great Britain only and are adjusted to include Northern Ireland.

In Carbon Brief’s analysis, the BM Reports numbers are also adjusted to account for electricity used by power plants on site and for generation by plants not connected to the high-voltage national grid. This includes many onshore windfarms, as well as industrial gas combined heat and power plants and those burning landfill gas, waste or sewage gas.

By design, the Carbon Brief analysis is intended to align as closely as possible to the official government figures on electricity generated in the UK, reported in BEIS Energy Trends table 5.1.

Briefly, the raw data for each fuel is in most cases adjusted with a multiplier, derived from the ratio between the reported BEIS numbers and unadjusted figures for previous quarters.

Carbon Brief’s method of analysis has been verified against published BEIS figures using “hindcasting”. This shows the estimates for total electricity generation from fossil fuels or renewables to have been within ±3% of the BEIS number in each quarter since Q4 2017. (Data before then is not sufficient to carry out the Carbon Brief analysis.)

For example, in the second quarter of 2019, a Carbon Brief hindcast estimates gas generation at 33.1TWh, whereas the published BEIS figure was 34.0TWh. Similarly, it produces an estimate of 27.4TWh for renewables, against a BEIS figure of 27.1TWh.

National Grid recently shared its own analysis for electricity in Great Britain during 2019 via its energy dashboard, which differs from Carbon Brief’s figures.


Related News

View more

Disrupting Electricity? This Startup Is Digitizing Our Very Analog Electrical System

Solid-State AC Switching reimagines electrification with silicon-based, firmware-driven controls, smart outlets, programmable circuit breakers, AC-DC conversion, and embedded sensors for IoT, energy monitoring, surge protection, and safer, globally compatible devices.


Key Points

Solid-state AC switching replaces mechanical switches with silicon chips for intelligent, programmable power control.

✅ Programmable breakers trip faster and add surge and GFCI protection

✅ Shrinks AC-DC conversion, boosting efficiency and device longevity

✅ Enables sensor-rich, IoT-ready outlets with energy monitoring


Electricity is a paradox. On the one hand, it powers our most modern clean cars and miracles of computing like your phone and laptop. On the other hand, it’s one of the least updated, despite efforts to build a smarter electricity infrastructure nationwide, and most ready-for-disruption parts of our homes, offices, and factories.

A startup in Silicon Valley plans to change all that, in California’s energy transition where reliability is top of mind, and has just signed deals with leading global electronics manufacturers to make it happen.

“The end point of the electrification infrastructure of every building out there right now is based on old technology,” Thar Casey, CEO of Amber Solutions, told me recently on the TechFirst podcast. “Basically some was invented ... last century and some came in a little bit later on in the fifties and sixties.”

Ultimately, it’s an almost 18th century part of modern homes.

Even smart homes, with add-ons like the Tesla Powerwall, still rely on legacy switching.

The fuses, breakers, light switches, and electrical outlets in your home are ancient technology that would easily understood by Thomas Edison, who was born in 1847. When you flip a switch and instantly flood your room with light, it feels like a modern right. But you are simply pushing a piece of plastic which physically moves one wire to touch another wire. That completes a circuit, electricity flows, and ... let there be light.

Casey wants to change all that. To transform our hard-wired electrical worlds and make them, in a sense, soft wired. And the addressable market is literally tens of billions of devices.

The core innovation is a transition to solid-state switches.

“Take your table, which is a solid piece of wood,” Casey says. “If you can mimic what an electromechanical switch does, opening and closing, inside that table without any actual moving parts, that means you are now solid state AC switching.”

And solid-state is exactly what Silicon Valley is all about.

“Solid state it means it can be silicon,” Casey says. “It can be a chip, it can be smaller, it can be intelligent, you can have firmware, you can add software ... now you have a mini computer.”

That’s a significant innovation with a huge number of implications. It means that the AC to DC converters attached to every appliance you plug into the wall — the big “bricks” that are part of your power cord, for instance — can now be a tiny fraction of the size. Appliance run on DC, direct current, and the electricity in your walls is AC, alternating current; similar principles underpin advanced smart inverters in solar systems, and it needs to be converted before it’s usable, and that chunk of hardware, with electrolytics, magnetics, transformers and more, can now be replaced, saving space in thermostats, CO2 sensors, coffee machines, hair dryers, smoke detectors ... any small electric device.

(Since those components generally fail before the device does, replacing them is a double win.)

Going solid state also means that you can have dynamic input range: 45 volts all the way up to 600 volts.

So you can standardize one component across many different electric devices, and it’ll work in the U.S., it’ll work in Europe, it’ll work in Japan, and it will work whether it’s getting 100 or 120 or 220 volts.

Building it small and building it solid state has other benefits as well, Casey says, including a much better circuit breaker for power spikes as the U.S. grid faces climate change impacts today.

“This circuit breaker is programmable, it has intelligence, it has WiFi, it has Bluetooth, it has energy monitoring metering, it has surge protection, it has GFCI, and here’s the best part: we trip 3000 times faster than a mechanical circuit breaker.”

What that means is much more ambient intelligence that can be applied all throughout your home. Rather than one CO2 sensor in one location, every power outlet is now a CO2 sensor that can feed virtual power plant programs, too. And a particulate matter sensor and temperature sensor and dampness sensor and ... you name it.

Amber’s next-generation system-on-chip complete replacement for smart outlets
Amber’s next-generation system-on-chip complete replacement for smart outlets JOHN KOETSIER
“We put as many as fifteen functions ... in one single gang box in a wall,” Casey told me.

Solid state is the gift that keeps giving, because now every outlet can be surge-protected. Every outlet can have GFCI — ground fault circuit interruption — not just the ones in your bathroom. And every outlet and light switch in your home can participate in the sensor network that powers your home security system. Oh, and, if you want, Alexa or Siri or the Google Assistant too. Plus energy-efficient dimmers for all lighting appliances that don’t buzz.

So when can you buy Amber switches and outlets?

In a sense, never.

Casey says Amber isn’t trying to be a consumer-facing company and won’t bring these innovations to market themselves. This July, Amber announced a letter of intent with a global manufacturer that includes revenue, plus MOUs with six other major electronics manufacturers. Letters of intent can be a dime a dozen, as can memoranda of understanding, but attaching revenue makes it more serious and significant.

The company has only raised $6.7 million, according to Craft, and has a number of competitors, such as Blixt, which has funding from the European Union, and Atom Power, which is already shipping technology. But since Amber is not trying to be a consumer product and take its innovations to market itself, it needs much less cash to build a brand and a market. You’ll be able to buy Amber’s technology at some point; just not under the Amber name.

“We have over 25 companies that we’re in discussions with,” Casey says. “We’re going to give them a complete solution and back them up and support them toward success. Their success will be our success at the end of the day.”

Ultimately, of course, cost will be a big part of the discussion.

There are literally tens of billions of switches and outlets on the planet, and modernizing all of them won’t happen overnight. And if it’s expensive, it won’t happen quickly either, even as California turns to grid-scale batteries to ease strain.

Casey is a big cagey with costs — there are still a lot of variables, after all. But it seems it won’t cost that much more than current technology.

“This can’t be $1.50 to manufacture, at least not right now, maybe down the road,” he told me. “We’re very competitive, we feel very good. We’re talking to these partners. They recognize that what we’re bringing, it’s a cost that is cost effective.”


Related News

View more

Doug Ford's New Stance on Wind Power in Ontario

Ontario Wind Power Policy Shift signals renewed investment in renewable energy, wind farms, and grid resilience, aligning with climate goals, lower electricity costs, job creation, and turbine technology for cleaner, diversified power.


Key Points

A provincial pivot to expand wind energy, meet climate goals, lower costs, and boost jobs across Ontario’s power system.

✅ Diversifies Ontario's grid with scalable renewable capacity.

✅ Targets emissions cuts while stabilizing electricity prices.

✅ Spurs rural investment, supply chains, and skilled jobs.


Ontario’s energy landscape is undergoing a significant transformation as Premier Doug Ford makes a notable shift in his approach to wind power. This change represents a strategic pivot in the province’s energy policy, potentially altering the future of Ontario’s power generation, environmental goals, and economic prospects.

The Backdrop: Ford’s Initial Stance on Wind Power

When Doug Ford first assumed the role of Premier in 2018, his administration was marked by a strong stance against renewable energy projects, including wind power, with Ford later saying he was proud of tearing up contracts as part of this shift. Ford’s government inherited a legacy of ambitious renewable energy commitments from the previous Liberal administration under Kathleen Wynne, which had invested heavily in wind and solar energy. The Ford government, however, was critical of these initiatives, arguing that they resulted in high energy costs and a surplus of power that was not always needed.

In 2019, Ford’s government began rolling back several renewable energy projects, including wind farms, and was soon tested by the Cornwall wind farm ruling that scrutinized a cancellation. This move was driven by a promise to reduce electricity bills and cut what was perceived as wasteful spending on green energy. The cancellation of several wind projects led to frustration among environmental advocates and the renewable energy sector, who viewed the decision as a setback for Ontario’s climate goals.

The Shift: Embracing Wind Power

Fast forward to 2024, and Premier Ford’s administration is taking a markedly different approach. The recent policy shift, which moves to reintroduce renewable projects, indicates a newfound openness to wind power, reflecting a broader acknowledgment of the changing dynamics in energy needs and environmental priorities.

Several factors appear to have influenced this shift:

  1. Rising Energy Demands and Climate Goals: Ontario’s growing energy demands, coupled with the pressing need to address climate change, have necessitated a reevaluation of the province’s energy strategy. As Canada commits to reducing greenhouse gas emissions and transitioning to cleaner energy sources, wind power is increasingly seen as a crucial component of this strategy. Ford’s change in direction aligns with these national and global goals.

  2. Economic Considerations: The economic landscape has also evolved since Ford’s initial opposition to wind power. The cost of wind energy has decreased significantly over the past few years, making it a more competitive and viable option compared to traditional energy sources, as competitive wind power gains momentum in markets worldwide. Additionally, the wind energy sector promises substantial job creation and economic benefits, which are appealing in the context of post-pandemic recovery and economic growth.

  3. Public Opinion and Pressure: Public opinion and advocacy groups have played a role in shaping policy. There has been a growing demand from Ontarians for more sustainable and environmentally friendly energy solutions. The Ford administration has been responsive to these concerns, recognizing the importance of addressing public and environmental pressures.

  4. Technological Advancements: Advances in wind turbine technology have improved efficiency and reduced the impact on wildlife and local communities. Modern wind farms are less intrusive and more effective, addressing some of the concerns that were previously associated with wind power.

Implications of the Policy Shift

The implications of Ford’s shift towards wind power are far-reaching. Here are some key areas affected by this change:

  1. Energy Portfolio Diversification: By reembracing wind power, Ontario will diversify its energy portfolio, reducing its reliance on fossil fuels and increasing the proportion of renewable energy in the mix. This shift will contribute to a more resilient and sustainable energy system.

  2. Environmental Impact: Increased investment in wind power will contribute to Ontario’s efforts to combat climate change. Wind energy is a clean, renewable source that produces no greenhouse gas emissions during operation. This aligns with broader environmental goals and helps mitigate the impact of climate change.

  3. Economic Growth and Job Creation: The wind power sector has the potential to drive significant economic growth and create jobs. Investments in wind farms and associated infrastructure can stimulate local economies, particularly in rural areas where many wind farms are located.

  4. Energy Prices: While the initial shift away from wind power was partly motivated by concerns about high energy costs, including exposure to costly cancellation fees in some cases, the decreasing cost of wind energy could help stabilize or even lower electricity prices in the long term. As wind power becomes a larger component of Ontario’s energy supply, it could contribute to a more stable and affordable energy market.

Moving Forward: Challenges and Opportunities

Despite the positive aspects of this policy shift, there are challenges to consider, and other provinces have faced setbacks such as the Alberta wind farm scrapped by TransAlta that illustrate potential hurdles. Integrating wind power into the existing grid requires careful planning and investment in grid infrastructure. Additionally, addressing local concerns about wind farms, such as their impact on landscapes and wildlife, will be crucial to gaining broader acceptance.

Overall, Doug Ford’s shift towards wind power represents a significant and strategic change in Ontario’s energy policy. It reflects a broader understanding of the evolving energy landscape and the need for a sustainable and economically viable energy future. As the province navigates this new direction, the success of this policy will depend on effective implementation, ongoing stakeholder engagement, and a commitment to balancing environmental, economic, and social considerations, even as the electricity future debate continues among party leaders.


Related News

View more

N.S. approves new attempt to harness Bay of Fundy's powerful tides

Bay of Fundy Tidal Energy advances as Nova Scotia permits Jupiter Hydro to test floating barge platforms with helical turbines in Minas Passage, supporting renewable power, grid-ready pilots, and green jobs in rural communities.


Key Points

A Nova Scotia tidal energy project using helical turbines to generate clean power and create local jobs.

✅ Permits enable 1-2 MW prototypes near Minas Passage

✅ Floating barge platforms with patented helical turbines

✅ PPA at $0.50/kWh with Nova Scotia Power


An Alberta-based company has been granted permission to try to harness electricity from the powerful tides of the Bay of Fundy.

Nova Scotia has issued two renewable energy permits to Jupiter Hydro.

Backers have long touted the massive energy potential of Fundy's tides -- they are among the world's most powerful -- but large-scale commercial efforts to harness them have borne little fruit so far, even as a Scottish tidal project recently generated enough power to supply nearly 4,000 homes elsewhere.

The Jupiter application says it will use three "floating barge type platforms" carrying its patented technology. The company says it uses helical turbines mounted as if they were outboard motors.

"Having another company test their technology in the Bay of Fundy shows that this early-stage industry continues to grow and create green jobs in our rural communities," Energy and Mines Minister Derek Mombourquette said in a statement.

The first permit allows the company to test a one-megawatt prototype that is not connected to the electricity grid.

The second -- a five-year permit for up to two megawatts -- is renewable if the company meets performance standards, environmental requirements and community engagement conditions.

Mombourquette also authorized a power purchase agreement that allows the company to sell the electricity it generates to the Nova Scotia grid through Nova Scotia Power for 50 cents per kilowatt hour.

On its web site, Jupiter says it believes its approach "will prove to be the most cost effective marine energy conversion technology in the world," even as other regional utilities consider initiatives like NB Power's Belledune concept for turning seawater into electricity.

The one megawatt unit would have screws which are about 5.5 metres in diameter.

The project is required to obtain all other necessary approvals, permits and authorizations.

It will be located near the Fundy Ocean Research Center for Energy in the Minas Passage and will use existing electricity grid connections.

A study commissioned by the Offshore Energy Research Association of Nova Scotia says by 2040, the tidal energy industry could contribute up to $1.7 billion to Nova Scotia's gross domestic product and create up to 22,000 full-time jobs, a transition that some argue should be planned by an independent body to ensure reliability.

Last month, Nova Scotia Power said it now generates 30 per cent of its power from renewables, as the province moves to increase wind and solar projects after abandoning the Atlantic Loop.

The utility says 18 per cent came from wind turbines, nine per cent from hydroelectric and tidal turbines and three per cent by burning biomass across its fleet.

However, over half of the province's electrical generation still comes from the burning of coal or petroleum coke, even as environmental advocates push to reduce biomass use in the mix. Another 13 per cent come from burning natural gas and five per cent from imports.


Related News

View more

The Phillipines wants nuclear power to be included in the country's energy mix as the demand for electricity is expected to rise.

Philippines Nuclear Energy Policy aims to add nuclear power to the energy mix via executive order, meeting rising electricity demand with 24/7 baseload while balancing safety, renewables, and imported fuel dependence in the Philippines.


Key Points

A government plan to include nuclear power in the energy mix to meet demand, ensure baseload, and uphold safety.

✅ Executive order proposed by Energy Secretary Alfonso Cusi

✅ Targets 24/7 baseload, rising electricity demand

✅ Balances safety, renewables, and energy security


Phillipines Presidential spokesman Salvador Panelo said Energy Secretary Alfonso Cusi made the proposal during last Monday's Cabinet meeting in Malacaaang. "Secretary Cusi likewise sought the approval of the issuance of a proposed executive order for the inclusion of nuclear power, including next-gen nuclear options in the country's energy mix as the Philippines is expected to the rapid growth in electricity and electricity demand, in which, 24/7 power is essential and necessary," Panelo said in a statement.

Panelo said Duterte would study the energy chief's proposal, as China's nuclear development underscores regional momentum. In the 1960s until the mid 80s, the late president Ferdinand Marcos adopted a nuclear energy program and built the Bataan Nuclear Plant.

The nuclear plant was mothballed after Corazon Aquino became president in 1986. There have been calls to revive the nuclear plant, saying it would help address the Philippines' energy supply issues. Some groups, however, said such move would be expensive and would endanger the lives of people living near the facility, citing Three Mile Island as a cautionary example.

Panelo said proposals to revive the Bataan Nuclear Plant were not discussed during the Cabinet meeting, even as debates like California's renewable classification continue to shape perceptions. Indigenous energy sources natural gas, hydro, coal, oil, geothermal, wind, solar, biomassand ethanol constitute more than half or 59.6%of the Philippines' energy mix.

Imported oil make up 31.7% while imported coal, reflecting the country's coal dependency, contribute about 8.7%.

Imported ethanol make up 0.1% of the energy mix, even as interest in atomic energy rises globally.

In 2018, Duterte said safety should be the priority when deciding whether to tap nuclear energy for the country's power needs, as countries like India's nuclear restart proceed with their own safeguards.


Related News

View more

Sign Up for Electricity Forum’s Newsletter

Stay informed with our FREE Newsletter — get the latest news, breakthrough technologies, and expert insights, delivered straight to your inbox.

Electricity Today T&D Magazine Subscribe for FREE

Stay informed with the latest T&D policies and technologies.
  • Timely insights from industry experts
  • Practical solutions T&D engineers
  • Free access to every issue

Live Online & In-person Group Training

Advantages To Instructor-Led Training – Instructor-Led Course, Customized Training, Multiple Locations, Economical, CEU Credits, Course Discounts.

Request For Quotation

Whether you would prefer Live Online or In-Person instruction, our electrical training courses can be tailored to meet your company's specific requirements and delivered to your employees in one location or at various locations.