Sustainable Development Technology Canada Announces Latest Call for Clean Technology Funding Applications

By Canada News Wire


High Voltage Maintenance Training Online

Our customized live online or in‑person group training can be delivered to your staff at your location.

  • Live Online
  • 12 hours Instructor-led
  • Group Training Available
Regular Price:
$599
Coupon Price:
$499
Reserve Your Seat Today
"If you have a new, innovative technology that helps address climate change or promotes cleaner water, land and air, we want to hear from you!" This is the word coming from Sustainable Development Technology Canada (SDTC), as it announced it is accepting Statements of Interest (SOI) for its twelfth round of funding. The closing date for submissions is October 24, 2007.

SDTC is a not-for-profit corporation created by the Government of Canada to finance and support the late-stage development and pre-commercial demonstration of clean technologies. SDTC is actively seeking applications for technology innovations that deliver clean water, clean soil, clean air, and a reduction in greenhouse gas emissions. Technologies that are designed to deal with more than one of these environmental issues simultaneously are encouraged.

"SDTC provides both coaching and funding to help strengthen a company's value proposition, consequently increasing the likelihood of successful market uptake," said Vicky J. Sharpe, President and CEO of SDTC. "The demand for clean technology solutions is increasing both in Canada and in our most important markets, so we are strongly encouraging entrepreneurs, academics - creative minds across the country to focus on this rapidly evolving and lucrative market, and to apply to SDTC."

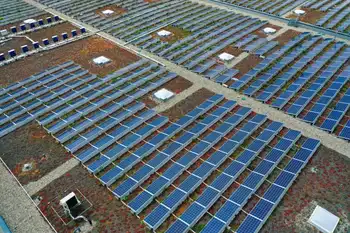
SDTC has released a series of SD Business Case reports that identify priority investment areas for renewable electricity generation, renewable fuels for both biofuel and hydrogen, and for cleaner conventional fuels in the oil and gas sector. The SD Business Case reports represent only some of SDTC's areas of interest; therefore to read the reports please go to the Knowledge Centre at www.sdtc.ca. Applicants are invited to submit technological solutions in all areas of sustainable development.

To date, SDTC has allocated $279 million to 124 clean technology projects. An additional $670 million has been leveraged from project consortia members, for a total portfolio value of $949 million.

The SOI is used for preliminary screening and is subject to a competitive review process by SDTC and a panel of independent experts. The applications are evaluated on the basis of fit with SDTC's mandate, adherence to selection criteria, and to ensure they include necessary technology, marketing, and business capabilities.

Applicants presenting the most compelling technology projects will be invited back to submit a detailed, full proposal for consideration toward funding.

Applications for funding may only be made through the online SOI application system. Prior to submitting an application, applicants are advised to read SDTC's Applications Advice and then contact an Applications Manager to ensure a good fit. Information about SDTC's funding process, including the online application system and Applications Advice, can be found in the Funding section at www.sdtc.ca.

SDTC holds two rounds of funding each year. The next call for SOIs will open February 27, 2008.

Related News

Surging electricity demand is putting power systems under strain around the world

Global Electricity Demand Surge strains power markets, fuels price volatility, and boosts coal and gas generation as renewables lag, driving emissions, according to the IEA, with grids and clean energy investment crucial through 2024.


Key Points

A surge in power use that strained supply, raised prices, and drove power-sector CO2 emissions to record highs.

✅ 6% demand growth in 2021; largest absolute rise ever

✅ Coal up 9%; gas +2%; renewables +6% could not meet demand

✅ Prices doubled vs 2020; volatility hit EU, China, India


Global electricity demand surged above pre-pandemic levels in 2021, creating strains in major markets, pushing prices to unprecedented levels and driving the power sector’s emissions to a record high. Electricity is central to modern life and clean electricity is pivotal to energy transitions, but in the absence of faster structural change in the sector, rising demand over the next three years could result in additional market volatility and continued high emissions, according an IEA report released today.

Driven by the rapid economic rebound, and more extreme weather conditions than in 2020, including a colder than average winter, last year’s 6% rise in global electricity demand was the largest in percentage terms since 2010 when the world was recovering from the global financial crisis. In absolute terms, last year’s increase of over 1 500 terawatt-hours was the largest ever, according to the January 2022 edition of the IEA’s semi-annual Electricity Market Report.

The steep increase in demand outstripped the ability of sources of electricity supply to keep pace in some major markets, with shortages of natural gas and coal leading to volatile prices, demand destruction and negative effects on power generators, retailers and end users, notably in China, Europe and India. Around half of last year’s global growth in electricity demand took place in China, where demand grew by an estimated 10%, highlighting that Asia is set to use half of global electricity by 2025 according to the IEA. China and India suffered from power cuts at certain points in the second half of the year because of coal shortages.

“Sharp spikes in electricity prices in recent times have been causing hardship for many households and businesses around the world and risk becoming a driver of social and political tensions,” said IEA Executive Director Fatih Birol. “Policy makers should be taking action now to soften the impacts on the most vulnerable and to address the underlying causes. Higher investment in low-carbon energy technologies including renewables, energy efficiency and nuclear power – alongside an expansion of robust and smart electricity grids – can help us get out of today’s difficulties.”

The IEA’s price index for major wholesale electricity markets almost doubled compared with 2020 and was up 64% from the 2016-2020 average. In Europe, average wholesale electricity prices in the fourth quarter of 2021 were more than four times their 2015-2020 average, and wind and solar generated more electricity than gas in the EU during the year.  Besides Europe, there were also sharp price increases in Japan and India, while they were more moderate in the United States where gas supplies were less perturbed.

Electricity produced from renewable sources grew by 6% in 2021, but it was not enough to keep up with galloping demand. Coal-fired generation grew by 9%, with soaring electricity and coal use serving more than half of the increase in demand and reaching a new all-time peak as high natural gas prices led to gas-to-coal switching. Gas-fired generation grew by 2%, while nuclear increased by 3.5%, almost reaching its 2019 levels. In total, carbon dioxide (CO2) emissions from power generation rose by 7%, also reaching a record high, after having declined the two previous years.

“Emissions from electricity need to decline by 55% by 2030 to meet our Net Zero Emissions by 2050 Scenario, but in the absence of major policy action from governments, those emissions are set to remain around the same level for the next three years,” said Dr Birol. “Not only does this highlight how far off track we currently are from a pathway to net zero emissions by 2050, but it also underscores the massive changes needed for the electricity sector to fulfil its critical role in decarbonising the broader energy system.”

For 2022-2024, the report anticipates electricity demand growing 2.7% a year on average, although the Covid-19 pandemic and high energy prices bring some uncertainty to this outlook. Renewables are set to grow by 8% per year on average, and low-emissions sources are expected to serve more than 90% of net demand growth during this period. We expect nuclear-based generation to grow by 1% annually during the same period.

As a consequence of slowing electricity demand growth and significant renewables additions, fossil fuel-based generation is expected to stagnate in the coming years, and renewables are set to surpass coal by 2025 with coal-fired generation falling slightly as phase-outs and declining competitiveness in the United States and Europe are balanced by growth in markets like China, where electricity demand trends remain a puzzle in recent analyses, and India. Gas-fired generation is seen growing by around 1% a year.


Related News

View more

Ottawa hands N.L. $5.2 billion for troubled Muskrat Falls hydro project

Muskrat Falls funding deal delivers federal relief to Newfoundland and Labrador: Justin Trudeau outlines loan guarantees, transmission investment, Hibernia royalties, and $10-a-day child care to stabilize hydroelectric costs and curb electricity rate hikes.


Key Points

A $5.2b federal plan aiding NL hydro via loan guarantees, transmission funds, and Hibernia royalties to curb power rates.

✅ $1b for transmission and $1b in federal loan guarantees

✅ $3.2b via Hibernia royalty transfers through 2047

✅ Limits power rate hikes; adds $10-a-day child care in NL


Prime Minister Justin Trudeau was in Newfoundland and Labrador Wednesday to announce a $5.2-billion ratepayer protection plan to help the province cover the costs of a troubled hydroelectric project ahead of an expected federal election call.

Trudeau's visit to St. John's, N.L., wrapped up a two-day tour of Atlantic Canada that featured several major funding commitments, and he concluded his day in Newfoundland and Labrador by announcing the province will become the fourth to strike a deal with Ottawa for a $10-a-day child-care program.

As he addressed reporters, the prime minister was flanked by the six Liberal members of Parliament from the province. He alluded to the mismanagement that led the over-budget Muskrat Falls hydroelectric project to become what Liberal Premier Andrew Furey has called an "anchor around the collective souls" of the province.

"The pressures and challenges faced by Newfoundlanders and Labradorians for mistakes made in the past is something that Canadians all needed to step up on, and that's exactly what we did," Trudeau said.

Furey, who joined Trudeau for the two announcements and was effusive in his praise for the federal government, said the federal funding will help Newfoundland and Labrador avoid a spike in electricity rates as customers start paying for Muskrat Falls ahead of when the project begins generating power this November.

"Muskrat Falls has been the No. 1 issue facing Newfoundlanders and Labradorians now for well over a decade," Furey said, adding that he is regularly asked by people whether their electricity rates are going to double, a concern other provinces address through rate legislation in Ontario as well.

"We landed on a deal today that I think -- I know -- is a big deal for Newfoundland and Labrador and will finally get the muskrat off our back," he said.

The agreement-in-principle between the two governments includes a $1-billion investment from Ottawa in a transmission through Quebec portion of the project, as well as $1 billion in loan guarantees. The rest will come from annual transfers from Ottawa equivalent to its annual royalty gains from its share in the Hibernia offshore oilfield, which sits off the coast of St. John's. Those transfers are expected to add up to about $3.2 billion between now and 2047, when the oilfield is expected to run dry.

The money will help cover costs set to come due when the Labrador project comes online, preventing rate increases that would have been needed to pay the bills, and officials have discussed a lump-sum bill credit to help households. Though electricity rates in the province will still rise, to 14.7 cents per kilowatt hour from the current 12.5 cents, that's well below the projected 23 cents that officials had said would be needed to cover the project's costs.

Muskrat Falls was commissioned in 2012 at a cost of $7.4 billion, but its price tag has since ballooned to $13.1 billion. Ottawa previously backed the project with billions of dollars in loan guarantees, and in December, Trudeau announced he had appointed Serge Dupont, former deputy clerk of the Privy Council, to oversee rate mitigation talks with the province about financially restructuring the project.

Its looming impact on the provincial budget is set against an already grim financial situation: the province projected an $826-million deficit in its latest budget, and a recent financial update from the provincial energy corporation reflected pandemic impacts, coupled with $17.2 billion in net debt.

After visiting with children from a daycare centre in the College of the North Atlantic, Trudeau and Furey announced that in 2023, the average cost of regulated child care in the province for children under six would be cut to $10 a day from $25 a day. Trudeau said that within five years, almost 6,000 new daycare spaces would be created in the province.

"As part of the agreement, a new full-day, year-round pre-kindergarten program for four-year-olds will also start rolling out in 2023," the prime minister told reporters. "For parents, this agreement is huge."

Newfoundland and Labrador is the fourth province, after Prince Edward Island, Nova Scotia and British Columbia, to sign on to the federal government's child-care program.


Related News

View more

U.S. Residents Averaged Fewer Power Outages in 2022

2022 U.S. Power Outage Statistics show lower SAIDI as fewer major events hit, with SAIFI trends, electric reliability, outage duration and frequency shaped by hurricanes, winter storms, vegetation, and utility practices across states.


Key Points

They report SAIDI and SAIFI for 2022, showing outage duration, frequency, and impacts of major weather events.

✅ 2022 SAIDI averaged 5.6 hours; SAIFI averaged 1.4 interruptions.

✅ Fewer major events lowered outage duration versus 2021.

✅ Hurricanes and winter storms drove long outages in several states.


In 2022, U.S. electricity consumers on average experienced about 5.5 hours of power disruptions, a decrease from nearly two hours compared to 2021. This information comes from the latest Annual Electric Power Industry Report. The reduction in yearly power interruptions primarily resulted from fewer significant events in 2022 compared to the previous year, and utility disaster planning continues to support grid resilience as severe weather persists.

Since 2013, excluding major events, the annual average duration of power interruptions has consistently hovered around two hours. Factors contributing to major power disruptions include weather-related incidents, vegetation interference near power lines, and specific utility practices, while pandemic-related grid operations influenced workforce planning more than outage frequency. To assess the reliability of U.S. electric utilities, two key indexes are utilized:

  • The System Average Interruption Duration Index (SAIDI) calculates the total length (in hours) an average customer endures non-brief power interruptions over a year.
  • The System Average Interruption Frequency Index (SAIFI) tracks the number of times interruptions occur.

The influence of major events on electrical reliability is gauged by comparing affected states' SAIDI and SAIFI values against the U.S. average, which was 5.6 hours of outages and 1.4 outages per customer in 2022. The year witnessed 18 weather-related disasters in the U.S., each resulting in over $1 billion in damages, and COVID-19 grid assessments indicated the electricity system was largely safe from pandemic impacts. Noteworthy major events include:

  • Hurricane Ian in September 2022, leaving over 2.6 million Floridian customers without electricity, with restoration in some areas taking weeks rather than days.
  • Hurricane Nicole in November 2022, causing over 300,000 Florida customers to lose power.
  • Winter Storm Elliott in December 2022, affecting over 1.5 million customers in multiple states including Texas where utilities struggled after Hurricane Harvey to restore service, and Florida, and bringing up to four feet of snow in parts of New York.

In 2022, states like Florida, West Virginia, Maine, Vermont, and New Hampshire experienced the most prolonged power interruptions, with New Hampshire averaging 10.3 hours and Florida 19.1 hours, and FPL's Irma storm response illustrates how restoration can take days or weeks in severe cases. Conversely, the District of Columbia, Delaware, Rhode Island, Nebraska, and Iowa had the shortest total interruptions, with the District of Columbia averaging just 34 minutes and Iowa 85 minutes.

The frequency of outages, unlike their duration, is more often linked to non-major events. Across the nation, Alaska recorded the highest number of power disruptions per customer (averaging 3.5), followed by several heavily forested states like Tennessee and Maine. Power outages due to falling tree branches are common, particularly during winter storms that burden tree limbs and power lines, as seen in a North Seattle outage affecting 13,000 customers. The District of Columbia stood out with the shortest and fewest outages per customer.


Related News

View more

Solar + Wind = 10% of US Electricity Generation in 1st Half of 2018

US Electricity Generation H1 2018 saw wind and solar gains but hydro declines, as natural gas led the grid mix and coal fell; renewables' share, GWh, emissions, and capacity additions shaped the power sector.


Key Points

It is the H1 2018 US power mix, where natural gas led, coal declined, and wind and solar grew while hydro fell.

✅ Natural gas reached 32% of generation, highest share

✅ Coal fell; renewables roughly tied nuclear at ~20%

✅ Wind and solar up; hydro output down vs 2017


To complement our revival of US electricity capacity reports, here’s a revival of our reports on US electricity generation.

As with the fresh new capacity report, things are not looking too bright when it comes to electricity generation. There’s still a lot of grey — in the bar charts below, in the skies near fossil fuel power plants, and in the human and planetary outlook based on how slowly we are cutting fossil fuel electricity generation.

As you can see in the charts above, wind and solar energy generation increased notably from the first half of 2017 to the first half of 2018, and the EIA expected larger summer solar and wind generation in subsequent months, reinforcing that momentum.

A large positive when it comes to the environment and human health is that coal generation dropped a great deal year over year — by even more than renewables increased, though the EIA later noted an increase in coal-fired generation in a subsequent year, complicating the trend. However, on the down side, natural gas soared as it became the #1 source of electricity generation in the United States (32% of US electricity). Furthermore, coal was still solidly in the #2 position (27% of US electricity). Renewables and nuclear were essentially in a tie at 19.8% of generation, with renewables just a tad above nuclear.

Actually, combined with an increase in nuclear power generation, natural gas electricity production increased so much that the renewable energy share of electricity generation actually dropped in the first half of 2018 versus the first half of 2017, even amid declining electricity use in some periods. It was 19.8% this year and 20% last year.

Again, solar and wind saw a significant growth in its market share, from 9% to 9.9%, but hydro brought the whole category down due to a decrease from 9% to 8%.

The visuals above are probably the best way to examine it all. The H1 2018 chart was still dominated by fossil fuels, which together accounted for approximately 60% of electricity generation, even though by 2021 non-fossil sources supplied about 40% of U.S. electricity, highlighting the longer-term shift. In H1 2017, the figure was 59.7%. Furthermore, if you switch to the “Change H1 2018 vs H1 2017 (GWh)” chart, you can watch a giant grey bar representing natural gas take over the top of the chart. It almost looks like it’s part of the border of the chart. The biggest glimmer of positivity in that chart is seeing the decline in coal at the bottom.

What will the second half of the year bring? Well, the gigantic US electricity generation market shifts slowly, even as monthly figures can swing, as January generation jumped 9.3% year over year according to the EIA, reminding us about volatility. There is so much base capacity, and power plants last so long, that it takes a special kind of magic to create a rapid transition to renewable energy. As you know from reading this quarter’s US renewable energy capacity report, only 43% of new US power capacity in the first half of the year was from renewables. The majority of it was from natural gas. Along with other portions of the calculation, that means that electricity generation from natural gas is likely to increase more than electricity generation from renewables.

Jump into the numbers below and let us know if you have any more thoughts.


Related News

View more

Wind Power Surges in U.S. Electricity Mix

U.S. Wind Power 2025 drives record capacity additions, with FERC data showing robust renewable energy growth, IRA incentives, onshore and offshore projects, utility-scale generation, grid integration, and manufacturing investment boosting clean electricity across key states.


Key Points

Overview of record wind additions, IRA incentives, and grid expansion defining the U.S. clean electricity mix in 2025.

✅ FERC: 30.1% of new U.S. capacity in Jan 2025 from wind

✅ Major projects: Cedar Springs IV, Boswell, Prosperity, Golden Hills

✅ IRA incentives drive onshore, offshore builds and manufacturing


In early 2025, wind power has significantly strengthened its position in the United States' electricity generation portfolio. According to data from the Federal Energy Regulatory Commission (FERC), wind energy accounted for 30.1% of the new electricity capacity added in January 2025, and as the most-used renewable source in the U.S., it also surpassed the previous record set in 2024. This growth is attributed to substantial projects such as the 390.4 MW Cedar Springs Wind IV and the 330.0 MW Boswell Wind Farm in Wyoming, along with the 300.0 MW Prosperity Wind Farm in Illinois and the 201.0 MW Golden Hills Wind Farm Expansion in Oregon. 

The expansion of wind energy capacity is part of a broader trend where solar and wind together accounted for over 98% of the new electricity generation capacity added in the U.S. in January 2025. This surge is further supported by the federal government's Inflation Reduction Act (IRA) and broader policy support for renewables, which has bolstered incentives for renewable energy projects, leading to increased investments and the establishment of new manufacturing facilities. 

By April 2025, clean electricity sources, including wind and solar, were projected to surpass 51% of total utility-scale electricity generation in the U.S., building on a 25.5% renewable share seen in recent data, marking a significant milestone in the nation's energy transition. This achievement is attributed to a combination of factors: a seasonal drop in electricity demand during the spring shoulder season, increased wind speeds in key areas like Texas, and higher solar production due to longer daylight hours and expanded capacity in states such as California, Arizona, and Nevada, supported by record installations across the solar and storage industry. 

Despite a 7% decline in wind power production in early April compared to the same period in 2024—primarily due to weaker wind speeds in regions like Texas—the overall contribution of wind energy remained robust, supported by an 82% clean-energy pipeline that includes wind, solar, and batteries. This resilience underscores the growing reliability of wind power as a cornerstone of the U.S. electricity mix. 

Looking ahead, the U.S. Department of Energy projects that wind energy capacity will continue to grow, with expectations of adding between 7.3 GW and 9.9 GW in 2024, and potentially increasing to 14.5 GW to 24.8 GW by 2028. This growth is anticipated to be driven by both onshore and offshore wind projects, with onshore wind representing the majority of new additions, continuing a trajectory since surpassing hydro capacity in 2016 in the U.S.

Early 2025 has witnessed a notable increase in wind power's share of the U.S. electricity generation mix. This trend reflects the nation's ongoing commitment to expanding renewable energy sources, especially after renewables surpassed coal in 2022, supported by favorable policies and technological advancements. As the U.S. continues to invest in and develop wind energy infrastructure, the role of wind power in achieving a cleaner and more sustainable energy future becomes increasingly pivotal.


Related News

View more

Mike Sangster to Headline Invest in African Energy Forum

TotalEnergies Africa Energy Strategy 2025 spotlights oil, gas, LNG, and renewables, with investments in Namibia, Congo, Mozambique, Uganda, Morocco, and South Africa, driving upstream growth, clean energy, and energy transition partnerships.


Key Points

An investment roadmap uniting oil, gas, LNG, and renewables to speed Africa's upstream growth and energy transition.

✅ Keynote by Mike Sangster at IAE Paris 2025.

✅ Oil, gas, LNG projects across Namibia, Congo, Mozambique, Uganda.

✅ Scaling renewables: solar, wind, green ammonia for export.


Mike Sangster, Senior Vice President for Africa at TotalEnergies, will play a pivotal role in the upcoming Invest in African Energy (IAE) Forum, which will take place in Paris on May 13-14, 2025. As a key figure in one of the world’s largest energy companies, Sangster's participation in the forum is expected to offer crucial insights into Africa’s evolving energy landscape, particularly in the areas of oil, gas, and renewable energy.

TotalEnergies' Role in Africa's Energy Landscape

TotalEnergies has long been a major player in Africa’s energy sector, driving development across both emerging and established markets. The company has a significant footprint in countries such as Namibia, the Republic of Congo, Libya, Mozambique, Uganda, and South Africa. TotalEnergies’ investments span both traditional oil and gas projects as well as renewable energy initiatives, reflecting its commitment to a more diversified energy future for Africa.

In Namibia, for instance, TotalEnergies is advancing its Venus-1 discovery, with plans to produce its first oil by the end of the decade. The company is also heavily involved in the Orange Basin exploration. Meanwhile, in the Republic of Congo, TotalEnergies is investing $600 million to enhance deepwater production at its Moho Nord field.

Beyond oil and gas, the company is expanding its renewable energy portfolio across the continent. This includes significant solar, wind, and hydropower projects, such as the 500 MW Sadada solar project in Libya, a 216 MW solar plant with battery storage in South Africa, and a 1 GW wind and solar project in Morocco designed to produce green ammonia for export.

The Invest in African Energy Forum

The IAE Forum, which TotalEnergies’ Sangster will headline, is an exclusive event aimed at facilitating investment between African energy markets and global investors, including discussions on COVID-19 funding for electricity access mechanisms that emerged, and their relevance to current capital flows. With a focus on fostering partnerships and discussions about the future of energy in Africa, the event will bring together industry experts, project developers, investors, and policymakers for two days of intensive engagement.

The forum will also serve as a crucial platform for sharing perspectives on the role of private investment, as outlined in the IEA investment outlook for Africa's power systems, in Africa’s energy future, strategies for unlocking new upstream opportunities, and the transition to a more sustainable energy system. This makes Sangster's participation, as someone directly involved in both conventional and renewable energy projects across the continent, particularly significant.

TotalEnergies' Diversified Strategy in Africa

Sangster’s keynote address and participation in an exclusive fireside chat will provide an in-depth look into TotalEnergies’ strategy for Africa. His insights will touch upon the company's ongoing projects in the oil and gas sectors, as well as its renewable energy investments. TotalEnergies has committed to making its portfolio more sustainable, underscored by its recent VSB acquisition to expand renewables capabilities, while continuing to be a leader in the energy transition.

One of the company’s notable projects is the Mozambique LNG initiative, a $20 billion venture aimed at supplying liquefied natural gas to international markets. Additionally, TotalEnergies is gearing up for the first oil from its Tilenga field in Uganda, which will be transported through the East African Crude Oil Pipeline (EACOP), the longest heated crude oil pipeline in the world.

In South Africa, TotalEnergies is constructing one of the largest renewable energy projects, a 216 MW solar power plant with integrated battery storage. This project is expected to significantly contribute to the country’s clean energy ambitions. Furthermore, in Morocco, TotalEnergies is developing a major wind and solar facility that will produce green ammonia, aligning with its broader strategy to provide solutions for Europe’s energy needs.

Africa’s Energy Transition

The forum’s timing could not be more critical, given the pressing need for an energy transition in Africa. While the continent remains heavily reliant on fossil fuels for its energy needs, there is growing momentum toward incorporating renewable energy sources, a point reinforced by the IRENA renewables report on decarbonisation and quality of life, which highlights the transformative potential. Africa’s vast natural resources, combined with global investments and partnerships, position the continent as a key player in the global shift toward sustainable energy.

However, Africa faces unique challenges in transitioning to renewable energy, reflecting a broader Sub-Saharan electricity challenge that also presents opportunity, across many markets. These challenges include a lack of infrastructure, financial constraints, and the need for increased political stability in certain regions. The IAE Forum provides an opportunity to address these barriers, with industry leaders like Sangster offering solutions based on real-world experiences and investments.

As the energy sector continues to evolve globally, and even if electricity systems are unlikely to go fully green this decade according to some outlooks, Africa's potential remains vast. The continent’s diverse energy resources, from oil and gas to renewables, offer a unique opportunity to build a more sustainable and resilient energy future. The Invest in African Energy Forum serves as an important platform for global stakeholders to collaborate, learn, and invest in the energy transformation taking place across the continent.

Mike Sangster’s insights at the forum will undoubtedly shape discussions on how companies like TotalEnergies are navigating the intersection of universal electricity access goals, sustainability, and economic growth in Africa. With Africa’s energy needs expected to increase exponentially in the coming decades, ensuring that these needs are met sustainably and equitably will be a priority for both policymakers and private investors.

As the global energy landscape continues to shift, the Invest in African Energy Forum provides a critical space for shaping the future of Africa’s energy sector, offering invaluable opportunities for investment, innovation, and collaboration.


Related News

View more

Sign Up for Electricity Forum’s Newsletter

Stay informed with our FREE Newsletter — get the latest news, breakthrough technologies, and expert insights, delivered straight to your inbox.

Electricity Today T&D Magazine Subscribe for FREE

Stay informed with the latest T&D policies and technologies.
  • Timely insights from industry experts
  • Practical solutions T&D engineers
  • Free access to every issue

Live Online & In-person Group Training

Advantages To Instructor-Led Training – Instructor-Led Course, Customized Training, Multiple Locations, Economical, CEU Credits, Course Discounts.

Request For Quotation

Whether you would prefer Live Online or In-Person instruction, our electrical training courses can be tailored to meet your company's specific requirements and delivered to your employees in one location or at various locations.