Echelon, T-Mobile work together to reduce cost of smart grid

By Business Wire


CSA Z462 Arc Flash Training - Electrical Safety Essentials

Our customized live online or in‑person group training can be delivered to your staff at your location.

  • Live Online
  • 6 hours Instructor-led
  • Group Training Available
Regular Price:
$249
Coupon Price:
$199
Reserve Your Seat Today
Echelon Corp. and T-Mobile USA, Inc., announced an alliance to accelerate the adoption of the smart grid in the North American market by reducing the communications cost of smart meters through the deployment of EchelonÂ’s Networked Energy Services (NES) system over T-MobileÂ’s GSM cellular network.

As part of the agreement, Echelon will utilize a first-of-its-kind embedded T-Mobile SIM within a cellular radio module to enable all the Echelon smart meters on a given low voltage transformer to communicate back to the utility over the smart grid, and T-Mobile will offer users of EchelonÂ’s NES system innovative and cost-effective pricing plans for data usage.

Many advanced metering infrastructure (AMI) systems in the North American market require utilities to deploy their own wireless communications infrastructure, encumbering the utility with the initial cost of building the network and with the ongoing maintenance costs required to keep it operating reliably. Public wireless telecommunications networks have been built to sustain the high-traffic needs of the consumer market and are very reliable.

This joint announcement allows electric utilities using EchelonÂ’s NES system to take advantage of the enormous investment that T-Mobile has made in its network and to leverage the 24/7 maintenance commitment of T-Mobile to keep its network operating at maximum efficiency.

EchelonÂ’s NES advanced metering infrastructure is leading the worldwide transformation of the electricity grid into a smart energy network, and T-Mobile USAÂ’s nationwide network serves more than 32 million customers with reliable wireless voice and data services.

“We believe the initiative we have announced today with T-Mobile should fundamentally change the way utilities in North America think about deploying AMI systems,” said Jim Andrus, Echelon vice president of NES Sales Americas. “While the investment in coverage, reliability and security of carriers such as T-Mobile is unmatched by what a utility could do on their own, the operating costs of public networks have traditionally limited their use in the North American market. In contrast, aggressive pricing plans have made the use of the public cellular networks as the backhaul of smart grid systems the norm in Europe. We believe the programs we have put in place with T-Mobile can have the same impact on the North American market.”

John Horn, national director for M2M, T-Mobile USA, said, “Utilizing T-Mobile’s robust wireless network allows Echelon and its clients to focus on smart grid solutions rather than on building and maintaining a costly and complex private communications infrastructure. Through this agreement and the exciting introduction of our new pricing plans and embedded SIM — which will deliver a very small, durable solution built to withstand challenging environmental factors such as temperature and humidity — we expect innovation and adoption of smart grid solutions to accelerate.”

“T-Mobile is excited to play a meaningful role in providing the communications infrastructure for these innovative services to flourish,” Horn added.

Related News

Parsing Ontario's electricity cost allocation

Ontario Global Adjustment and ICI balance hydro rates, renewable cost shift, and peak demand. Class A and Class B customers face demand response decisions amid pandemic occupancy uncertainty and volatile GA charges through 2022.


Key Points

A pricing model where GA costs and ICI peak allocation shape Class A/B bills, driven by renewables cost shifts.

✅ Renewable cost shift trims GA; larger Class A savings expected.

✅ Class A peak strategy returns; occupancy uncertainty persists.

✅ Class B faces volatile GA; limited levers beyond efficiency.


Ontario’s large commercial electricity customers can approach the looming annual decision about their billing structure for the 12 months beginning July 1 with the assurance of long-term relief on a portion of their costs, amid changes coming for electricity consumers that could affect planning. That’s to be weighed against uncertainties around energy demand and whether a locked-in cost allocation formula that looked favourable in pre-pandemic times will remain so until June 30, 2022.

“The biggest unknown is we just don’t know when the people are coming back,” Jon Douglas, director of sustainability with Menkes Property Management Services, reflected during a webinar sponsored by the Building Owners and Managers Association (BOMA) of Greater Toronto last week. “The occupancy in our office buildings this fall, and going into the new year, could really impact the outcome of the decision.”

After a year of operational upheaval and more modifications to provincial electricity pricing policies, BOMA Toronto’s regularly scheduled workshop ahead of the June 15 deadline for eligible customers to opt into the Industrial Conservation Initiative (ICI) program had a lot of ground to cover. Notably, beginning in January, all commercial customers have seen a reduction in the global adjustment (GA) component of their monthly hydro bills after the Ontario government shifted costs associated with contracted non-hydroelectric renewable supply to reduce the burden on industrial ratepayers from electricity rates to the general provincial account — a move that trims approximately $258 million per month from the total GA charged to industrial and commercial customers. However, they won’t garner the full benefit of that until 2022 since they’re currently repaying about $333 million in GA costs that were deferred in April, May and June of 2020.

Renewable cost shift pares the global adjustment
For now, Ontario government officials estimate the renewable cost shift equates to a 12 per cent discount relative to 2020 prices, even as typical bills may rise about 2% as fixed pricing ends in some cases. Once last year’s GA deferral is repaid at the end of 2021, they project the average Class A customer participating in the ICI program should realize a 16 per cent saving on the total hydro bill, while Class B customers paying the GA on a volumetric per kilowatt-hour (kWh) basis will see a slightly more moderate 15 per cent decrease.

“This is the biggest change to electricity pricing that’s happened since the introduction of ICI,” Tim Christie, director of electricity policy, economics and system planning for Ontario’s Ministry of Energy, Northern Development and Mines, told online workshop attendees. “The government is funding the out-of-market costs of renewables. It does tail off into the 2030s as those contracts (for wind, solar and biomass generation) expire, but over the next eight-ish years, it’s pretty steady at around just over $3 billion per year.”

Extrapolating from 2020 costs, he pegged average electricity costs at roughly 9.1 cents/kWh for Class A commercial customers and 13.2 cents/kWh for Class B, a point of concern for Ontario manufacturers facing high rates as well. However, energy management specialists suggest actual 2021 numbers haven’t proved that out.

“In commercial buildings, we’re averaging 10 to 12 cents for Class A in 2021, and we’re seeing more than that for about 14, 15 cents for Class B,” reported Scott Rouse, managing partner with the consulting firm, Energy@Work.

GA costs for Class B customers dropped nearly 30 per cent in the first four months of 2021 compared to the last four months of 2020, when they averaged 11.8 cents/kWh. Thus far, though, there have been significant month-to-month fluctuations, with a low of 5.04 cents/kWh in February and a high of 10.9 cents/kWh in April contributing to the four-month average of 8.3 cents/kWh.

“In 2020, system-wide GA very often averaged more than $1 billion per month,” Rouse said. “This February it dropped to $500 million, which was really quite surprising. So it is a very volatile cost.”

Although welcome, the renewable cost shift does alter the payback on energy-saving investments, particularly for demand response mechanisms like energy storage. When combined with pandemic-related uncertainty and a series of policy and program reversals alongside calls to clean up Ontario’s hydro policy in recent years, the industry’s appetite for some more capital-intensive technologies appears to be flagging.

“Volatility puts a pause on some of the innovation,” said Terry Flynn, general manager with BentallGreenOak and chair of BOMA Toronto’s energy committee. “It could be a leading edge, but it might be a bleeding edge that won’t bear any fruit because the way the commodity costs are structured will change.”

“There’s kind of a wait-and-see approach on some of these bigger investments,” Douglas concurred.

Industrial Conservation Initiative underpins commercial class divide
Turning to the ICI, Class A customers — defined as those with average monthly energy demand of at least 1 megawatt (MW) — encountered some unexpected changes to the program rules during 2020. Meanwhile, Class B customers — encompassing the vast share of commercial properties smaller than about 350,000 square feet — confront the persistent reality of electricity cost allocation that offloads the burden from larger players onto them.

Through the ICI, participating Class A customers pay a share of the global adjustment that’s prorated to their energy use during the five hours of the period from May 1 to April 30 when the highest overall system demand is recorded. This gives Class A customers the opportunity to lock in a favourable factor for calculating their share of monthly system-wide global adjustment costs if they can successful project and curtail energy loads during those five hours of peak demand. On the flipside, Class B customers pay the remainder of those system-wide costs, on a straightforward per-kWh basis, once Class A payments have been reconciled.

“Class B has sometimes been regarded as the forgotten middle child of the customer classes in Ontario where all the shifted costs in the system kind of pile up,” acknowledged Mark Olsheski, vice president, energy and environment, with Sussex Strategy Group. “Likewise, there can be big unpredictable and uncontrollable swings in the global adjustment rate from month to month and, outside of pure energy efficiency, there really is precious little opportunity or empowerment for a Class B customer to take actions to lower their bills.”

Nevertheless, COVID-19 presents a few extra hiccups for Class A customers this year. Conventionally, late May is when they receive notification of the cost allocation factor that would be used to determine their GA for the upcoming July 1 to June 30 period. This year, though, all current ICI participants will retain the factor they secured by responding to the five hours of peak demand during the 12 months from May 1, 2019 to April 30, 2020 after the Ontario government placed a temporary halt on the peak demand response aspect of the program last summer. Regardless, eligible ICI participants must formally opt into the program by June 15 or they will be billed as Class B customers.

Peak chasing resumes for summer 2021
Since peak demand hours conventionally occur from June to September, Class A customers will once again be studying forecasts intently and preparing to respond via Peak Perks as the heat wave season sets in. That should help alleviate some of the system stresses that arose last summer — prompting policy-makers to reject lobbying for a continued pause on peak demand response.

“The policy rationale was to allow consumers to focus on their operations when recovering from COVID as opposed to reducing peaks. The other issue was that we did not expect the peaks to be high last summer given COVID shutdowns,” Christie recounted. “But due to some hot weather, more people at home and also the lack of ICI response, we saw peaks we haven’t seen in many, many years come up last summer. So the peak hiatus has ended and this summer we’ll be back to responding to ICI as per normal.”

Among Class A customers, owners/managers of office and retail facilities generally have the most to lose from a billing formula tied to the energy demand of more densely occupied buildings in the summer of 2019. However, they could be much more competitively positioned for 2022-23 if their buildings remain below full occupancy and energy demand stays lower than usual this summer.

“Where we can improve is the IESO (Independent Electricity System Operator) and the LDCs (local distribution companies) need to help customers get their real-time data, especially in light of the phantom demand issue, interpret their bills and their Class A versus B scenarios much more easily and comprehensively,” urged Lee Hodgkinson, vice president, technical services, sustainability and ESG, with Dream Unlimited. “ I look for APIs (application programming interface) and direct data flow from the LDCs to the building owners so that we can access that data really easily.”

Given Class A’s historic advantages, few eligible ICI participants are expected to migrate out to Class B. From a sustainability perspective, there’s perhaps more cause to question how the ICI’s 1-MW threshold encourages strategies to move in the other direction.

“You could jack up demand in some buildings and get them into Class A basically by firing up the chillers on the weekend and then pouring cooling outside to get rid of it,” Douglas noted. “That has nothing to do with climate change strategy or sustainability, but it’s a cost- saving strategy, and, sometimes, when you look at the math, it’s hundreds of thousands of dollars you can save.”

Brian Hewson, vice president, consumer protection and industry performance with the Ontario Energy Board (OEB), confirmed the OEB is currently scrutinizing the discrepancy that leaves Class B as the only consumer group with no flexibility to curtail energy load during higher-priced periods, and will be providing advice to the Ministry of Energy. In the interim, that status does, at least, simplify tactics.

“Just reduce your kWh and it doesn’t matter what time of day because you’re paying that fixed rate for 24 hours a day. So if you can curb your demand at night, you get a big bang for your dollar,” Rouse advised.

“We do talk about rates a lot, but if you’re not using it, you’re not paying for it,” Flynn agreed. “A lot of our focus is still on really to try to reduce the number of kilowatts that we use. That seems to be the best thing to do.”


Related News

View more

Electricity prices rise more than double EU average in first half of 2021

Estonia energy prices 2021 show sharp electricity hikes versus the EU average, mixed natural gas trends, kWh tariffs on Nord Pool spiking, and VAT, taxes, and support measures shaping household bills.


Key Points

EU-high electricity growth, early gas dip, then Nord Pool spikes; taxes, VAT, and subsidies shaped energy bills.

✅ Electricity up 7% on year; EU average 2.8% in H1 2021.

✅ Gas fell 1% in H1; later spiked with global market.

✅ VAT, taxes, excise and aid impacted household costs.


Estonia saw one of the highest rates in growth of electricity prices in the first half of 2021, compared with the same period in key trends in 2020 across Europe. These figures were posted before the more recent, record level of electricity and natural gas prices; the latter actually dropped slightly in Estonia in the first half of the year.

While electricity prices rose 7 percent on year in the first half of 2021 in Estonia, the average for the EU as a whole, where energy prices drove inflation across the bloc, stood at 2.8 percent over the same period, BNS reports.

Hungary (€10 per 100 Kwh) and Bulgaria (€10.20 per 100 Kwh) saw the lowest electricity prices EU-wide, while at €31.9 per KWH, Germany's power prices posted the most expensive rate, while Denmark, Belgium and Ireland also had high prices, in excess of €25 per Kwh.

Slovenia saw the highest electricity price rise, at 15 percent, and even the United States' electricity prices saw their steepest rise in decades during the same era, while Estonia was in third place, joint with Romania at 7 percent as noted, and behind Poland (8 percent).

Lithuania, on the other hand, experienced the third highest electricity price fall over the first half of 2021, compared with the same period in 2020, at 6 percent, behind only Cyprus (7 percent) and the Netherlands (10 percent, largely due to a tax cut).

Urmas Reinsalu: VAT on electricity, gas and heating needs to be lowered
The EU average price of electricity was €21.9 percent per Kwh, with taxes and excise accounting for 39 percent of this, even as prices in Spain surged across the day-ahead market.

Estonia has also seen severe electricity price rises in the second half of the year so far, with records set and then promptly broken several times earlier in October, while an Irish electricity provider raised prices amid similar pressures, and a support package for low income households rolled out for the winter season (October to March next year). The price on the Nord Pool market as of €95.01 per Kwh; a day earlier it had stood at €66.21 per Kwh, while on October 19 the price was €140.68 per Kwh.

Gas prices
Natural gas prices to household, meanwhile, dropped in Estonia over the same period, at a sharper rate (1 percent) than the EU average (0.5 percent), according to Eurostat.

Gas prices across the EU were lowest in Lithuania (€2.8 per 100 Kwh) and highest in the Netherlands (€9.6 per KWH), while the highest growth was seen in Denmark (19 percent), in the first half of 2021.

Natural gas prices dropped in 20 member states, however, with the largest drop again coming in Lithuania (23 percent).

The average price of natural gas EU-side in the first half of 2021 was €6.4, and taxes and excise duties accounted on average for 36 percent of the total.

The second half of the year has seen steep gas price rises in Estonia, largely the result of increases on the world market, though European gas benchmarks later fell to pre-Ukraine war levels.


Related News

View more

Electricity use actually increased during 2018 Earth Hour, BC Hydro

Earth Hour BC highlights BC Hydro data on electricity use, energy savings, and participation in the Lower Mainland and Vancouver Island amid climate change and hydroelectric power dynamics.


Key Points

BC observance tracking BC Hydro electricity use and conservation during Earth Hour, amid hydroelectric power dominance.

✅ BC Hydro reports rising electricity use during Earth Hour 2018

✅ Savings fell from 2% in 2008 to near zero province-wide

✅ Hydroelectric grid yields low GHG emissions in BC


For the first time since it began tracking electricity use in the province during Earth Hour, BC Hydro said customers used more power during the 60-minute period when lights are expected to dim, mirroring all-time high electricity demand seen recently.

The World Wildlife Fund launched Earth Hour in Sydney, Australia in 2007. Residents and businesses there turned off lights and non-essential power as a symbol to mark the importance of combating climate change.

The event was adopted in B.C. the next year and, as part of that, BC Hydro began tracking the megawatt hours saved.

#google#

In 2008, residents and businesses achieved a two per cent savings in electricity use. But since then, BC Hydro says the savings have plummeted.

The event was adopted in B.C. the next year and, as part of that, BC Hydro began tracking the megawatt hours saved.

In 2008, residents and businesses achieved a two per cent savings in electricity use. But since then, BC Hydro says the savings have plummeted, as record-breaking demand in 2021 and beyond changed consumption patterns.


Lights on

For Earth Hour this year, which took place 8:30-9:30 p.m. on March 24, BC Hydro says electricity use in the Lower Mainland increased by 0.5 per cent, even as it activated a winter payment plan to help customers manage bills. On Vancouver Island it increased 0.6 per cent.

In the province's southern Interior and northern Interior, power use remained the same during the event.

On Friday, the utility released a report called: "lights out". Why Earth Hour is dimming in BC. which explores the decline of energy savings related to Earth Hour in the province.

The WWF says the way in which hydro companies track electricity savings during Earth Hour is not an accurate measure of participation, and tracking of emerging loads like crypto mining electricity use remains opaque, and noted that more countries than ever are turning off lights for the event.

For 2018, the WWF shifted the focus of Earth Hour to the loss of wildlife across the globe.

BC Hydro says in its report that the symbolism of Earth Hour is still important to British Columbians, but almost all power generation in B.C. is hydroelectric, though recent drought conditions have required operational adjustments, and only accounts for one per cent of greenhouse gas emissions.


Related News

View more

Crossrail will generate electricity using the wind created by trains

Urban Piezoelectric Energy Textiles capture wind-driven motion on tunnels, bridges, and facades, enabling renewable microgeneration for smart cities with decentralized power, resilient infrastructure, and flexible lamellae sheets that harvest airflow vibrations.


Key Points

Flexible piezoelectric sheets that convert urban wind and vibration into electricity on tunnels, bridges, and facades.

✅ Installed on London Crossrail to test airflow energy capture

✅ Flexible lamellae panels retrofit tunnels, bridges, facades

✅ Supports decentralized, resilient urban microgrids


Charlotte Slingsby and her startup Moya Power are researching piezo-electric textiles that gain energy from movement, similar to advances like a carbon nanotube energy harvester being explored by materials researchers. It seems logical that Slingsby originally came from a city with a reputation for being windy: “In Cape Town, wind is an energy source that you cannot ignore,” says the 27-year-old, who now lives in London.

Thanks to her home city, she also knows about power failures. That’s why she came up with the idea of not only harnessing wind as an alternative energy source by setting up wind farms in the countryside or at sea, but also for capturing it in cities using existing infrastructure.


The problem

The United Nations estimates that by 2050, two thirds of the world’s population will live in cities. As a result, the demand for energy in urban areas will increase dramatically, spurring interest in nighttime renewable technology that can operate when solar and wind are variable. Can the old infrastructure grow fast enough to meet demand? How might we decentralise power generation, moving it closer to the residents who need it?

For a pilot project, she has already installed grids of lamellae-covered plastic sheets in tunnels on London Crossrail routes; the draft in the tube causes the protrusions to flutter, which then generates electricity.

“If we all live in cities that need electricity, we need to look for new, creative ways to generate it, including nighttime solar cells that harvest radiative cooling,” says Slingsby, who studied design and engineering at Imperial College and the Royal College of Art. “I wanted to create something that works in different situations and that can be flexibly adapted, whether you live in an urban hut or a high-rise.”

The yield is low compared to traditional wind power plants and is not able to power whole cities, but Slingsby sees Moya Power as just a single element in a mixture of urban energy sources, alongside approaches like gravity power that aid grid decarbonization.

In the future, Slingsby’s invention could hang on skyscrapers, in tunnels or on bridges – capturing power in the windiest parts of the city, alongside emerging air-powered generators that draw energy from humidity. The grey concrete of tunnels and urban railway cuttings could become our cities’ most visually appealing surfaces...


Related News

View more

Freezing Rain Causes Widespread Power Outages in Quebec

Quebec Ice Storm 2025 disrupted power across Laurentians and Lanaudiere as freezing rain downed lines; Hydro-QuE9bec crews accelerated grid restoration, emergency response, and infrastructure resilience amid ongoing outages and severe weather alerts.


Key Points

Quebec Ice Storm 2025 brought freezing rain, outages, and grid damage, hitting Laurentians and Lanaudiere hardest.

✅ Peak: 62,000 Hydro-QuE9bec customers without electricity

✅ Most outages in Laurentians and Lanaudiere regions

✅ Crews repairing lines; restoration updates ongoing


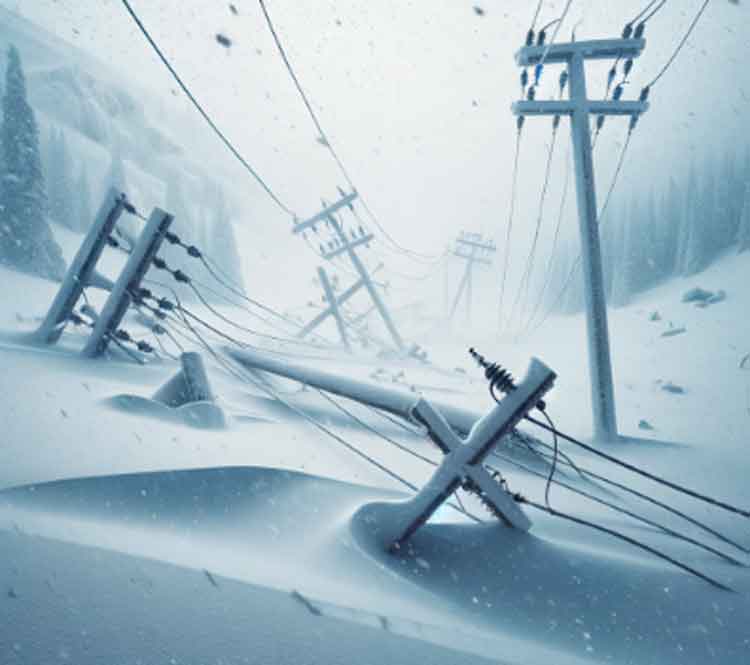
A significant weather event struck Quebec in late March 2025, as a powerful ice storm caused widespread power outages across the province. The storm led to extensive power outages, affecting tens of thousands of residents, particularly in the Lanaudière and Laurentians regions. ​

Impact on Power Infrastructure

The freezing rain accumulated on power lines and vegetation, leading to numerous power outages across the network. Hydro-Québec reported that at its peak, over 62,000 customers were without electricity, with the majority of outages concentrated in the Laurentians and Lanaudière regions. By the afternoon, the number decreased to approximately 30,000, and further to just under 18,500 by late afternoon. 

Comparison with Previous Storms

While the March 2025 ice storm caused significant disruptions, it was less severe compared to the catastrophic ice storm of April 2023, which left 1.1 million Hydro-Québec customers without power. Nonetheless, the 2025 storm's impact was considerable, leading to the closure of municipal facilities and posing challenges for local economies, a pattern echoed when Toronto outages persisted for hundreds after a spring storm.

Ongoing Challenges

As of April 1, 2025, some areas continued to experience power outages, and incidents such as a manhole fire left thousands without service in separate cases. Hydro-Québec and municipal authorities worked diligently to restore services and address the aftermath of the storm, while Hydro One crews restored power to more than 277,000 customers after damaging storms in Ontario. Residents were advised to stay updated through official channels for restoration timelines and safety information.

Future Preparedness

The recurrence of such severe weather events highlights the importance of robust infrastructure and emergency preparedness, as seen in BC Hydro's storm response to an 'atypical' event that demanded extensive coordination. Both utility companies and residents must remain vigilant, especially during seasons prone to unpredictable weather patterns, with local utilities like Sudbury Hydro crews working to reconnect service after regional storms.


Related News

View more

Enel Starts Operations of 450 MW Wind Farm in U.S

High Lonesome Wind Farm powers Texas with 500 MW of renewable energy, backed by a 12-year PPA with Danone North America and a Proxy Revenue Swap, cutting CO2 emissions as Enel's largest project to date.


Key Points

A 500 MW Enel wind project in Texas, supplying renewable power via PPAs and hedged by a Proxy Revenue Swap.

✅ 450 MW online; expanding to 500 MW in early 2020

✅ 12-year PPA with Danone North America for 20.6 MW

✅ PRS hedge with Allianz and Nephila stabilizes revenues


Enel, through its US renewable subsidiary Enel Green Power North America, Inc. (“EGPNA”), has started operations of its 450 MW High Lonesome wind farm in Upton and Crockett Counties, in Texas, the largest operational wind project in the Group’s global renewable portfolio, alongside a recent 90 MW Spanish wind build in its European pipeline. Enel also signed a 12-year, renewable energy power purchase agreement (PPA) with food and beverage company Danone North America, a Public Benefit Corporation, for physical delivery of the renewable electricity associated with 20.6 MW, leading to an additional 50 MW expansion of High Lonesome that will increase the plant’s total capacity to 500 MW. The construction of the 50 MW expansion is currently underway and operations are due to start in the first quarter of 2020.

“The start of operations of Enel’s largest wind farm in the world marks a significant achievement for our company and reinforces our global commitment to accelerated renewable energy growth,” said Antonio Cammisecra, CEO of Enel Green Power, referencing the largest wind project constructed in North America as evidence of market momentum. “This milestone is matched with a new partnership with Danone North America to support their renewable goals, a reinforcement of our continued commitment to provide customers with tailored solutions to meet their sustainability goals.”

The agreement between Enel and Danone North America will provide enough electricity to produce the equivalent of almost 800 million cups of yogurt1 and over 80 million gallons2 of milk each year and support the food and beverage company’s commitment to securing 100% of its purchased electricity from renewable sources by 2030, in a market where North Carolina’s first wind farm is now fully operational and expanding access to clean power.

Mariano Lozano, president and CEO of Danone North America, added:“This is an exciting and significant step as we continue to advance our 2030 renewable electricity goals. As a public benefit corporation committed to balancing the needs of our business with those of society and the planet, we truly believe that this agreement makes sense from both a business and sustainability point of view. We’re delighted to be working with Enel Green Power to expand their High Lonesome wind farm and grow the renewable electricity infrastructure, such as New York’s biggest offshore wind projects, here in the US.”

In addition, as more US wind projects come online, such as TransAlta’s 119 MW project, the energy produced by a 295 MW portion of the project will be hedged under a Proxy Revenue Swap (PRS) with insurer Allianz Global Corporate & Specialty, Inc.'s Alternative Risk Transfer unit (Allianz), and Nephila Climate, a provider of weather and climate risk management products. The PRS is a financial derivative agreement designed to produce stable revenues for the project regardless of power price fluctuations and weather-driven intermittency, hedging the project from this kind of risk in addition to that associated with price and volume.

Under the PRS agreement, and as other projects begin operations, like Building Energy’s latest plant, High Lonesome will receive fixed payments based on the expected value of future energy production, with adjustments paid depending on how the realized proxy revenue of the project differs from the fixed payment. The PRS for High Lonesome, which is the largest by capacity for a single plant globally and the first agreement of its kind for Enel, was executed in collaboration with REsurety, Inc.

The investment in the construction of the 500 MW plant amounts to around 720 million US dollars. The wind farm is due to generate around 1.9 TWh annually, comparable to a 280 MW Alberta wind farm’s output, while avoiding the emission of more than 1.2 million tons of CO2 per year.


Related News

View more

Sign Up for Electricity Forum’s Newsletter

Stay informed with our FREE Newsletter — get the latest news, breakthrough technologies, and expert insights, delivered straight to your inbox.

Electricity Today T&D Magazine Subscribe for FREE

Stay informed with the latest T&D policies and technologies.
  • Timely insights from industry experts
  • Practical solutions T&D engineers
  • Free access to every issue

Live Online & In-person Group Training

Advantages To Instructor-Led Training – Instructor-Led Course, Customized Training, Multiple Locations, Economical, CEU Credits, Course Discounts.

Request For Quotation

Whether you would prefer Live Online or In-Person instruction, our electrical training courses can be tailored to meet your company's specific requirements and delivered to your employees in one location or at various locations.