CSA Z462 Arc Flash Training – Electrical Safety Compliance Course
Our customized live online or in‑person group training can be delivered to your staff at your location.

- Live Online
- 6 hours Instructor-led
- Group Training Available
Regular Price:
$249
Coupon Price:
$199
U.S. Geothermal Inc., a renewable energy company focused on the production of electricity from geothermal energy, announced a progress update on the company^^s Unit One geothermal power plant at Raft River, Idaho.
Construction activities associated with the Unit One plant were completed when the power plant contractor, Ormat Nevada, achieved substantial completion under the terms of the engineering, construction and procurement contract. The plant operated under a test phase of power production from October 18 to 23.
After a number of start-up mechanical issues were successfully addressed, the plant was restarted on November 22 and is continuing operations. Plant operations are dependent upon maintaining a sufficient pressure regime in the production wells. The operating staff continues to learn about each well's capabilities and the relationship of injection pressure to production.
The test phase is ongoing to allow for a fuller understanding of the geothermal resource capability. The net electrical power output of the plant is currently between 8 and 9 megawatts. With four production wells in operation, the maximum and minimum gross electrical output achieved by the plant to date was 14.4 and 9.5 megawatts respectively.
The maximum and minimum net electrical output achieved by the plant to date was 9.4 and 7.1 megawatts respectively. The output of the plant is being sold to Idaho Power Company and sales are limited to 10 megawatts average per month under the terms of the existing power purchase agreement. The plant is designed to produce an annual average net output of 13 megawatts.
Test power sold during this period is being purchased by Idaho Power Company under the terms of a 10-megawatt Public Utility Regulatory Policies Act ("PURPA") contract. Full energy prices will be paid when the plant achieves commercial operations. Delays caused by mechanical issues have extended the date when commercial operation will be achieved to within the next fifteen days.
Pending approval by the Idaho Public Utility Commission, a recently executed full-output contract is expected to take effect and replace the existing 10-megawatt PURPA contract.
Currently, four production wells and three injection wells are in service to the power plant. To achieve full output under the pending new contract, a number of technical issues are being addressed including installation of the fifth production well, evaluation of total injection well capacity and modeling of the resource pressure and temperature regime.
Related News
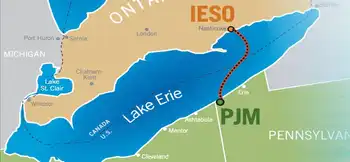
The CIB and private sector partners to invest $1.7 billion in Lake Erie Connector
Lake Erie Connector Investment advances a 1,000 MW HVDC transmission link connecting Ontario to the…
View more

Nova Scotia Premier calls on regulators to reject 14% electricity rate hike agreement
Nova Scotia Power Rate Increase Settlement faces UARB scrutiny as regulators weigh electricity rates, fuel…
View more
Is a Resurgence of Nuclear Energy Possible in Germany?
Germany Nuclear Phase-Out reflects a decisive energy policy shift, retiring reactors as firms shun new…
View more
Hydro One and Alectra announce major investments to strengthen electricity infrastructure and improve local reliability in the Hamilton area
Hydro One and Alectra Hamilton Grid Upgrades will modernize electricity infrastructure with new transformers, protection…
View more
Project examines potential for Europe's power grid to increase HVDC Technology
HVDC-WISE Project accelerates HVDC technology integration across the European transmission system, delivering a planning toolkit…
View more

Ukraine Resumes Electricity Exports
Ukraine Electricity Exports resume as the EU grid links stabilize; ENTSO-E caps, megawatt capacity, renewables,…
View more
Sign Up for Electricity Forum’s Newsletter
Stay informed with our FREE Newsletter — get the latest news, breakthrough technologies, and expert insights, delivered straight to your inbox.
Electricity Today T&D Magazine Subscribe for FREE

Stay informed with the latest T&D policies and technologies.
- Timely insights from industry experts
- Practical solutions T&D engineers
- Free access to every issue
