High Voltage Maintenance Training Online
Our customized live online or in‑person group training can be delivered to your staff at your location.

- Live Online
- 12 hours Instructor-led
- Group Training Available
Regular Price:
$599
Coupon Price:
$499
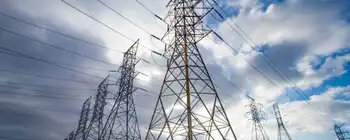
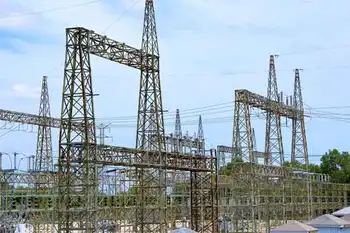
Hydro One GTA transmission upgrades support Ontario's clean energy future with grid modernization, infrastructure renewal, and asset analytics, improving electricity reliability across Toronto and the region through prudent investments and station refurbishments.
Main Details
Hydro One's GTA upgrades modernize grid assets, boosting reliability and capacity for Toronto and nearby areas.
- $157M completed in 2014 across Toronto and GTA
- $689M in 2015-2018 projects underway in the region
- Asset analytics guides end-of-life replacements
Recently, Hydro One announced it has completed more than $157 million in upgrades through ten transmission station projects across Toronto and the GTA in 2014 to improve reliability and replace aging infrastructure. In addition, the Company plans to complete over $688 million in additional improvement and replacement work between 2015-2018.
"As stewards of Ontario's transmission system, Hydro One is committed to prudently investing in its transmission system, such as a station refurbishment that strengthens capacity, to support our province's energy needs," said Sandy Struthers, COO & EVP Strategic Planning, Hydro One. "These investments will improve electricity reliability in Toronto and the GTA today and for the future."
"Ontario is committed to building a safe, clean and reliable energy system for all, including new power lines that expand the grid," said Bob Delaney, Parliamentary Assistant to the Minister of Energy. "Today's announcement will strengthen and modernize our shared energy infrastructure, ensuring efficient, affordable electricity supply for a growing population."
Through its innovative asset analytics tool, Hydro One is able to identify and monitor the condition of all of its critical assets and make more effective and prudent investment decisions. Replacing critical assets as they approach end of life is key in ensuring reliability, and Hamilton investments underscore this focus across the province.
Hydro One completed the following projects in 2014, and the Chesterville upgrade highlights work outside the GTA as well:
Main Transmission Station, Toronto - $9.1 million
Toronto Lakeshore Infrastructure Renewal - $53 million
Bridgman Transmission Station, Toronto - $12.3 million
Leaside Transmission Station, Toronto - $7.2 million
Basin Transmission Station, Toronto - $7 million
Claireville Transmission Station, Woodbridge - $5.5 million
Cooksville Transmission Station, Mississauga - $32.1 million
Manby Transmission Station, Toronto - $5.8 million
Gerrard Transmission Station, Toronto $10 million
Trafalgar Transmission Station, Oakville - $15 million
The following transmission projects are currently underway in the GTA and will be completed between 2015-2018, while the Ontario/Michigan interconnection investments advance cross-border reliability:
New Clarington Transmission Station, Clarington -$295 million
Leaside to Bridgman Transmission Expansion Midtown Tunnel, Toronto - $115 million
Richview Transmission Station, Toronto - $103 million
Connection of Toronto Hydro Copeland Tunnel, Toronto - $43 million
Manby Transmission Station, Toronto - $18 million
Bridgman Transmission Station, Toronto - $8.5 million
Trafalgar Transmission Station, Oakville - $4 million
Wiltshire Transmission Station, Toronto - $22 million
Gerrard Transmission Station, Toronto - $12 million
Leaside Transmission Station, Toronto - $37.5 million
Ellesmere Transmission Station, Toronto - $8.3 million
Scarboro Transmission Station, Toronto - $12.1 million
Carlaw Transmission Station, Toronto - $5.3 million
Strachan Transmission Station, Toronto - $5.2 million
Related News
Related News
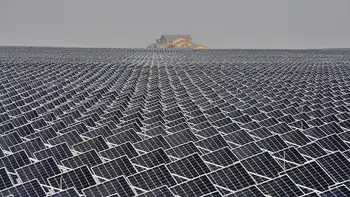
China boosts wind energy, photovoltaic and concentrated solar power
China Renewable Energy Law drives growth in wind power, solar thermal, and photovoltaic capacity, supporting…
View more
Court reinstates constitutional challenge to Ontario's hefty ‘global adjustment’ electricity charge
Ontario Global Adjustment Charge faces constitutional scrutiny as a regulatory charge vs tax; Court of…
View more
Putting Africa on the path to universal electricity access
West and Central Africa Electricity Access hinges on utility reform, renewable energy, off-grid solar, mini-grids,…
View more

Dubai Planning Large-Scale Solar Powered Hydrogen Production
Dubai Green Hydrogen advances electrolysis at the Mohammed Bin Rashid Al Maktoum Solar Park, with…
View more
Which of the cleaner states imports dirty electricity?
Hourly Electricity Emissions Tracking maps grid balancing areas, embodied emissions, and imports/exports, revealing carbon intensity…
View more
Alberta Introduces New Electricity Rules
Alberta Rate of Last Resort streamlines electricity regulations to stabilize the default rate, curb price…
View more
Sign Up for Electricity Forum’s Newsletter
Stay informed with our FREE Newsletter — get the latest news, breakthrough technologies, and expert insights, delivered straight to your inbox.
Electricity Today T&D Magazine Subscribe for FREE

Stay informed with the latest T&D policies and technologies.
- Timely insights from industry experts
- Practical solutions T&D engineers
- Free access to every issue

