Protective Relay Training - Basic
Our customized live online or in‑person group training can be delivered to your staff at your location.

- Live Online
- 12 hours Instructor-led
- Group Training Available
Regular Price:
$699
Coupon Price:
$599
The Marines are erecting the first large-scale wind turbine at its logistics base in Barstow, said the San Diego-based Navy unit that oversees design and construction of public works projects.
The purchase of the wind turbine from a Swedish manufacturer will allow Marine Corps Logistics Base Barstow to generate an average of 3,000 megawatt hours of power each year for the base, complementing existing electric power, and translates to saving about $500,000 a year, said Monica Hernandez, contract specialist for Naval Facilities Engineering Command Southwest, the NavyÂ’s construction and real estate manager based in San Diego.
The Navy sought a wind generation system for the base starting in January 2006, but couldnÂ’t find a U.S. company to provide a system that met its specs, leading to the $4.5 million contract with the Swedish firm. The contract required a special waiver before it was signed in November, according to the command.
The Navy has installed solar panels at some of its bases, including Coronado and Point Loma, but this wind turbine is the first of its kind, said Navy spokesman Lee Saunders.
Rosemead-based Southern California Edison is providing design and construction services to the project, which is scheduled to be completed in November.
Related News
Nova Scotia Power says it now generates 30 per cent of its power from renewables
Nova Scotia Power Renewable Energy delivers 30% in 2018, led by wind power, hydroelectric and…
View more

Sudbury Hydro crews aim to reconnect service after storm
Sudbury Microburst Power Outage strains hydro crews after straight-line winds; New Sudbury faces downed power…
View more

B.C. Hydro adds more vehicle charging stations across southern B.C.
BC Hydro EV Charging Stations expand provincewide with DC fast chargers, 80% in 30 minutes…
View more
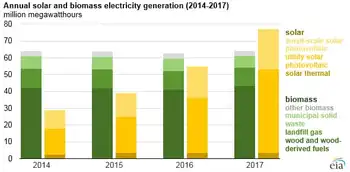
Solar Becomes #3 Renewable Electricity Source In USA
U.S. Solar Generation 2017 surpassed biomass, delivering 77 million MWh versus 64 million MWh, trailing…
View more
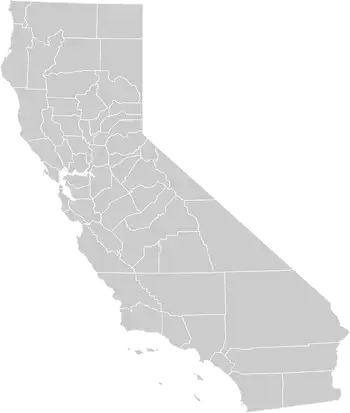
California electricity pricing changes pose an existential threat to residential rooftop solar
California Rooftop Solar Rate Reforms propose shifting net metering to fixed access fees, peak-demand charges,…
View more

US power coalition demands action to deal with Coronavirus
Renewable Energy Tax Incentive Extensions urged by US trade groups to offset COVID-19 supply chain…
View more
Sign Up for Electricity Forum’s Newsletter
Stay informed with our FREE Newsletter — get the latest news, breakthrough technologies, and expert insights, delivered straight to your inbox.
Electricity Today T&D Magazine Subscribe for FREE

Stay informed with the latest T&D policies and technologies.
- Timely insights from industry experts
- Practical solutions T&D engineers
- Free access to every issue

