Solar, wind projects vie for stimulus funds

By Associated Press


Protective Relay Training - Basic

Our customized live online or in‑person group training can be delivered to your staff at your location.

  • Live Online
  • 12 hours Instructor-led
  • Group Training Available
Regular Price:
$699
Coupon Price:
$599
Reserve Your Seat Today
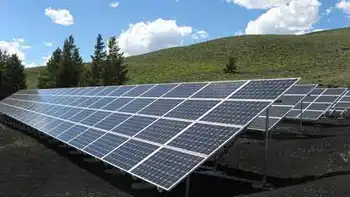
When Steve Williams went looking for projects to add to his federal stimulus wish list, the Belchertown public works director decided to toss in two ideas that had been kicking around his desk — solar panels for the town's wastewater treatment facility and highway garage.

"We looked at a few sites with high power demand and good exposure to the sun," Williams said of the projects, with a combined price tag of nearly $1.2 million. "We are trying to get the word out that Belchertown is serious about going green."

Williams isn't alone.

Wish lists submitted by cities, towns and state agencies for a share of Massachusetts's federal stimulus funds include hundreds of renewable energy projects, from a multi-community push to place solar panels on the roofs of public buildings across Cape Cod to a major wind farm in the Berkshires.

Interspersed are dozens of smaller projects, from micro wind turbines to solar panels on schools to a "biomass boiler" at the University of Massachusetts-Dartmouth that relies on biomass like wood chips instead of oil or gas.

There's even a proposal to put solar panels on portions of the Statehouse.

Under the $787 billion federal stimulus plan signed by President Obama, Massachusetts is expected to receive $1-2 billion for infrastructure projects. That means only a tiny fraction of wish list projects will see any money.

Still, Gov. Deval Patrick is hoping the funds will help jumpstart his goal of dramatically increasing Massachusetts' production of renewable energy.

For solar energy, that goal is the ability to generate 250 megawatts of energy from solar panels by the year 2017. There are now about 7 megawatts of solar panels installed across Massachusetts.

The goal for wind power is even more dramatic.

The state has just nine major wind turbines pumping out about 7 megawatts of power. By 2020, Patrick wants the state to be producing 2,000 megawatts of wind energy. While the goal is ambitious, it may be attainable. The proposal by Cape Wind Associates to build 130 windmills across 25 miles of federal waters in Nantucket Sound, for instance, would generate up to 420 megawatts of power.

State Environmental Affairs Secretary Ian Bowles said the stimulus dollars will help push the state closer to its goals.

"We see the stimulus as providing a very important impetus to maintain and expand the momentum we have built for renewable energy over the last two years," Bowles said.

The Cape Light Compact is one of those groups hoping to turn stimulus dollars into renewable energy.

The group ultimately wants to generate 14 megawatts of energy by installing solar panels on public buildings up and down the Cape, from fire stations and town halls to schools and DPW buildings.

The group has requested $10 million in stimulus funds — enough to install 3 megawatts worth of solar panels on more than a dozen sites according to Maggie Downey, the group's administrator. That would produce enough electricity to cover about 20 percent of the entire municipal load on the Cape, she said.

Downey said the project has an added economic benefit for the state. Not only will it boost production of clean energy, but the panels will be purchased from a local company — Evergreen Solar based in Devens.

"Not only are we hiring local people to install these, but for Massachusetts we get a double-bang because we help the local manufacturers too," she said.

The Berkshire Wind Power Cooperative Corp. has an even more ambitious project — the creation of a 10-turbine wind power farm on Brodie Mountain in Hancock, Mass.

The group, formed by 14 municipal power companies and the Massachusetts Municipal Wholesale Electric Company, is on the verge of signing the contract to purchase the turbines and will resume construction on the foundations for the turbines in the spring. It's hoping for $47 million in stimulus funds. When completed, the project is expected to produce 15 megawatts of power.

"It's the kind of initiative that's needed to advance the development of renewable energy projects in Massachusetts," said David Tuohey, spokesman for Massachusetts Municipal Wholesale Electric Company. "We are definitely shovel-ready."

Being "shovel-ready" — defined as able to begin construction within 180-days — is critical. The stimulus money is intended for projects that can quickly help boost the economy.

Related News

Ontario Businesses To See Full Impact of 2021 Electricity Rate Reductions

Ontario Comprehensive Electricity Plan delivers Global Adjustment reductions for industrial and commercial non-RPP customers, lowering electricity rates, shifting renewable energy costs, and enhancing competitiveness across Ontario businesses in 2022, with additional 4 percent savings.


Key Points

Ontario's plan lowers Global Adjustment by shifting renewable costs, cutting industrial and commercial bills 15-17%.

✅ Shifts above-market non-hydro renewable costs to the Province

✅ Reduces GA for industrial and commercial non-RPP customers

✅ Additional 4% savings on 2022 bills after GA deferral


As of January 1, 2022, industrial and commercial electricity customers will benefit from the full savings introduced through the Ontario government’s Comprehensive Electricity Plan, which supports stable electricity pricing for industrial and commercial companies, announced in Budget 2020, and first implemented in January 2021. This year customers could see an additional four percent savings compared to their bills last year, bringing the full savings from the Comprehensive Electricity Plan to between 15 and 17 per cent, making Ontario a more competitive place to do business.

“Our Comprehensive Electricity Plan has helped reverse the trend of skyrocketing electricity prices that drove jobs out of Ontario,” said Todd Smith, Minister of Energy. “Over 50,000 customers are benefiting from our government’s plan which has reduced electricity rates on clean and reliable power, allowing them to focus on reinvesting in their operations and creating jobs here at home.”

Starting on January 1, 2021, the Comprehensive Electricity Plan reduced overall Global Adjustment (GA) costs for industrial and commercial customers who do not participate in the Regulated Price Plan (RPP) by shifting the forecast above-market costs of non-hydro renewable energy, such as wind, solar and bioenergy, from the rate base to the Province, alongside energy-efficiency programs that complement demand reduction efforts.

“Since taking office, our government has listened to job creators and worked to lower the costs of doing business in the province. Through these significant reductions in electricity prices through the Comprehensive Electricity Plan, customers all across Ontario will benefit from significant savings in their business operations in 2022,” said Vic Fedeli, Minister of Economic Development, Job Creation and Trade. “By continuing to reduce electricity costs, lowering taxes, and cutting red tape our government has reduced the cost of doing business in Ontario by nearly $7 billion annually to ensure that we remain competitive, innovative and poised for economic recovery.”

As part of its COVID response, including electricity relief for families and small businesses, Ontario had deferred a portion of GA between April and June 2020 for industrial and non-RPP commercial customers, with more than 50,000 customers benefiting. Those same businesses paid back these deferred GA costs over 12 months, between January 2021 and December 2021, while the province prepared to extend disconnect moratoriums for residential customers.

During the pandemic, residential electricity use rose even as overall consumption dropped, underscoring shifts in load patterns.

Now that the GA deferral repayment period is over, industrial and non-RPP commercial customers will benefit from the full cost reductions provided to them by the Comprehensive Electricity Plan, alongside temporary off-peak rate relief that supported families and small businesses. This means that, beginning January 1, 2022, these businesses could see an additional four per cent savings on their bills compared to 2021, as new ultra-low overnight pricing options emerge depending on their location and consumption.


Related News

View more

Renewable energy now cheapest option for new electricity in most of the world: Report

Renewable Energy Cost Trends highlight IRENA data showing solar and wind undercut coal, as utility-scale projects drive lower levelized electricity costs worldwide, with the Middle East and UAE advancing mega solar parks.


Key Points

They track how solar and wind undercut new fossil fuels as utility-scale costs drop and investment accelerates.

✅ IRENA reports renewables cheapest for new installations

✅ Solar and wind LCOE fell sharply since 2010

✅ Middle East and UAE scale mega utility projects


Renewable energy is now the cheapest option for new electricity installation in most of the world, a report from the International Renewable Energy Agency (IRENA) on Tuesday said.

Renewable power projects have undercut traditional coal fuel plants, with solar and wind power costs in particular falling as record-breaking growth continues worldwide.

“Installing new renewables increasingly costs less than the cheapest fossil fuels. With or without the health and economic crisis, dirty coal plants were overdue to be consigned to the past, said Francesco La Camera, director-general of IRENA said in the report.

In 2019, renewables accounted for around 72 percent of all new capacity added worldwide, IRENA said, following a 2016 record year that highlighted the momentum, with lowering costs and technological improvements in solar and wind power helping this dynamic. For solar energy, IRENA notes that the cost for electricity from utility-scale plants fell by 82 percent in the decade between 2010 and 2019, as China's solar PV growth underscored in 2016.

“More than half of the renewable capacity added in 2019 achieved lower electricity costs than new coal, while new solar and wind projects are also undercutting the cheapest and least sustainable of existing coal-fired plants,” Camera added.

Costs for solar and wind power also fell year-on-year by 13 and 9 percent, respectively, with offshore wind costs showing steep declines as well. In 2019, more than half of all newly commissioned utility-scale renewable power plants provided electricity cheaper than the lowest cost of a new fossil fuel plant.

The Middle East

In mid-May, a report by UK-based law firm Ashurst suggested the Middle East is the second most popular region for renewable energy investment after North America, at a time when clean energy investment is outpacing fossil fuels.

The region is home to some of the largest renewable energy bets in the world, with Saudi wind expansion gathering pace. The UAE, for instance, is currently developing the Mohammed Bin Rashid Solar Park, the world’s largest concentrated solar power project in the world.

Around 26 percent of Middle East respondents in Ashurst’s survey said that they were presently investing in energy transition, marking the region as the most popular for current investment in renewables, while 11 percent added that they were considering investing.

In North America, the most popular region, 28 percent said that they were currently investing, with 11 percent stating they are considering investing.


Related News

View more

Which of the cleaner states imports dirty electricity?

Hourly Electricity Emissions Tracking maps grid balancing areas, embodied emissions, and imports/exports, revealing carbon intensity shifts across PJM, ERCOT, and California ISO, and clarifying renewable energy versus coal impacts on health and climate.


Key Points

An hourly method tracing generation, flows, and embodied emissions to quantify carbon intensity across US balancing areas.

✅ Hourly traces of imports/exports and generation mix

✅ Consumption-based carbon intensity by balancing area

✅ Policy insights for renewables, coal, health costs


In the United States, electricity generation accounts for nearly 30% of our carbon emissions. Some states have responded to that by setting aggressive renewable energy standards; others are hoping to see coal propped up even as its economics get worse. Complicating matters further is the fact that many regional grids are integrated, and as America goes electric the stakes grow, meaning power generated in one location may be exported and used in a different state entirely.

Tracking these electricity exports is critical for understanding how to lower our national carbon emissions. In addition, power from a dirty source like coal has health and environment impacts where it's produced, and the costs of these aren't always paid by the parties using the electricity. Unfortunately, getting reliable figures on how electricity is produced and where it's used is challenging, even for consumers trying to find where their electricity comes from in the first place, leaving some of the best estimates with a time resolution of only a month.

Now, three Stanford researchers—Jacques A. de Chalendar, John Taggart, and Sally M. Benson—have greatly improved on that standard, and they have managed to track power generation and use on an hourly basis. The researchers found that, of the 66 grid balancing areas within the United States, only three have carbon emissions equivalent to our national average, and they have found that imports and exports of electricity have both seasonal and daily changes. de Chalendar et al. discovered that the net results can be substantial, with imported electricity increasing California's emissions/power by 20%.

Hour by hour
To figure out the US energy trading landscape, the researchers obtained 2016 data for grid features called balancing areas. The continental US has 66 of these, providing much better spatial resolution on the data than the larger grid subdivisions. This doesn't cover everything—several balancing areas in Canada and Mexico are tied in to the US grid—and some of these balancing areas are much larger than others. The PJM grid, serving Pennsylvania, New Jersey, and Maryland, for example, is more than twice as large as Texas' ERCOT, in a state that produces and consumes the most electricity in the US.

Despite these limitations, it's possible to get hourly figures on how much electricity was generated, what was used to produce it, and whether it was used locally or exported to another balancing area. Information on the generating sources allowed the researchers to attach an emissions figure to each unit of electricity produced. Coal, for example, produces double the emissions of natural gas, which in turn produces more than an order of magnitude more carbon dioxide than the manufacturing of solar, wind, or hydro facilities. These figures were turned into what the authors call "embodied emissions" that can be traced to where they're eventually used.

Similar figures were also generated for sulfur dioxide and nitrogen oxides. Released by the burning of fossil fuels, these can both influence the global climate and produce local health problems.

Huge variation
The results were striking. "The consumption-based carbon intensity of electricity varies by almost an order of magnitude across the different regions in the US electricity system," the authors conclude. The low is the Bonneville Power grid region, which is largely supplied by hydropower; it has typical emissions below 100kg of carbon dioxide per megawatt-hour. The highest emissions come in the Ohio Valley Electric region, where emissions clear 900kg/MW-hr. Only three regional grids match the overall grid emissions intensity, although that includes the very large PJM (where capacity auction payouts recently fell), ERCOT, and Southern Co balancing areas.

Most of the low-emissions power that's exported comes from the Pacific Northwest's abundant hydropower, while the Rocky Mountains area exports electricity with the highest associated emissions. That leads to some striking asymmetries. Local generation in the hydro-rich Idaho Power Company has embodied emissions of only 71kg/MW-hr, while its imports, coming primarily from Rocky Mountain states, have a carbon content of 625kg/MW-hr.

The reliance on hydropower also makes the asymmetry seasonal. Local generation is highest in the spring as snow melts, but imports become a larger source outside this time of year. As solar and wind can also have pronounced seasonal shifts, similar changes will likely be seen as these become larger contributors to many of these regional grids. Similar things occur daily, as both demand and solar production (and, to a lesser extent, wind) have distinct daily profiles.

The Golden State
California's CISO provides another instructive case. Imports represent less than 30% of its total electric use in 2016, yet California electricity imports provided 40% of its embodied emissions. Some of these, however, come internally from California, provided by the Los Angeles Department of Water and Power. The state itself, however, has only had limited tracking of imported emissions, lumping many of its sources as "other," and has been exporting its energy policies to Western states in ways that shape regional markets.

Overall, the 2016 inventory provides a narrow picture of the US grid, as plenty of trends are rapidly changing our country's emissions profile, including the rise of renewables and the widespread adoption of efficiency measures and other utility trends in 2017 that continue to evolve. The method developed here can, however, allow for annual updates, providing us with a much better picture of trends. That could be quite valuable to track things like how the rapid rise in solar power is altering the daily production of clean power.

More significantly, it provides a basis for more informed policymaking. States that wish to promote low-emissions power can use the information here to either alter the source of their imports or to encourage the sites where they're produced to adopt more renewable power. And those states that are exporting electricity produced primarily through fossil fuels could ensure that the locations where the power is used pay a price that includes the health costs of its production.


Related News

View more

Cleaning up Canada's electricity is critical to meeting climate pledges

Canada Clean Electricity Standard targets a net-zero grid by 2035, using carbon pricing, CO2 caps, and carbon capture while expanding renewables and interprovincial trade to decarbonize power in Alberta, Saskatchewan, and Ontario.


Key Points

A federal plan to reach a net-zero grid by 2035 using CO2 caps, carbon pricing, carbon capture, renewables, and trade.

✅ CO2 caps and rising carbon prices through 2050

✅ Carbon capture required on gas plants in high-emitting provinces

✅ Renewables build-out and interprovincial trade to balance supply


A new tool has been proposed in the federal election campaign as a way of eradicating the carbon emissions from Canada’s patchwork electricity system. 

As the country’s need for power grows through the decarbonization of transportation, industry and space heating, the Liberal Party climate plan is proposing a clean energy standard to help Canada achieve a 100% net-zero-electricity system by 2035, aligning with Canada’s net-zero by 2050 target overall. 

The proposal echoes a report released August 19 by the David Suzuki Foundation and a group of environmental NGOs that also calls for a clean electricity standard, capping power-sector emissions, and tighter carbon-pricing regulations. The report, written by Simon Fraser University climate economist Mark Jaccard and data analyst Brad Griffin, asserts that these policies would effectively decarbonize Canada’s electricity system by 2035.

“Fuel switching from dirty fossil fuels to clean electricity is an essential part of any serious pathway to transition to a net-zero energy system by 2050,” writes Tom Green, climate policy advisor to the Suzuki Foundation, in a foreword to the report. The pathway to a net-zero grid is even more important as Canada switches from fossil fuels to electric vehicles, space heating and industrial processes, even as the Canadian Gas Association warns of high transition costs.

Under Jaccard and Griffin’s proposal, a clean electricity standard would be established to regulate CO2 emissions specifically from power plants across Canada. In addition, the plan includes an increase in the carbon price imposed on electricity system releases, combined with tighter regulation to ensure that 100% of the carbon price set by the federal government is charged to electricity producers. The authors propose that the current scheduled carbon price of $170 per tonne of CO2 in 2030 should rise to at least $300 per tonne by 2050.

In Alberta, Saskatchewan, Ontario, New Brunswick and Nova Scotia, the 2030 standard would mean that all fossil-fuel-powered electricity plants would require carbon capture in order to comply with the standard. The provinces would be given until 2035 to drop to zero grams CO2 per kilowatt hour, matching the 2030 standard for low-carbon provinces (Quebec, British Columbia, Manitoba, Newfoundland and Labrador and Prince Edward Island). 

Alberta and Saskatchewan targeted 
Canada has a relatively clean electricity system, as shown by nationwide progress in electricity, with about 80% of the country’s power generated from low- or zero-emission sources. So the biggest impacts of the proposal will be felt in the higher-carbon provinces of Alberta and Saskatchewan. Alberta has a plan to switch from coal-based electric power to natural gas generation by 2023. But Saskatchewan is still working on its plan. Under the Jaccard-Griffin proposal, these provinces would need to install carbon capture on their gas-fired plants by 2030 and carbon-negative technology (biomass with carbon capture, for instance) by 2035. Saskatchewan has been operating carbon capture and storage technology at its Boundary Dam power station since 2014, but large-scale rollout at power plants has not yet been achieved in Canada. 

With its heavy reliance on nuclear and hydro generation, Ontario’s electricity supply is already low carbon. Natural gas now accounts for about 7% of the province’s grid, but the clean electricity standard could pose a big challenge for the province as it ramps up natural-gas-generated power to replace electricity from its aging Pickering station, scheduled to go out of service in 2025, even as a fully renewable grid by 2030 remains a debated goal. Pickering currently supplies about 14% of Ontario’s power. 

Ontario doesn’t have large geological basins for underground CO2 storage, as Alberta and Saskatchewan do, so the report says Ontario will have to build up its solar and wind generation significantly as part of Canada’s renewable energy race, or find a solution to capture CO2 from its gas plants. The Ontario Clean Air Alliance has kicked off a campaign to encourage the Ontario government to phase out gas-fired generation by purchasing power from Quebec or installing new solar or wind power.

As the report points out, the federal government has Supreme Court–sanctioned authority to impose carbon regulations, such as a clean electricity standard, and carbon pricing on the provinces, with significant policy implications for electricity grids nationwide.

The federal government can also mandate a national approach to CO2 reduction regardless of fuel source, encouraging higher-carbon provinces to work with their lower-carbon neighbours. The Atlantic provinces would be encouraged to buy power from hydro-heavy Newfoundland, for example, while Ontario would be encouraged to buy power from Quebec, Saskatchewan from Manitoba, and Alberta from British Columbia.

The Canadian Electricity Association, the umbrella organization for Canada’s power sector, did not respond to a request for comment on the Jaccard-Griffin report or the Liberal net-zero grid proposal.

Just how much more clean power will Canada need? 
The proposal has also kicked off a debate, and an IEA report underscores rising demand, about exactly how much additional electricity Canada will need in coming decades.

In his 2015 report, Pathways to Deep Decarbonization in Canada, energy and climate analyst Chris Bataille estimated that to achieve Canada’s climate net-zero target by 2050 the country will need to double its electricity use by that year.

Jaccard and Griffin agree with this estimate, saying that Canada will need more than 1,200 terawatt hours of electricity per year in 2050, up from about 640 terawatt hours currently.

But energy and climate consultant Ralph Torrie (also director of research at Corporate Knights) disputes this analysis.

He says large-scale programs to make the economy more energy efficient could substantially reduce electricity demand. A major program to install heat pumps and replace inefficient electric heating in homes and businesses could save 50 terawatt hours of consumption on its own, according to a recent report from Torrie and colleague Brendan Haley. 

Put in context, 50 terawatt hours would require generation from 7,500 large wind turbines. Applied to electric vehicle charging, 50 terawatt hours could power 10 million electric vehicles.

While Torrie doesn’t dispute the need to bring the power system to net-zero, he also doesn’t believe the “arm-waving argument that the demand for electricity is necessarily going to double because of the electrification associated with decarbonization.” 


Related News

View more

Solar changing shape of electricity prices in Northern Europe

EU Solar Impact on Electricity Prices highlights how rising solar PV penetration drives negative pricing, shifts peak hours, pressures wholesale markets, and challenges grid balancing, interconnection, and flexibility amid changing demand and renewables growth.


Key Points

Explains how rising solar PV cuts wholesale prices, shifts negative-price hours, and strains grid flexibility.

✅ Negative pricing events surge with higher solar penetration.

✅ Afternoon price dips replace night-time wind-led lows.

✅ Grid balancing, interconnectors, and flexibility become critical.


The latest EU electricity market report has confirmed the affect deeper penetration of solar is having on wholesale electricity prices more broadly.

The Quarterly Report on European Electricity Markets for the final three months of last year noted the number of periods of negative electricity pricing doubled from 2019, to almost 1,600 such events, as global renewables set new records in deployment across markets.

Having experienced just three negative price events in 2019, the Netherlands recorded almost 100 last year “amid a dramatic increase in solar PV capacity,” in the nation, according to the report.

Whilst stressing the exceptional nature of the Covid-19 pandemic on power consumption patterns, the quarterly update also noted a shift in the hours during which negative electric pricing occurred in renewables poster child Germany. Previously such events were most common at night, during periods of high wind speed and low demand, but 2020 saw a switch to afternoon negative pricing. “Thus,” stated the report, “solar PV became the main driver behind prices falling into negative territory in the German market in 2020, as Germany's solar boost accelerated, and also put afternoon prices under pressure generally.”

The report also highlighted two instances of scarce electricity–in mid September and on December 9–as evidence of the problems associated with accommodating a rising proportion of intermittent clean energy capacity into the grid, and called for more joined-up cross-border power networks, amid pushback from Russian oil and gas across the continent.

Rising solar generation–along with higher gas output, year on year–also helped the Netherlands generate a net surplus of electricity last year, after being a net importer “for many years.” The EU report also noted a beneficial effect of rising solar generation capacity on Hungary‘s national electricity account, and cited a solar “boom” in that country and Poland, mirroring rapid solar PV growth in China in recent years.

With Covid-19 falls in demand helping renewables generate more of Europe's electricity (39%) than fossil fuels (36%) for the first time, as renewables surpassed fossil fuels across Europe, the market report observed the 5% of the bloc's power produced from solar closed in on the 6% accounted for by hard coal. In the final three months of the year, European solar output rose 12%, year on year, to 18 TWh and “the increase was almost single-handedly driven by Spain,” the study added.

With coal and lignite-fired power plunging 22% last year across the bloc, it is estimated the European power sector reduced its carbon footprint 14% as part of Europe's green surge although the quarterly report warned cold weather, lower wind speeds and rising gas prices in the opening months of this year are likely to see carbon emissions rebound.

There was good news on the transport front, though, with the report stating the scale of the European “electrically-charged vehicle” fleet doubled in 2020, to 2 million, with almost half a million of the new registrations arriving in the final months of the year. That meant cars with plug sockets accounted for a remarkable 17% of new purchases in Q4, twice the proportion seen in China and a slice of the pie six times bigger than such products claimed in the U.S.


Related News

View more

N.S. abandons Atlantic Loop, will increase wind and solar energy projects

Nova Scotia Clean Power Plan 2030 pivots from the Atlantic Loop, scaling wind and solar, leveraging Muskrat Falls via the Maritime Link, adding battery storage and transmission upgrades to decarbonize grid and retire coal.


Key Points

Nova Scotia's 2030 roadmap to replace coal with wind, solar, hydro imports, storage, and grid upgrades.

✅ 1,000 MW onshore wind to supply 50% by 2030

✅ Battery storage sites and New Brunswick transmission upgrades

✅ Continued Muskrat Falls imports via Maritime Link


Nova Scotia is abandoning the proposed Atlantic Loop in its plan to decarbonize its electrical grid by 2030 amid broader discussions about independent grid planning nationwide, Natural Resources and Renewables Minister Tory Rushton has announced.

The province unveiled its clean power plan calling for 30 per cent more wind power and five per cent more solar energy in the Nova Scotia power grid over the coming years. Nova Scotia's plan relies on continued imports of hydroelectricity from the Muskrat Falls project in Labrador via the Emera-owned Maritime Link.

Right now Nova Scotia generates 60 per cent of its electricity by burning fossil fuels, mostly coal, and some increased use of biomass has also factored into the mix. Nova Scotia Power must close its coal plants by 2030 when 80 per cent of electricity must come from renewable sources in order reduce greenhouse gas emissions causing climate changes.

Critics have urged reducing biomass use in electricity generation across the province.

The clean power plan calls for an additional 1,000 megawatts of onshore wind by 2030 which would then generate 50 per cent of the the province's electricity, while also advancing tidal energy in the Bay of Fundy as a complementary source.    

"We're taking the things already know and can capitalize on while we build them here in Nova Scotia," said Rushton, "More importantly, we're doing it at a lower rate so the ratepayers of Nova Scotia aren't going to bear the brunt of a piece of equipment that's designed and built and staying in Quebec."

The province says it can meet its green energy targets without importing Quebec hydro through the Atlantic loop. It would have brought hydroelectric power from Quebec into New Brunswick and Nova Scotia via upgraded transmission links. But the government said the cost is prohibitive, jumping to $9 billion from nearly $3 billion three years ago with no guarantee of a secure supply of power from Quebec.

"The loop is not viable for 2030. It is not necessary to achieve our goal," said David Miller, the provincial clean energy director. 

Miller said the cost of $250 to $300 per megawatt hour was five times higher than domestic wind supply.

Some of the provincial plan includes three new battery storage sites and expanding the transmission link with New Brunswick. Both were Nova Scotia Power projects paused by the company after the Houston government imposed a cap on the utility's rate increased in the fall of 2022.

The province said building the 345-kilovolt transmission line between Truro, N.S., and Salisbury, N.B., and an extension to the Point Lepreau Nuclear Generating Station, as well as aligning with NB Power deals for Quebec electricity underway, would enable greater access to energy markets.

Miller says Nova Scotia Power has revived both.

Nova Scotia Power did not comment on the new plan, but Rushton spoke for the company.

"All indications I've had is Nova Scotia Power is on board for what is taking place here today," he said.


Related News

View more

Sign Up for Electricity Forum’s Newsletter

Stay informed with our FREE Newsletter — get the latest news, breakthrough technologies, and expert insights, delivered straight to your inbox.

Electricity Today T&D Magazine Subscribe for FREE

Stay informed with the latest T&D policies and technologies.
  • Timely insights from industry experts
  • Practical solutions T&D engineers
  • Free access to every issue

Download the 2025 Electrical Training Catalog

Explore 50+ live, expert-led electrical training courses –

  • Interactive
  • Flexible
  • CEU-cerified