Electrical Commissioning In Industrial Power Systems
Our customized live online or in‑person group training can be delivered to your staff at your location.

- Live Online
- 12 hours Instructor-led
- Group Training Available
Regular Price:
$599
Coupon Price:
$499
Erika Weliczko of REpower Solutions got into the solar power business a year ago "because there was nobody else doing this in Cleveland."
She still has little competition, and with natural gas prices going up, it would seem a perfect situation for her business. Yet she is seeing little increase.
She blames Northeast Ohio's cloudy climate and the price of solar panels.
"I've done a handful of installations around Northeast Ohio. I'm in this for the long run," Weliczko said.
"Last year I had $120,000 in sales.... That's like baby steps."
Photovoltaic solar panels can turn sunlight into electricity and are far more popular in sunny climes like Arizona. The other major way of capturing energy from the sun is a panel that heats water.
"Solar water heating is not going to do 100 percent of your hot- water needs... but it probably will do 70 percent of your hot-water needs," said Richard King, team leader for photovoltaic research and development for the U.S. Department of Energy.
The rest of the job would be done by a conventional natural gas or electric heater, he said.
A single panel costs about $480 and produces about 120 watts or around 14.5 kilowatt-hours per month, Weliczko said. A typical home uses between 10 and 20 of those panels. So, for 20 panels, you would pay about $9,600 and get about $30 of electricity a month, she said. The system would pay you back in about 320 months, or more than 26 years. The panels can last 30 years.
A solar water-heating system costs about $2,000 and saves about $30 a month on electricity, King said. "Our calculations show about a seven-year payback on a hot-water system," he said.
Some systems use batteries to store energy for night use, but a procedure called "net metering" is more popular, King said. Excess electricity is sold back to the utility company, essentially making your meter run backwards.
FirstEnergy Corp. has about 175 net metering customers, said company spokeswoman Ellen Raines. Customers are paid back at the full retail rate (around 11.5 cents per kilowatt-hour) until their bill is paid off. After that, if the solar panel is still producing excess electricity, the consumer is paid the "generation rate," or a bit more than 4 cents per kilowatt-hour.
"Right now people who buy photovoltaics are high-salary people who want to be green, who want to conserve and are able to pay for it," King said.
Related News

EPA Policy to limit telework emerges during pandemic
EPA Telework Policy restricts remote work, balancing work-from-home guidance during the COVID-19 pandemic with flexible…
View more

BMW boss says hydrogen, not electric, will be "hippest thing" to drive
BMW Hydrogen Fuel Cell Strategy positions iX5 and eDrive for zero-emission mobility, leveraging fuel cells,…
View more

BC Hydro to begin reporting COVID-19 updates at Site C
BC Hydro COVID-19 Site C updates detail monitoring, self-isolation at the work camp, Northern Health…
View more

More people are climbing dangerous hydro dams and towers in search of 'social media glory,' utility says
BC Hydro Trespassing Surge highlights risky social media stunts at dams and power stations, with…
View more

Japan's power demand hit by coronavirus outbreak: industry head
Japan Power Demand Slowdown highlights reduced electricity consumption as industrial activity stalls amid the coronavirus…
View more
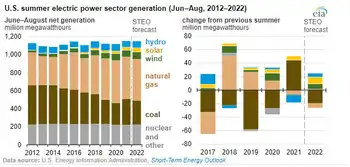
EIA expects solar and wind to be larger sources of U.S. electricity generation this summer
US Summer Electricity Outlook 2022 projects rising renewable energy generation as utility-scale solar and wind…
View more
Sign Up for Electricity Forum’s Newsletter
Stay informed with our FREE Newsletter — get the latest news, breakthrough technologies, and expert insights, delivered straight to your inbox.
Electricity Today T&D Magazine Subscribe for FREE

Stay informed with the latest T&D policies and technologies.
- Timely insights from industry experts
- Practical solutions T&D engineers
- Free access to every issue
