CSA Z462 Arc Flash Training – Electrical Safety Compliance Course
Our customized live online or in‑person group training can be delivered to your staff at your location.

- Live Online
- 6 hours Instructor-led
- Group Training Available
Regular Price:
$249
Coupon Price:
$199
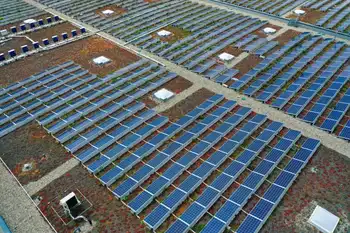
U.S. spice maker McCormick & Co has signed an agreement with Constellation Energy's Projects & Services Group to construct a solar power system at the company's Hunt Valley, Maryland distribution centre.
Constellation Energy, a subsidiary of Constellation Energy's Projects & Services Group, will construct the one-megawatt system at McCormick's spice mill and distribution warehouse, the company's largest milling and grinding facility.
McCormick will purchase the electricity generated from the system under a 20-year power purchase agreement. It is estimated that the project will reduce greenhouse gas emissions by around 1,000 metric tons annually and reduce the company's electricity costs for this facility by around 30% in the first year.
"This solar power system is another tangible sign of our commitment to sustainability," said Alan Wilson, McCormick's president & CEO. "The project will allow us to both reduce our energy costs while providing renewable energy to Maryland electricity customers. It is a win-win for the environment and our company. More than ever, businesses must be mindful of community impact."
The installation will feature around 80,000 sq ft of thin-film solar material, which is expected to generate 500 kilowatts of electricity. An additional 500 kilowatts of electricity is expected to be generated by approximately 2,800 solar world 175 watt crystalline solar panels.
Related News

LOC Renewables Delivers First MWS Services To China's Offshore Wind Market
Pinghai Bay Offshore Wind Farm MWS advances marine warranty survey best practices, risk management, and…
View more
Washington County planning officials develop proposed recommendations for solar farms
Washington County solar farm incentives aim to steer projects to industrial sites with tax breaks,…
View more
Renewable power surpasses fossil fuels for first time in Europe
EU Renewable Power Overtakes Fossil Fuels, reflecting a greener energy mix as wind, solar, and…
View more
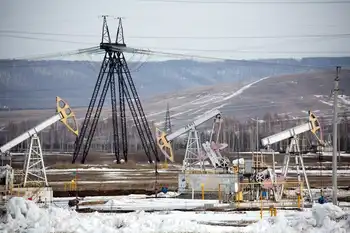
Global oil demand to decline in 2020 as Coronavirus weighs heavily on markets
COVID-19 Impact on Global Oil Demand 2020 signals an IEA forecast of declining consumption as…
View more
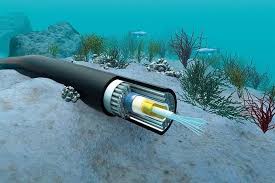
Spain and Ireland sign MoU to study undersea electricity interconnector
Spain-Ireland electricity interconnector: Governments signed a three-year MoU to study technical and economic feasibility, tasking…
View more

Utilities commission changes community choice exit fees; what happens now in San Diego?
CPUC Exit Fee Increase for CCAs adjusts the PCIA, affecting utilities, San Diego ratepayers, renewable…
View more
Sign Up for Electricity Forum’s Newsletter
Stay informed with our FREE Newsletter — get the latest news, breakthrough technologies, and expert insights, delivered straight to your inbox.
Electricity Today T&D Magazine Subscribe for FREE

Stay informed with the latest T&D policies and technologies.
- Timely insights from industry experts
- Practical solutions T&D engineers
- Free access to every issue
