NFPA 70b Training - Electrical Maintenance
Our customized live online or in‑person group training can be delivered to your staff at your location.

- Live Online
- 12 hours Instructor-led
- Group Training Available
Regular Price:
$699
Coupon Price:
$599
A new study makes the case that solar power is emerging as a cost-effective hedge against fossil fuels and is likely to reach cost parity with retail-electricity rates in most regions of the U.S. in less than a decade.
The Utility Solar Assessment (USA) Study, produced by clean-tech research and publishing firm Clean Edge and green-economy nonprofit Co-op America, provides a comprehensive roadmap for utilities, solar companies, and regulators to reach 10% solar in the U.S. by 2025.
The study finds that significantly scaling solar power in the U.S. will require the active involvement of utilities. The study delivers a to-do list for the three key stakeholders in the nationÂ’s solar industry. Among others, the action items include:
• For utilities: Take advantage of the unique value of solar for peak generation and alleviating grid congestion; implement solar as part of the build-out of the smart grid; and adapt to new market realities with new business models.
• For solar companies: Bring installed solar systems costs to $3 per peak watt or less by 2018; streamline installations; and make solar a truly plug-and-play technology.
• For regulators and policy makers: Pass a long-term extension of investment and production tax credits for solar and other renewables; establish open standards for solar interconnection; and give utilities the ability to “rate-base” solar.
The USA Study also reports that:
• For the first time solar power is beginning to reach cost parity with conventional energy sources. As solar prices decline and the capital and fuel costs for coal, natural gas, and nuclear plants rise, the U.S. will reach a crossover point by around 2015.
• Installed solar PV prices are projected to decline from an average $5.50-$7.00 peak watt (15-32 cents kWh) today to $3.02-$3.82 peak watt (8-18 cents kWh) in 2015 to $1.43-$1.82 peak watt (4-8 cents kWh) by 2025.
• Solar power offers a number of advantages over conventional energy sources. Among them, the ability to deliver energy at or near the point of use, zero fuel costs, minimal maintenance requirements and zero carbon-based source emissions.
• The investment to arrive at 10% solar in the U.S. is not small, reaching $450 billion to $560 billion between now and 2025, an average of $26 billion to $33 billion per year. However, given utilities’ existing capital costs such an investment is not prohibitive. To put the investment in perspective: Utilities spent an estimated $70 billion on new power plants and transmission and distribution systems in 2007 alone.
“One of the big takeaways from this report is that, in many ways, the future of solar is in the hands of utilities,” said Ron Pernick, Clean Edge cofounder and managing director and USA Study coauthor. “Reaching 10 percent of our electricity from solar sources by 2025 will require the active participation of utilities along with the support and participation of regulators and solar technology companies.”
In just the past year, a number of utilities and solar companies have announced aggressive programs to deploy large-scale solar power projects, including Southern California EdisonÂ’s plan to install 250 megawatts of distributed solar PV, Duke EnergyÂ’s stated goal of investing $100 million in rooftop solar, and Pacific Gas & ElectricÂ’s announcements to invest in thousands of megawatts of concentrating solar power in CaliforniaÂ’s deserts.
While these players are still in the vanguard, a number of other utilities are looking to join them to help bring solar power to scale – and the study shows that solar could become “ubiquitous” as with earlier semiconductor-based revolutions.
“As capital and fuel costs have doubled or tripled for coal, natural gas, and nuclear power over the past few years, solar power costs are coming down,” explains Alisa Gravitz, Co-op America executive director and USA Study project director. “For the first time in history, cost-competitive solar power is now within the planning horizon of every utility in the nation.”
The study, written by Pernick and Clean Edge contributing editor Clint Wilder, is based on interviews with more than 30 solar, utility, financial, and policy experts and leverages proprietary Clean Edge data on solar PV market size, cost and pricing history and projections, and other key market factors.
Related News
B.C. residents and businesses get break on electricity bills for three months
BC Hydro COVID-19 Bill Relief offers pandemic support with bill credits, rate cuts, and deferred…
View more

Energy Ministry may lower coal production target as Chinese demand falls
Indonesia Coal Production Cuts reflect weaker China demand, COVID-19 impacts, falling HBA reference prices, and…
View more

California faces huge power cuts as wildfires rage
California Wildfire Power Shut-Offs escalate as PG&E imposes blackouts amid high winds, Getty and Kincade…
View more
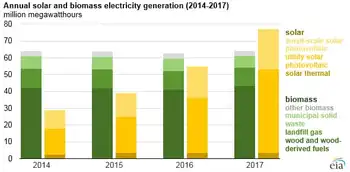
Solar Becomes #3 Renewable Electricity Source In USA
U.S. Solar Generation 2017 surpassed biomass, delivering 77 million MWh versus 64 million MWh, trailing…
View more

India to Ration Coal Supplies as Electricity Demand Surges
India Coal Supply Rationing redirects shipments from high-inventory power plants to stations facing shortages as…
View more
Hot Houston summer and cold winter set new electricity records
US Electricity Demand 2018-2050 projects slower growth as energy consumption, power generation, air conditioning, and…
View more
Sign Up for Electricity Forum’s Newsletter
Stay informed with our FREE Newsletter — get the latest news, breakthrough technologies, and expert insights, delivered straight to your inbox.
Electricity Today T&D Magazine Subscribe for FREE

Stay informed with the latest T&D policies and technologies.
- Timely insights from industry experts
- Practical solutions T&D engineers
- Free access to every issue

