NFPA 70E Training
Our customized live online or in‑person group training can be delivered to your staff at your location.

- Live Online
- 6 hours Instructor-led
- Group Training Available
Regular Price:
$199
Coupon Price:
$149
Hewlett-Packard (HP) is getting more detailed in how it analyzes the energy efficiency of its customers' datacenters.
HP introduced Thermal Zone Mapping, a new feature of its HP Services business that calculates how to improve server cooling while keeping electric bills down.
HP Services already analyzes datacenters by physically inspecting them and producing two-dimensional thermal photographs that show hot spots in red and cool spots in blue. It also creates three-dimensional photos that highlight airflow patterns from air conditioning vents and around server racks.
Thermal Zone Mapping goes beyond that with computer modeling, allowing datacenter managers to run scenarios, testing the effect on cooling demand of moving server racks or air conditioning vents to different locations. The mapping identifies "zones of influence" where the air is coldest, for example, said Brian Brouillette, vice president, of HP mission-critical, network, and education services within HP Services.
The mapping may show that one area is cooler than the rest of the room because it gets air from three air conditioning vents. "Maybe that's where I should be putting my most mission-critical servers... because it's got three times redundancy," Brouillette said. "(Planning) is no longer random."
HP is one of many technology companies touting energy-efficient products, services, or corporate commitment to green technology.
A 2006 survey of IT professionals by IDC showed that about one-fifth of them cited power and cooling as the number one issue they face in their datacenters, a greater proportion than cited disaster recovery, security, staffing, or any other issue.
Datacenters in the United States use 59 billion kilowatt hours of electricity per year, costing $4.1 billion and generating 864 million metric tons of carbon dioxide (CO2) emissions, said Thomas Goepel, program manager for adaptive infrastructure solutions in the HP Technology Solutions Group.
The mapping tool announcement follows another HP service unveiled in November 2006, Dynamic Smart Cooling (DSC). With DSC, small temperature monitors attached to each server rack detect if the temperature is rising because the server is doing more computations and increases the air conditioning aimed at that rack. When the server workload goes down, the air conditioning is dialed back. Wachovia Bank is testing a DSC installation at one of its datacenters, HP said.
IBM unveiled its Project Big Green initiative May 10, pledging to spend $1 billion every year to improve the energy efficiency of corporate datacenters.
Also, processor maker Advanced Micro Devices said it has surpassed goals it set in 2001 for reducing CO2 emissions and electricity usage at its own facilities. AMD set a goal of reducing CO2 by 40 percent but reached 50 percent at the end of 2006, and reduced electricity use by 40 percent, a third more than its 30 percent goal, said Steve Groseclose, director of global environmental health and safety at AMD.
AMD has set new goals to reduce CO2 emissions by another 33 percent and electrical usage by another 40 percent by 2010.
Related News

Electric vehicle sales triple in Australia despite lack of government support
Australian Electric Vehicle Sales tripled in 2019 amid expanding charging infrastructure and more models, but…
View more
Why electric buses haven't taken over the world—yet
Electric Buses reduce urban emissions and noise, but require charging infrastructure, grid upgrades, and depot…
View more
Ontario takes constitutional challenge of its global adjustment electricity fee to Supreme Court
Ontario Global Adjustment Supreme Court Appeal spotlights a constitutional challenge to Ontario's electricity charge, pitting…
View more
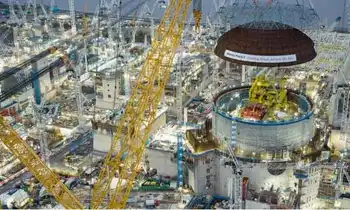
Hinkley C nuclear reactor roof lifted into place
Hinkley Point C dome lift marks a nuclear reactor milestone in Somerset, as EDF used…
View more

Group to create Canadian cyber standards for electricity sector IoT devices
Canadian Industrial IoT Cybersecurity Standards aim to unify device security for utilities, smart grids, SCADA,…
View more

Electricity blackouts spark protests in Iranian cities
Iran Power Outage Protests surge as electricity blackouts, drought, and a looming heat wave spark…
View more
Sign Up for Electricity Forum’s Newsletter
Stay informed with our FREE Newsletter — get the latest news, breakthrough technologies, and expert insights, delivered straight to your inbox.
Electricity Today T&D Magazine Subscribe for FREE

Stay informed with the latest T&D policies and technologies.
- Timely insights from industry experts
- Practical solutions T&D engineers
- Free access to every issue
