Hydroelectric retrofits for unpowered dams leverage turbines to add renewable capacity, bolster grid reliability, and enable low-impact energy storage, supporting U.S. and Canada decarbonization goals with lower costs, minimal habitat disruption, and climate resilience.
Key Points
They add turbines to existing dams to make clean power, stabilize the grid, and offer low-impact storage at lower cost.
✅ Lower capex than new dams; minimal habitat disruption
✅ Adds firming and storage to support wind and solar
✅ New low-head turbines unlock more retrofit sites
As countries race to get their power grids off fossil fuels to fight climate change, there's a big push in the U.S. to upgrade dams built for purposes such as water management or navigation with a feature they never had before — hydroelectric turbines.
And the strategy is being used in parts of Canada, too, with growing interest in hydropower from Canada supplying New York and New England.
The U.S. Energy Information Administration says only three per cent of 90,000 U.S. dams currently generate electricity. A 2012 report from the U.S. Department of Energy found that those dams have 12,000 megawatts (MW) of potential hydroelectric generation capacity. (According to the National Hydropower Association, 1 MW can power 750 to 1,000 homes. That means 12,000 MW should be able to power more than nine million homes.)
As of May 2019, there were projects planned to convert 32 unpowered dams to add 330 MW to the grid over the next several years.
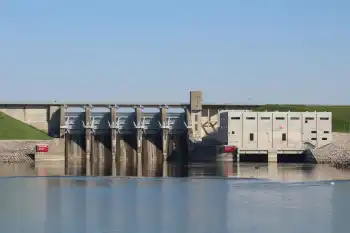
One that was recently completed was the Red Rock Hydroelectric Project, a 60-year-old flood control dam on the Des Moines River in Iowa that was retrofitted in 2014 to generate 36.4 MW at normal reservoir levels, and up to 55 MW at high reservoir levels and flows. It started feeding power to the grid this spring, and is expected to generate enough annually to supply power to 18,000 homes.
It's an approach that advocates say can convert more of the grid from fossil fuels to clean energy, often with a lower cost and environmental impact than building new dams.
Hydroelectric facilities can also be used for energy storage, complementing intermittent clean energy sources such as wind and solar with pumped storage to help maintain a more reliable, resilient grid.
The Nature Conservancy and the World Wildlife Fund are two environmental groups that oppose new hydro dams because they can block fish migration, harm water quality, damage surrounding ecosystems and release methane and CO2, and in some regions, Western Canada drought has reduced hydropower output as reservoirs run low. But they say adding turbines to non-powered dams can be part of a shift toward low-impact hydro projects that can support expansion of solar and wind power.
Paul Norris, president of the Ontario Waterpower Association, said there's typically widespread community support for such projects in his province amid ongoing debate over whether Ontario is embracing clean power in its future plans. "Any time that you can better use existing assets, I think that's a good thing."
New turbine technology means water doesn't need to fall from as great a height to generate power, providing opportunities at sites that weren't commercially viable in the past, Norris said, with recent investments such as new turbines in Manitoba showing what is possible.
In Ontario, about 1,000 unpowered dams are owned by various levels of government. "With the appropriate policy framework, many of these assets have the potential to be retrofitted for small hydro," Norris wrote in a letter to Ontario's Independent Electricity System Operator this year as part of a discussion on small-scale local energy generation resources.
He told CBC that several such projects are already in operation, such as a 950 kW retrofit of the McLeod Dam at the Moira River in Belleville, Ont., in 2008.
Four hydro stations were going to be added during dam refurbishment on the Trent-Severn Waterway, but they were among 758 renewable energy projects cancelled by Premier Doug Ford's government after his election in 2018, a move examined in an analysis of Ontario's dirtier electricity outlook and its implications.
Patrick Bateman, senior vice-president of Waterpower Canada, said such dam retrofit projects are uncommon in most provinces. "I don't see it being a large part of the future electricity generation capacity."
He said there has been less movement on retrofitting unpowered dams in Canada compared to the U.S., because:
There are a lot more opportunities in Canada to refurbish large, existing hydro-generating stations to boost capacity on a bigger scale.
There's less growth in demand for clean energy, because more of Canada's grid is already non-carbon-emitting (80 per cent) compared to the U.S. (40 per cent).
Even so, Norris thinks Canadians should be looking at all opportunities and options when it comes to transitioning the grid away from fossil fuels, including retrofitting non-powered dams, especially as a recent report highlights Canada's looming power problem over the coming decades.
"If we're going to be serious about addressing the inevitable challenges associated with climate change targets and net zero, it really is an all-of-the-above approach."
Related News