Texas is wind king, but Iowa breezes past California

By Associated Press


CSA Z463 Electrical Maintenance

Our customized live online or in‑person group training can be delivered to your staff at your location.

  • Live Online
  • 6 hours Instructor-led
  • Group Training Available
Regular Price:
$249
Coupon Price:
$199
Reserve Your Seat Today
Texas continues to blow away the competition, but Iowa can now generate more wind power than California, according to a new industry report.

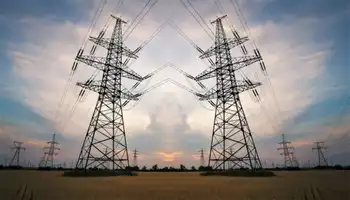
The Lone Star state's 7,118 megawatts dwarfs Iowa's 2,791 megawatts and California's 2,517 megawatts, but wind power has grown into a key part of the energy infrastructure in Minnesota and Iowa, where each state generates more than 7 percent of their electricity from turbines, the American Wind Energy Association study said.

States are trying to lure wind energy companies and the jobs that come with them, especially with new federal requirements that will require more power from alternative sources in coming years.

While jobs in the wind industry jumped by 70 percent to 85,000 last year, the association's chief executive warned that more must be done to prevent the industry from stalling.

"We need the right policies in place for our industry to maintain its momentum," said Denise Bode in a release.

The passage of a national Renewable Electricity Standard that would require utilities to generate a quarter of their electricity from renewable energy by 2025 is vital to long-term growth, said Bode.

Global investment in alternative energy was cut in half during the first quarter of 2009, according to one study. Billions in investments have vanished with the recession.

Shares in wind, solar and geothermal companies took a pummeling from investors this year. Investments in companies devoted solely to clean energy fell to about $100 million from $2.1 billion, according to New Energy Finance, an industry-research firm.

Still, 2008 was a big year for the industry.

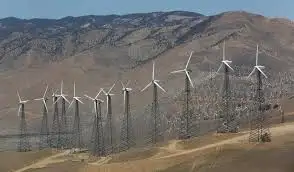
U.S. wind farms, with a combined capacity of 25,300 megawatts at the end of last year, should be able to generate some 73 billion kilowatt hours of power in 2009, enough to serve nearly 7 million homes, the association said.

The association estimates that 10 new manufacturing facilities started up in 2008, while 17 were expanded and 30 new plants were announced.

Indiana added its first utility-scale wind project. Michigan, Utah, New Hampshire and Wisconsin grew at the fastest clip.

Still, big wind power states added the most capacity by far, led by Texas with 2671.3 new megawatts and Iowa with 1599.8 megawatts. Minnesota, Kansas and New York added between 400 and 455 megawatts each.

FPL Group Inc. subsidiary NextEra Energy Resources continues to dominate the landscape with ownership of about 25 percent of the total installed U.S. wind projects, totaling 6,290 megawatts. Iberdrola Renewables, MidAmerican Energy and Horizon-Energia de Portugal combine for the next 25 percent.

GE Energy installed the most turbines in 2008, accounting for 43 percent of new capacity. Vestas, 13 percent; Siemens and Suzlon, 9 percent each; and Gamesa, 7 percent, rounded out the Top 5.

Related News

Potent greenhouse gas declines in the US, confirming success of control efforts

US SF6 Emissions Decline as NOAA analysis and EPA mitigation show progress, with atmospheric measurements and Greenhouse Gas Reporting verifying reductions from the electric power grid; sulfur hexafluoride's extreme global warming potential underscores inventory improvements.


Key Points

A documented drop in US sulfur hexafluoride emissions, confirmed by NOAA atmospheric data and EPA reporting reforms.

✅ NOAA towers and aircraft show 2007-2018 decline

✅ EPA reporting and utility mitigation narrowed inventory gaps

✅ Winter leaks and servicing signal further reduction options


A new NOAA analysis shows U.S. emissions of the super-potent greenhouse gas sulfur hexafluoride (SF6) have declined between 2007-2018, likely due to successful mitigation efforts by the Environmental Protection Agency (EPA) and the electric power industry, with attention to SF6 in the power industry across global markets. 

At the same time, significant disparities that existed previously between NOAA’s estimates, which are based on atmospheric measurements, and EPA’s estimates, which are based on a combination of reported emissions and industrial activity, have narrowed following the establishment of the EPA's Greenhouse Gas Reporting Program. The findings, published in the journal Atmospheric Chemistry and Physics, also suggest how additional emissions reductions might be achieved. 

SF6 is most commonly used as an electrical insulator in high-voltage equipment that transmits and distributes electricity, and its emissions have been increasing worldwide as electric power systems expand, even as regions hit milestones like California clean energy surpluses in recent years. Smaller amounts of SF6 are used in semiconductor manufacturing and in magnesium production. 

SF6 traps 25,000 times more heat than carbon dioxide over a 100-year time scale for equal amounts of emissions, and while CO2 emissions flatlined in 2019 globally, that comparison underscores the potency of SF6. That means a relatively small amount of the gas can have a significant impact on climate warming. Because of its extremely large global warming potential and long atmospheric lifetime, SF6 emissions will influence Earth’s climate for thousands of years.

In this study, researchers from NOAA’s Global Monitoring Laboratory, as record greenhouse gas concentrations drive demand for better data, working with colleagues at EPA, CIRES, and the University of Maryland, estimated U.S. SF6 emissions for the first time from atmospheric measurements collected at a network of tall towers and aircraft in NOAA’s Global Greenhouse Gas Reference Network. The researchers provided an estimate of SF6 emissions independent from the EPA’s estimate, which is based on reported SF6 emissions for some industrial facilities and on estimated SF6 emissions for others.

“We observed differences between our atmospheric estimates and the EPA’s activity-based estimates,” said study lead author Lei Hu, a Global Monitoring Laboratory researcher who was a CIRES scientist at the time of the study. “But by closely collaborating with the EPA, we were able to identify processes potentially responsible for a significant portion of this difference, highlighting ways to improve emission inventories and suggesting additional emission mitigation opportunities, such as forthcoming EPA carbon capture rules for power plants, in the future.” 

In the 1990s, the EPA launched voluntary partnerships with the electric power, where power-sector carbon emissions are falling as generation shifts, magnesium, and semiconductor industries to reduce SF6 emissions after the United States recognized that its emissions were significant. In 2011, large SF6 -emitting facilities were required to begin tracking and reporting their emissions under the EPA Greenhouse Gas Reporting Program. 

Hu and her colleagues documented a decline of about 60 percent in U.S. SF6 emissions between 2007-2018, amid global declines in coal-fired power in some years—equivalent to a reduction of between 6 and 20 million metric tons of CO2 emissions during that time period—likely due in part to the voluntary emission reduction partnerships and the EPA reporting requirement. A more modest declining trend has also been reported in the EPA’s national inventories submitted annually under the United Nations Framework Convention on Climate Change. 

Examining the differences between the NOAA and EPA independent estimates, the researchers found that the EPA’s past inventory analyses likely underestimated SF6 emissions from electrical power transmission and distribution facilities, and from a single SF6 production plant in Illinois. According to Hu, the research collaboration has likely improved the accuracy of the EPA inventories. The 2023 draft of the EPA’s U.S. Greenhouse Gas Emissions and Sinks: 1990-2021 used the results of this study to support revisions to its estimates of SF6 emissions from electrical transmission and distribution. 

The collaboration may also lead to improvements in the atmosphere-based estimates, helping NOAA identify how to expand or rework its network to better capture emitting industries or areas with significant emissions, according to Steve Montzka, senior scientist at GML and one of the paper’s authors.

Hu and her colleagues also found a seasonal variation in SF6 emissions from the atmosphere-based analysis, with higher emissions in winter than in summer. Industry representatives identified increased servicing of electrical power equipment in the southern states and leakage from aging brittle sealing materials in the equipment in northern states during winter as likely explanations for the enhanced wintertime emissions—findings that suggest opportunities for further emissions reductions.

“This is a great example of the future of greenhouse gas emission tracking, where inventory compilers and atmospheric scientists work together to better understand emissions and shed light on ways to further reduce them,” said Montzka.


Related News

View more

Biden calls for 100 percent clean electricity by 2035. Here’s how far we have to go.

Biden Clean Energy Plan 2035 accelerates carbon-free electricity with renewables, nuclear, hydropower, and biomass, invests $2T in EVs, grid and energy efficiency, and tightens fuel economy standards beyond the Clean Power Plan.


Key Points

A $2T U.S. climate plan for carbon-free power by 2035, boosting renewables, nuclear, EVs, efficiency, and grid upgrades.

✅ Targets a zero-carbon electric grid nationwide by 2035

✅ Includes renewables, nuclear, hydropower, and biomass in standard

✅ Funds EVs, grid modernization, weatherization, and fuel economy rules


This month the Democratic presumptive presidential nominee, Joe Biden, outlined an ambitious plan, including Biden’s solar plan to expand clean energy, for tackling climate change that shows how far the party has shifted on the issue since it controlled the White House.

President Barack Obama’s Clean Power Plan had called for the electricity sector to cut its carbon pollution 32 percent by 2030, and did not lay out a trajectory for phasing out oil, coal or natural gas production.

This year, Democratic 2020 hopefuls such as Sen. Bernie Sanders (I-Vt.) went much further, suggesting the United States should derive all of its electricity from renewable sources by 2030, moving to 100% renewables as part of a $16.3 trillion plan to wean the nation away from fossil fuels. Many other congressional Democrats have embraced the Green New Deal — the nonbinding resolution calling for a carbon-free power sector by 2030 and more energy efficient buildings and vehicles, along with a massive investment in electric vehicles and high-speed rail.

Last year, 38 percent of U.S. electricity generated came from clean sources, according to a Washington Post analysis of data from the U.S. Energy Information Administration, and in April renewables hit a record 28% nationwide.

Biden’s new plan, which carries a price tag of $2 trillion, would eliminate carbon emissions from the electric sector by 2035, impose stricter gas mileage standards, fund investments to weatherize millions of homes and commercial buildings, and upgrade the nation’s transportation system. To reach its 2035 carbon-free electricity goal, the campaign includes wind, solar and several forms of energy, acknowledging why the grid isn’t yet 100% renewable while balancing reliability, that are not always counted in state renewable portfolio standards, such as nuclear, hydropower and biomass.

“A great appeal of the Biden proposal is that it is much closer to targeting carbon directly, which is the ultimate enemy, and plays fewer favorites with particular technologies,” said Michael Greenstone, who directs the University of Chicago’s Energy Policy Institute. “This will reduce the costs to consumers and give more carbon bang for the buck.”

But some environmentalists, such as Friends of the Earth President Erich Pica, question the idea of including more controversial carbon-free technologies. “There is no role for nuclear in a least-cost, low carbon world. Including these dinosaurs in a clean energy standard is going to incentivize industry efforts to keep aging, dangerous facilities online,” Pica said in an email.

Hydropower, which relies on a system of moving water that constantly recharges, is defined as renewable by the Environmental Protection Agency. Biomass is often considered as carbon neutral because even though it releases carbon dioxide when it is burned, the plants capture nearly the same amount of CO2 while growing.


Both forms of energy have come under fire for their environmental impacts, however. Damming streams and rivers can destroy fish habitat and make it more difficult for them to spawn, and it also seems unlikely that hydropower will expand its current 6 percent share of the nation’s electrical grid.

Many experts argue that classifying biomass energy as carbon neutral provides an incentive to cut down trees that would otherwise remain standing and sequester carbon. “If burning this wood were good for the climate, then we should not recycle paper, we should burn it,” noted Tim Searchinger, a research scholar at the Princeton School of Public and International Affairs.

Illinois lead the nation in the amount of electricity generated from nuclear power

More than half of the country — 30 states, Washington, and three territories — have adopted a renewable portfolio standard (RPS), according to the National Conference of State Legislatures, and seven states and one territory have set renewable energy goals. While 14 states, along with the District, Puerto Rico and the Virgin Islands, have established requirements of 50 percent or more carbon-free electricity, nearly as many have set theirs at 15 percent or less.

Maine Gov. Janet Mills (D), who has called for 100% renewable electricity in the state, has pushed clean electricity aggressively since taking office in 2019, lifting a wind energy moratorium imposed by her predecessor and signing bills aimed at expanding the state’s carbon-free energy sources. Biomass accounts for a quarter of the state’s electricity, more than any other state.

New York has one of the country’s most ambitious climate targets, which it scaled up last year. It aims to obtain 70 percent of its power from renewable sources within a decade, a period when renewables surpassed coal in U.S. generation, and eliminate carbon altogether by 2040, even as the state is in the process of shutting down a major nuclear plant near New York City, Indian Point, which is slated to cease operating on April 30, 2021.

... while other states are weakening theirs

Last year, Ohio weakened its renewable energy standard from a target of 12.5 percent in 2027 to 8.5 percent by 2026, even as renewables topped coal nationwide for the first time in over a century, without setting any future goals, and jettisoned its energy efficiency standard. West Virginia — which established modest renewable requirements in 2009 — repealed them altogether in 2015, the year they were set to take effect.


Related News

View more

Warren Buffett’s Secret To Cheap Electricity: Wind

Berkshire Hathaway Energy Wind Power drives cheap electricity rates in Iowa via utility-scale wind turbines, integrated transmission, battery storage, and grid management, delivering renewable energy, stable pricing, and long-term rate freezes through 2028.


Key Points

A vertically integrated wind utility lowering Iowa rates via owned generation, transmission, and advanced grid control.

✅ Owned wind assets meet Iowa residential demand

✅ Integrated transmission lowers costs and losses

✅ Rate freeze through 2028 sustains cheap power


In his latest letter to Berkshire Hathaway shareholders, Warren Buffett used the 20th anniversary of Berkshire Hathaway Energy to tout its cheap electricity bills for customers.

When Berkshire purchased the majority share of BHE in 2000, the cost of electricity for its residential customers in Iowa was 8.8 cents per kilowatt-hour (kWh) on average. Since then, these electricity rates have risen at a paltry <1% per year, with a freeze on rate hikes through 2028. As anyone who pays an electricity bill knows, that is an incredible deal.  

As Buffett himself notes with alacrity, “Last year, the rates [BHE’s competitor in Iowa] charged its residential customers were 61% higher than BHE’s. Recently, that utility received a rate increase that will widen the gap to 70%.”


The Winning Strategy

So, what’s Buffett’s secret to cheap electricity? Wind power.

“The extraordinary differential between our rates and theirs is largely the result of our huge accomplishments in converting wind into electricity,” Buffett explains. 

Wind turbines in Iowa that BHE owns and operates are expected to generate about 25.2 million megawatt-hours (MWh) of electricity for its customers, as projects like Building Energy operations begin to contribute. By Buffett’s estimations, that will be enough to power all of its residential customers’ electricity needs in Iowa.  


The company has plans to increase its renewable energy generation in other regions as well. This year, BHE Canada is expected to start construction on a 117.6MW wind farm in Alberta, Canada with its partner, Renewable Energy Systems, that will provide electricity to 79,000 homes in Canada’s oil country.

Observers note that Alberta is a powerhouse for both green energy and fossil fuels, underscoring the region's unique transition.

But I would argue that the secret to BHE’s success perhaps goes deeper than transitioning to sources of renewable energy. There are plenty of other utility companies that have adopted wind and solar power as an energy source. In the U.S., where renewable electricity surpassed coal in 2022, at least 50% of electricity customers have the option to buy renewable electricity from their power supplier, according to the Department of Energy. And some states, such as New York, have gone so far as to allow customers to pick from providers who generate their electricity.

What differentiates BHE from a lot of the competition in the utility space is that it owns the means to generate, store, transmit and supply renewable power to its customers across the U.S., U.K. and Canada, with lessons from the U.K. about wind power informing policy.

In its financial filings for 2019, the company reported that it owns 33,600MW of generation capacity and has 33,400 miles of transmission lines, as well as a 50% interest in Electric Transmission Texas (ETT) that has approximately 1,200 miles of transmission lines. This scale and integration enables BHE to be efficient in the distribution and sale of electricity, including selling renewable energy across regions.

BHE is certainly not alone in building renewable-energy fueled electricity dominions. Its largest competitor, NextEra, built 15GW of wind capacity and has started to expand its utility-scale solar installations. Duke Energy owns and operates 2,900 MW of renewable energy, including wind and solar. Exelon operates 40 wind turbine sites across the U.S. that generate 1,500 MW.


Integrated Utilities Power Ahead

It’s easy to see why utility companies see wind as a competitive source of electricity compared to fossil fuels. As I explained in my previous post, Trump’s Wrong About Wind, the cost of building and generating wind energy have fallen significantly over the past decade. Meanwhile, improvements in battery storage and power management through new technological advancements have made it more reliable (Warren Buffett bet on that one too).

But what is also striking is that integrated power and transmission enables these utility companies to make those decisions; both in terms of sourcing power from renewable energy, as well as the pricing of the final product. Until wind and solar power are widespread, these utility companies are going to have an edge of the more fragmented ends of the industry who can’t make these purchasing or pricing decisions independently. 

Warren Buffett very rarely misses a beat. He’s not the Oracle of Omaha for nothing. Berkshire Hathaway’s ownership of BHE has been immensely profitable for its shareholders. In the year ended December 31, 2019, BHE and its subsidiaries reported net income attributable to BHE shareholders of $2.95 billion.

There’s no question that renewable energy will transform the utility industry over the next decade. That change will be led by the likes of BHE, who have the power to invest, control and manage their own energy generation assets.


Related News

View more

Solar Becomes #3 Renewable Electricity Source In USA

U.S. Solar Generation 2017 surpassed biomass, delivering 77 million MWh versus 64 million MWh, trailing only hydro and wind; driven by PV expansion, capacity additions, and utility-scale and small-scale growth, per EIA.


Key Points

It was the year U.S. solar electricity exceeded biomass, hitting 77 million MWh and trailing only hydro and wind.

✅ Solar: 77 million MWh; Biomass: 64 million MWh (2017, EIA)

✅ PV expansion; late-year capacity additions dampen annual generation

✅ Hydro: 300 and wind: 254 million MWh; solar thermal ~3 million MWh


Electricity generation from solar resources in the United States reached 77 million megawatthours (MWh) in 2017, surpassing for the first time annual generation from biomass resources, which generated 64 million MWh in 2017. Among renewable sources, only hydro and wind generated more electricity in 2017, at 300 million MWh and 254 million MWh, respectively. Biomass generating capacity has remained relatively unchanged in recent years, while solar generating capacity has consistently grown.

Annual growth in solar generation often lags annual capacity additions because generating capacity tends to be added late in the year. For example, in 2016, 29% of total utility-scale solar generating capacity additions occurred in December, leaving few days for an installed project to contribute to total annual generation despite being counted in annual generating capacity additions. In 2017, December solar additions accounted for 21% of the annual total. Overall, solar technologies operate at lower annual capacity factors and experience more seasonal variation than biomass technologies.

Biomass electricity generation comes from multiple fuel sources, such as wood solids (68% of total biomass electricity generation in 2017), landfill gas (17%), municipal solid waste (11%), and other biogenic and nonbiogenic materials (4%).These shares of biomass generation have remained relatively constant in recent years, even as renewables' rise in 2020 across the grid.

Solar can be divided into three types: solar thermal, which converts sunlight to steam to produce power; large-scale solar photovoltaic (PV), which uses PV cells to directly produce electricity from sunlight; and small-scale solar, which are PV installations of 1 megawatt or smaller. Generation from solar thermal sources has remained relatively flat in recent years, at about 3 million MWh, even as renewables surpassed coal in 2022 nationwide. The most recent addition of solar thermal capacity was the Crescent Dunes Solar Energy plant installed in Nevada in 2015, and currently no solar thermal generators are under construction in the United States.

Solar photovoltaic systems, however, have consistently grown in recent years, as indicated by 2022 U.S. solar growth metrics across the sector. In 2014, large-scale solar PV systems generated 15 million MWh, and small-scale PV systems generated 11 million MWh. By 2017, annual electricity from those sources had increased to 50 million MWh and 24 million MWh, respectively, with projections that solar could reach 20% by 2050 in the U.S. mix. By the end of 2018, EIA expects an additional 5,067 MW of large-scale PV to come online, according to EIA’s Preliminary Monthly Electric Generator Inventory, with solar and storage momentum expected to accelerate. Information about planned small-scale PV systems (one megawatt and below) is not collected in that survey.


Related News

View more

Cape Town to Build Own Power Plants, Buy Additional Electricity

Cape Town Renewable Energy Plan targets 450+ MW via solar, wind, and battery storage, cutting Eskom reliance, lowering greenhouse gas emissions, stabilizing electricity prices, and boosting grid resilience through municipal procurement, PPAs, and city-owned plants.


Key Points

A municipal plan to procure over 450 MW, cut Eskom reliance, stabilize prices, and reduce Cape Town emissions.

✅ Up to 150 MW from private plants within the city

✅ 300 MW to be purchased from outside Cape Town later

✅ City financing 100-200 MW of its own generation


Cape Town is seeking to secure more than 450 megawatts of power from renewable sources to cut reliance on state power utility Eskom Holdings SOC Ltd., where wind procurement cuts were considered during lockdown, and reduce greenhouse gas emissions.

South Africa’s second-biggest city is looking at a range of options, including geothermal exploration in comparable markets, and expects the bulk of the electricity to be generated from solar plants, Kadri Nassiep, the city’s executive director of energy and climate change, said in an interview.

On July 14 the city of 4.6 million people released a request for information to seek funding to build its own plants. This month or next it will seek proposals for the provision of as much as 150 megawatts from privately owned plants, largely solar additions, to be built and operated within the city, he said. As much as 300 megawatts may also be purchased at a later stage from plants outside of Cape Town, according to Nassiep.

The city could secure finance to build 100 to 200 megawatts of its own generation capacity, Nassiep said. “We realized that it is important for the city to be more in control around the pricing of the power,” he added.

Power Outages

Cape Town’s foray into the securing of power from sources other than Eskom comes after more than a decade of intermittent electricity outages, while elsewhere in Africa coal projects face scrutiny from lenders, because the utility can’t meet national demand. The government last year said municipalities could find alternative suppliers.

Earlier this month Ethekwini, the municipal area that includes the city of Durban, issued a request for information for the provision of 400 megawatts of power, similar to BC Hydro’s call for power driven by EV uptake.

The City of Johannesburg will in September seek information and proposals for the construction of a 150-megawatt solar plant, reflecting moves like Ontario’s new wind and solar procurements to tackle supply gaps, 50 megawatts of rooftop solar panels and the refurbishment of an idle gas-fired plant that could generate 20 megawatts, it said in June. It will also seek information for the installation of 100 megawatts of battery storage.

Cape Town, which uses a peak of 1,800 megawatts of electricity in winter, hopes to start generating some of its own power next year, aligning with SaskPower’s 2030 renewables plan seen in Canada, according to a statement that accompanied its request for financing proposals.


Related News

View more

Trump's Pledge to Scrap Offshore Wind Projects

Trump Offshore Wind Pledge signals a push for deregulation over renewable energy, challenging climate policy, green jobs, and coastal development while citing marine ecosystems, navigation, and energy independence amid state-federal permitting and legal hurdles.


Key Points

Trump's vow to cancel offshore wind projects favors deregulation and fossil fuels, impacting climate policy and jobs.

✅ Day-one plan to scrap offshore wind leases and permits

✅ Risks to renewable targets, grid mix, and coastal supply chains

✅ Likely court fights and state-federal regulatory conflicts


During his tenure as President of the United States, Donald Trump made numerous promises and policy proposals, many of which sparked controversy and debate. One such pledge was his vow to scrap offshore wind projects on "day one" of his presidency. This bold statement, while appealing to certain interests, raised concerns about its potential impact on U.S. offshore wind growth and environmental conservation efforts.

Trump's opposition to offshore wind projects stemmed from various factors, including his skepticism towards renewable energy, even as forecasts point to a $1 trillion offshore wind market in coming years, concerns about aesthetics and property values, and his focus on promoting traditional energy sources like coal and oil. Throughout his presidency, Trump prioritized deregulation and sought to roll back environmental policies introduced by previous administrations, arguing that they stifled economic growth and hindered American energy independence.

The prospect of scrapping offshore wind projects drew mixed reactions from different stakeholders. Supporters of Trump's proposal pointed to potential benefits such as preserving scenic coastal landscapes, protecting marine ecosystems, and addressing concerns about navigational safety and national security. Critics, however, raised valid concerns about the implications of such a decision on the renewable energy sector, including progress toward getting 1 GW on the grid nationwide, climate change mitigation efforts, and job creation in the burgeoning green economy.

Offshore wind energy has emerged as a promising source of clean, renewable power with the potential to reduce greenhouse gas emissions and diversify the energy mix. Countries like Denmark, the United Kingdom, and Germany have made significant investments in offshore wind in Europe, demonstrating its viability as a sustainable energy solution. In the United States, offshore wind projects have gained traction in states like Massachusetts, New York, and New Jersey, where coastal conditions are conducive to wind energy generation.

Trump's pledge to scrap offshore wind projects on "day one" of his presidency raised questions about the feasibility and legality of such a move. While the president has authority over certain aspects of energy policy and regulatory oversight, the development of offshore wind projects often involves multiple stakeholders, including state governments, local communities, private developers, and federal agencies, and actions such as Interior's move on Vineyard Wind illustrate federal leverage in permitting. Any attempt to halt or reverse ongoing projects would likely face legal challenges and regulatory hurdles, potentially delaying or derailing implementation.

Moreover, Trump's stance on offshore wind projects reflected broader debates about the future of energy policy, environmental protection, and economic development. While some argued for prioritizing fossil fuel extraction and traditional energy infrastructure, others advocated for a transition towards clean, renewable energy sources, drawing on lessons from the U.K. about wind deployment, to mitigate climate change and promote sustainable development. The Biden administration, which succeeded the Trump presidency, has signaled a shift towards a more climate-conscious agenda, including support for renewable energy initiatives and commitments to rejoin international agreements like the Paris Climate Accord.

In hindsight, Trump's pledge to scrap offshore wind projects on "day one" of his presidency underscores the complexities of energy policy and the importance of balancing competing interests and priorities. While concerns about aesthetics, property values, and environmental impact are valid, addressing the urgent challenge of climate change requires bold action and innovation in the energy sector. Offshore wind energy presents an opportunity, as seen in the country's biggest offshore wind farm approved in New York, to harness the power of nature in a way that is both environmentally responsible and economically beneficial. As the United States navigates its energy future, finding common ground and forging partnerships will be essential to ensure a sustainable and prosperous tomorrow.


Related News

View more

Sign Up for Electricity Forum’s Newsletter

Stay informed with our FREE Newsletter — get the latest news, breakthrough technologies, and expert insights, delivered straight to your inbox.

Electricity Today T&D Magazine Subscribe for FREE

Stay informed with the latest T&D policies and technologies.
  • Timely insights from industry experts
  • Practical solutions T&D engineers
  • Free access to every issue

Download the 2025 Electrical Training Catalog

Explore 50+ live, expert-led electrical training courses –

  • Interactive
  • Flexible
  • CEU-cerified