Saskatchewan town turns carbon trap into cash

By Toronto Star


CSA Z462 Arc Flash Training - Electrical Safety Essentials

Our customized live online or in‑person group training can be delivered to your staff at your location.

  • Live Online
  • 6 hours Instructor-led
  • Group Training Available
Regular Price:
$249
Coupon Price:
$199
Reserve Your Seat Today
Carbon dioxide has breathed new life into this small southern Saskatchewan city.

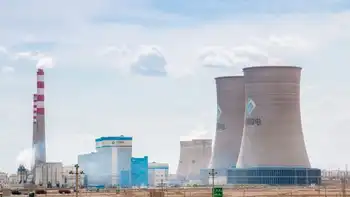
The odourless, tasteless gas and major global warming ingredient is pumped in from a coal gasification plant in North Dakota to help push untapped oil reserves to the surface and extend the life of an old oil field by 25 years.

Thousands of nodding oil pump jacks dot the landscape well into the Saskatchewan horizon, many of them assisted by the cast-off gas.

"It has put Weyburn, Saskatchewan, Canada not just on the provincial or national map – it has put us on the international map," says Mayor Debra Button, who is tickled pink to be leading this boomtown of 10,000 people.

And the best part, the experts say, is that the water soluble gas doesn't appear to escape from its earthly prison, presenting opportunities to capture the pollutant in the ground.

Besides new life for an old field, the use of CO2 makes the Weyburn site, operated by EnCana Corp., the largest greenhouse gas sequestration project in the world.

As Button points out, the experimental procedure has captured the attention of world leaders, including U.S. President Barack Obama, as they wrestle with ways to fight global warming.

"I would say modestly we are the leaders internationally in carbon capture and sequestration because of Weyburn," Saskatchewan Premier Brad Wall told the Star.

According to reports, the so-called CO2 flood, along with other measures, has resulted in a 65 per cent increase in oil production, and is expected to produce at least 130 million barrels of incremental oil by extending the life of the oil field by more than two decades.

It all means that Weyburn, which calls itself the Opportunity City, is booming. Homes are pushing out into the prairies and brand new pickup trucks are a common sight.

"We are blessed," said Button, trying to put the whole thing in perspective.

"In 2004, the city sold and developed seven residential lots and in 2008 we sold and developed 76. That's a 985 per cent increase. Just that alone gives you an indication of the growth," she said, adding the Weyburn boom is often compared to Alberta's Fort McMurray.

Weyburn is the gateway to the Bakken oil field, a massive oil reserve stretching across North Dakota, Montana and southeastern Saskatchewan, which dwarfs the Leduc oil discovery in Alberta in 1947, considered a seminal moment in Canada's oil wealth.

When Norman Wells, 81, a retired City of Calgary employee, and his wife Bev Hunt were looking around for a place to settle down, Weyburn was an unexpected surprise.

"They are building like crazy," said Wells as he looked out over his burgeoning neighbourhood.

"There are lot of oil jobs and there is lots of money."

Hunt can attest to that. She works at York Jewellers Ltd. in downtown Weyburn, where business keeps the seven employees hopping.

"You can tell the economy is thriving here by what people are buying. You can't believe the amount of jewellery that we move," Hunt said.

Weyburn is the oft-used example of the Saskatchewan boom, with people coming here from across the country.

"You can make less money and work here," said Rex Williams, 51, a house painter who lived in Alberta for 15 years before deciding he wanted life in the slow lane.

"Things move slowly around here. That's why I like it. There is absolutely no pressure here."

Related News

Which of the cleaner states imports dirty electricity?

Hourly Electricity Emissions Tracking maps grid balancing areas, embodied emissions, and imports/exports, revealing carbon intensity shifts across PJM, ERCOT, and California ISO, and clarifying renewable energy versus coal impacts on health and climate.


Key Points

An hourly method tracing generation, flows, and embodied emissions to quantify carbon intensity across US balancing areas.

✅ Hourly traces of imports/exports and generation mix

✅ Consumption-based carbon intensity by balancing area

✅ Policy insights for renewables, coal, health costs


In the United States, electricity generation accounts for nearly 30% of our carbon emissions. Some states have responded to that by setting aggressive renewable energy standards; others are hoping to see coal propped up even as its economics get worse. Complicating matters further is the fact that many regional grids are integrated, and as America goes electric the stakes grow, meaning power generated in one location may be exported and used in a different state entirely.

Tracking these electricity exports is critical for understanding how to lower our national carbon emissions. In addition, power from a dirty source like coal has health and environment impacts where it's produced, and the costs of these aren't always paid by the parties using the electricity. Unfortunately, getting reliable figures on how electricity is produced and where it's used is challenging, even for consumers trying to find where their electricity comes from in the first place, leaving some of the best estimates with a time resolution of only a month.

Now, three Stanford researchers—Jacques A. de Chalendar, John Taggart, and Sally M. Benson—have greatly improved on that standard, and they have managed to track power generation and use on an hourly basis. The researchers found that, of the 66 grid balancing areas within the United States, only three have carbon emissions equivalent to our national average, and they have found that imports and exports of electricity have both seasonal and daily changes. de Chalendar et al. discovered that the net results can be substantial, with imported electricity increasing California's emissions/power by 20%.

Hour by hour
To figure out the US energy trading landscape, the researchers obtained 2016 data for grid features called balancing areas. The continental US has 66 of these, providing much better spatial resolution on the data than the larger grid subdivisions. This doesn't cover everything—several balancing areas in Canada and Mexico are tied in to the US grid—and some of these balancing areas are much larger than others. The PJM grid, serving Pennsylvania, New Jersey, and Maryland, for example, is more than twice as large as Texas' ERCOT, in a state that produces and consumes the most electricity in the US.

Despite these limitations, it's possible to get hourly figures on how much electricity was generated, what was used to produce it, and whether it was used locally or exported to another balancing area. Information on the generating sources allowed the researchers to attach an emissions figure to each unit of electricity produced. Coal, for example, produces double the emissions of natural gas, which in turn produces more than an order of magnitude more carbon dioxide than the manufacturing of solar, wind, or hydro facilities. These figures were turned into what the authors call "embodied emissions" that can be traced to where they're eventually used.

Similar figures were also generated for sulfur dioxide and nitrogen oxides. Released by the burning of fossil fuels, these can both influence the global climate and produce local health problems.

Huge variation
The results were striking. "The consumption-based carbon intensity of electricity varies by almost an order of magnitude across the different regions in the US electricity system," the authors conclude. The low is the Bonneville Power grid region, which is largely supplied by hydropower; it has typical emissions below 100kg of carbon dioxide per megawatt-hour. The highest emissions come in the Ohio Valley Electric region, where emissions clear 900kg/MW-hr. Only three regional grids match the overall grid emissions intensity, although that includes the very large PJM (where capacity auction payouts recently fell), ERCOT, and Southern Co balancing areas.

Most of the low-emissions power that's exported comes from the Pacific Northwest's abundant hydropower, while the Rocky Mountains area exports electricity with the highest associated emissions. That leads to some striking asymmetries. Local generation in the hydro-rich Idaho Power Company has embodied emissions of only 71kg/MW-hr, while its imports, coming primarily from Rocky Mountain states, have a carbon content of 625kg/MW-hr.

The reliance on hydropower also makes the asymmetry seasonal. Local generation is highest in the spring as snow melts, but imports become a larger source outside this time of year. As solar and wind can also have pronounced seasonal shifts, similar changes will likely be seen as these become larger contributors to many of these regional grids. Similar things occur daily, as both demand and solar production (and, to a lesser extent, wind) have distinct daily profiles.

The Golden State
California's CISO provides another instructive case. Imports represent less than 30% of its total electric use in 2016, yet California electricity imports provided 40% of its embodied emissions. Some of these, however, come internally from California, provided by the Los Angeles Department of Water and Power. The state itself, however, has only had limited tracking of imported emissions, lumping many of its sources as "other," and has been exporting its energy policies to Western states in ways that shape regional markets.

Overall, the 2016 inventory provides a narrow picture of the US grid, as plenty of trends are rapidly changing our country's emissions profile, including the rise of renewables and the widespread adoption of efficiency measures and other utility trends in 2017 that continue to evolve. The method developed here can, however, allow for annual updates, providing us with a much better picture of trends. That could be quite valuable to track things like how the rapid rise in solar power is altering the daily production of clean power.

More significantly, it provides a basis for more informed policymaking. States that wish to promote low-emissions power can use the information here to either alter the source of their imports or to encourage the sites where they're produced to adopt more renewable power. And those states that are exporting electricity produced primarily through fossil fuels could ensure that the locations where the power is used pay a price that includes the health costs of its production.


Related News

View more

Chinese-built electricity poles plant inaugurated in South Sudan

Juba Power Distribution Expansion accelerates grid rehabilitation in South Sudan, adding concrete poles, medium and low voltage networks, and LED street lighting, funded by AfDB and executed by Power China for reliable, affordable electricity.


Key Points

A project to upgrade Juba's grid with concrete poles, MV-LV networks, and LED lighting for reliable, affordable power.

✅ 13,350 concrete poles produced locally for network rollout

✅ Medium and low voltage network rehabilitation and expansion

✅ LED street lighting and customer care improvements funded by AfDB


The South Sudan government has launched a factory producing concrete poles that will facilitate an ambitious project done by a Chinese company to rehabilitate and expand the Power Distribution System in Juba, its capital.

The Minister of Dams and Electricity, Dhieu Mathok, said that the factory, rented by Power China, will produce some 13,350 poles for the electricity distribution in the capital and other states.

"The main objective of this project is to increase the supply capacity and reliability of the power distribution system in Juba. Access to the grid will replace the use of generators by the population, allow supply of energy at more affordable price and, hence contribute toward economic growth and poverty eradication in South Sudan," Mathok said during the inauguration of the plant along the Yei road in Juba.

#google#

He disclosed that it will help solve the problem associated with non-availability of concrete poles for the project and to mitigate the risk of importing poles from other countries.

"This factory will create positive impact on the construction of the national grid in South Sudan. It is owned by South Sudanese business people but currently it has been taken over by Power China for a brief period of one year," he said.

South Sudan is largely generator driven economy with continued electricity blackout, and across the continent initiatives like Cape Town's municipal power build-out illustrate alternative approaches, in the wake of the collapse of the generator power plant operated by the South Sudan Electricity Corporation (SSEC) in 2013.

Wang Cun, an official with Power China said they got the contract to build the electricity project in June 2016 and that they will continue to support South Sudanese staff with skills and knowledge, drawing on advances such as PEM green hydrogen R&D that point to future low-carbon options, and also work with the government on several major power projects.

"We have achieved much from these projects and we also suffered much from the instability and continuous conflicts all these years, but we confirm and believe the year of 2018 will be a year of peace and development in South Sudan," Wang said, adding that the company has been operating in South Sudan since 2009.

He disclosed that Power China has conducted several projects before South Sudan won independence from Sudan in 2011 such as the peace road project from Renk to Malakal, Maridi water plant and Malakal municipal road projects.

Wang said they will immediately reorganize all necessary resources to increase post-production capacity and immediately shall commence the erection of these poles to all corners of Juba city and start the distribution.

"We shall do as we did before to recruit more local technicians, engineers and laborers during the construction period, so that they are there in place for similar projects in the near future. We shall make more efforts to improve these local staffs' working environment and to realize sustainable development of Power China and Sino-hydro in South Sudan," said Wang.

Power China has been committing itself in the economic development of South Sudan and has signed eight commercial contracts with the government of South Sudan since independence like the Juba-hydro power project and the Tharjiath thermal power plant project, while in China projects such as the Lawa hydropower station demonstrate ongoing hydropower expertise that can inform regional work.

Liu Xiaodong, the Charge d'Affaires at the Chinese embassy in South Sudan, said Power China has been working very hard in the engineering and procurement in the earlier stage of the project, and as China expands energy ties such as nuclear cooperation with Cambodia that demonstrate broader engagement, also thanked the South Sudan government and the African Development Bank for their strong support.

Liu added upon completion Juba will have an upgraded power distribution system with 2,250 lighting points along the main roads in the capital and lamps will be LED ones.

The project falls under the Juba Power Distribution System Rehabilitation and Expansion Project, which was funded by the African Development Bank (AfDB) and has undertaken an AfDB review of a Senegal power plant to inform regional energy decisions.

It comprises of five different lots like Rehabilitation of Diesel plant substation, Rehabilitation and Expansion of medium voltage network, low voltage network, and Rehabilitation and Expansion of street lighting and improvement of customer care.


Related News

View more

Europe Stores Electricity in Natural Gas Pipes

Power-to-gas converts surplus renewable electricity into green hydrogen or synthetic methane via electrolysis and methanation, enabling seasonal energy storage, grid balancing, hydrogen injection into gas pipelines, and decarbonization of heat, transport, and industry.


Key Points

Power-to-gas turns excess renewable power into hydrogen or methane for storage, grid support, and clean fuel.

✅ Enables hydrogen injection into existing natural gas networks

✅ Balances grids and provides seasonal energy storage capacity

✅ Supplies low-carbon fuels for industry, heat, and heavy transport


Last month Denmark’s biggest energy firm, Ørsted, said wind farms it is proposing for the North Sea will convert some of their excess power into gas. Electricity flowing in from offshore will feed on-shore electrolysis plants that split water to produce clean-burning hydrogen, with oxygen as a by-product. That would supply a new set of customers who need energy, but not as electricity. And it would take some strain off of Europe’s power grid as it grapples with an ever-increasing share of hard-to-handle EU wind and solar output on the grid.

Turning clean electricity into energetic gases such as hydrogen or methane is an old idea that is making a comeback as renewable power generation surges and crowds out gas in Europe. That is because gases can be stockpiled within the natural gas distribution system to cover times of weak winds and sunlight. They can also provide concentrated energy to replace fossil fuels for vehicles and industries. Although many U.S. energy experts argue that this “power-to-gas” vision may be prohibitively expensive, some of Europe’s biggest industrial firms are buying in to the idea.

European power equipment manufacturers, anticipating a wave of renewable hydrogen projects such as Ørsted’s, vowed in January that, as countries push for hydrogen-ready power plants across Europe, all of their gas-fired turbines will be certified by next year to run on up to 20 percent hydrogen, which burns faster than methane-rich natural gas. The natural gas distributors, meanwhile, have said they will use hydrogen to help them fully de-carbonize Europe’s gas supplies by 2050.

Converting power to gas is picking up steam in Europe because the region has more consistent and aggressive climate policies and evolving electricity pricing frameworks that support integration. Most U.S. states have goals to clean up some fraction of their electricity supply; coal- and gas-fired plants contribute a little more than a quarter of U.S. greenhouse gas emissions. In contrast, European countries are counting on carbon reductions of 80 percent or more by midcentury—reductions that will require an economywide switch to low-carbon energy.

Cleaning up energy by stripping the carbon out of fossil fuels is costly. So is building massive new grid infrastructure, including transmission lines and huge batteries, amid persistent grid expansion woes in parts of Europe. Power-to-gas may be the cheapest way forward, complementing Germany’s net-zero roadmap to cut electricity costs by a third. “In order to reach the targets for climate protection, we need even more renewable energy. Green hydrogen is perceived as one of the most promising ways to make the energy transition happen,” says Armin Schnettler, head of energy and electronics research at Munich-based electric equipment giant Siemens.

Europe already has more than 45 demonstration projects to improve power-to-gas technologies and their integration with power grids and gas networks. The principal focus has been to make the electrolyzers that convert electricity to hydrogen more efficient, longer-lasting and cheaper to produce.

The projects are also scaling up the various technologies. Early installations converted a few hundred kilowatts of electricity, but manufacturers such as Siemens are now building equipment that can convert 10 megawatts, which would yield enough hydrogen each year to heat around 3,000 homes or fuel 100 buses, according to financial consultancy Ernst & Young.

The improvements have been most dramatic for proton-exchange membrane electrolyzers, which are akin to the fuel cells used in hydrogen vehicles (but optimized to produce hydrogen rather than consume it). The price of proton-exchange electrolyzers has dropped by roughly 40 percent during the past decade, according to a study published in February in Nature Energy. They are also five times more compact than older alkaline electrolysis plants, enabling onsite hydrogen production near gas consumers, and they can vary their power consumption within seconds to operate on fluctuating wind and solar generation.

Many European pilot projects are demonstrating “methanation” equipment that converts hydrogen to methane, too, which can be used as a drop-in replacement for natural gas. Europe’s electrolyzer plants, however, are showing that methanation is not as critical to the power-to-gas vision as advocates long believed. Many electrolyzers are injecting their hydrogen directly into natural gas pipelines—something that U.S. gas firms forbid—and they are doing so without impacting either the gas infrastructure or natural gas consumers.

Europe’s first large-scale hydrogen injection began in eastern Germany in 2013 at a two-megawatt electrolyzer installed by Essen-based power firm E.ON. Germany has since ratcheted up the amount of hydrogen it allows in natural gas lines from an initial 2 percent by volume to 10 percent, in a market where renewables now outpace coal and nuclear in Germany, and other European states have followed suit with their own hydrogen allowances. Christopher Hebling, head of hydrogen technologies at the Freiburg-based Fraunhofer Institute for Solar Energy Systems, predicts that such limits will rise to the 20-percent level anticipated by Europe’s turbine manufacturers.

Moving renewable hydrogen and methane via natural gas pipelines promises to cut the cost of switching to renewable energy. For example, gas networks have storage caverns whose reserves could be tapped to run gas-fired electric generation power plants during periods of low wind and solar output. Hebling notes that Germany’s gas network can store 240 terawatt-hours of energy—roughly 25 times more energy than global power grids can presently store by pumping water uphill to refill hydropower reservoirs. Repurposing gas infrastructure to help the power system could save European consumers 138 billion euros ($156 billion) by 2050, according to Dutch energy consultancy Navigant (formerly Ecofys).

For all the pilot plants and promise, renewable hydrogen presently supplies a tiny fraction of Europe’s gas. And, globally, around 4 percent of hydrogen is supplied via electrolysis, with the bulk refined from fossil fuels, according to the International Renewable Energy Agency.

Power-to-gas is catching up, however. According to the February Nature Energy study, renewable hydrogen already pays for itself in some niche applications, and further electrolyzer improvements will progressively extend its market. “If costs continue to decline as they have done in recent years, power-to-gas will become competitive at large scale within the next decade,” says study co-author Gunther Glenk, an economist at the Technical University of Munich.

Glenk says power-to-gas could scale up faster if governments guaranteed premium prices for renewable hydrogen and methane, as they did to mainstream solar and wind power.

Tim Calver, an energy storage researcher turned consultant and Ernst & Young’s executive director in London, agrees that European governments need to step up their support for power-to-gas projects and markets. Calver calls the scale of funding to date, “not proportionate to the challenge that we face on long-term decarbonization and the potential role of hydrogen.”


Related News

View more

BC Hydro Rates to Rise by 3.75% Over Two Years

British Columbia electricity rate increase will raise BC Hydro bills 3.75% over 2025-2026 to fund infrastructure, Site C, and clean energy, balancing affordability, reliability, and energy security while keeping prices below the North American average.


Key Points

BC will raise BC Hydro rates 3.75% in 2025-2026, about $3.75/month, to fund grid upgrades, Site C, and clean energy.

✅ 3.75% over 2025-2026; about $3.75/month on $100 average bill

✅ Funds Site C, grid maintenance, and clean energy capacity

✅ Keeps BC Hydro rates below North American averages


British Columbia's electricity rates will experience a 3.75% increase over the next two years, following an earlier 3% rate increase approval that set the stage, as confirmed by the provincial government on March 17, 2025. The announcement was made by Minister of Energy and Climate Solutions, Adrian Dix, who emphasized the decision's necessity for maintaining BC Hydro’s infrastructure while balancing affordability for residents.

For most households, the increase will amount to an additional $3.75 per month, based on an average BC Hydro bill of $100, though some coverage framed an earlier phase as a BC Hydro $2/month proposal that later evolved. While this may seem modest, the increase reflects a broader strategy to stabilize the utility's rates amidst economic challenges and ensure long-term energy security for the province.

Reasons Behind the Rate Hike

The rate increase comes during a period of rising costs in both global markets and local economies. According to Dix, the economic uncertainty stemming from trade dynamics and inflation has forced the government to act. Despite these pressures, and after a prior B.C. rate freeze to moderate impacts, the increase remains below cumulative inflation over the last several years, a move designed to shield consumers from the full force of these economic changes.

Dix also noted that, when adjusted for inflation, electricity rates in British Columbia in 2025 are effectively at the same price they were four decades ago. This stability, he argued, underscores the provincial government’s commitment to keeping rates as low as possible for residents, even as operating costs rise.

“We must take urgent action to protect British Columbians from the uncertainty posed by rising costs while building a strong, resilient electricity system for the long-term benefit of B.C.’s energy independence,” Dix said. He also highlighted the government's approach to minimizing the financial burden on consumers by keeping electricity costs well below the North American average.

Infrastructure and Maintenance Costs

The primary justification for the rate increase is to allow BC Hydro to continue its critical infrastructure development, including the Site C hydroelectric project, which is expected to become operational in the coming years. The increased costs of maintaining and upgrading the province's electricity grid also contribute to the need for higher rates.

The Site C project, a massive hydroelectric dam under construction on the Peace River, is expected to provide a substantial increase in clean, renewable energy capacity. However, such large-scale projects require significant investment and maintenance, both of which have contributed to the increased operating costs for BC Hydro.

A Strategic Move for Rate Stability

The provincial government has been clear that the rate increase will allow for a continuation of infrastructure development while keeping the rates manageable for consumers. The 3.75% increase will be spread across two years, with the first hike scheduled for April 1, 2025, reflecting the typical April rate changes BC Hydro implements, and the second for April 1, 2026.

Dix confirmed that the rate hike would still keep electricity costs among the lowest in North America, noting that British Columbians pay about half of what residents in Alberta pay for electricity. This is part of a broader effort by the provincial government to provide stable energy pricing while bolstering the transition to clean energy solutions, such as the Site C project and other renewable energy initiatives.

Addressing Public Concerns

Although the government has framed the increase as a necessary measure to ensure the province's long-term energy independence and reliability, the rate hikes are likely to face scrutiny from residents, particularly those already struggling with the rising cost of living, even as provinces like Ontario face their own Ontario hydro rate increase pressures this fall.

Public reactions to utility rate increases are often contentious, as residents feel the pressure of rising prices across various sectors, from housing to healthcare. However, the government has promised that the new rates will remain manageable, especially considering the relatively low rate increases compared to inflation and other regions where Manitoba Hydro scaled back a planned increase to temper impacts.

Furthermore, the increase comes as part of a broader strategy that aims to keep the overall impact on consumers as low as possible. Minister Dix emphasized that these rate increases were intended to ensure the continued reliability of BC Hydro’s services, without overwhelming ratepayers.

Long-Term Goals

Looking ahead, the province's strategy centers on not only maintaining affordable electricity rates but also reinforcing the importance of renewable energy, while some jurisdictions consider a 2.5% annual increase plan over multiple years to stabilize their grids. As climate change becomes an increasingly pressing issue, BC’s investments in clean energy projects like Site C aim to provide sustainable power for generations to come.

The government’s long-term vision involves building a resilient, energy-independent province that can weather future economic and environmental challenges. In this context, the rate increases are framed not just as a response to immediate inflationary pressures but as a necessary step in preparing BC’s energy infrastructure for the future.

The 3.75% rate increase set for 2025 and 2026 represents a balancing act between managing the financial health of BC Hydro and protecting consumers from higher costs. While the increase will have a modest effect on household bills, the long-term goal is to build a more robust and sustainable electricity system for British Columbia’s future. Through investments in clean energy and strategic infrastructure development, the province aims to keep electricity rates competitive while positioning itself as a leader in energy independence and climate action.


Related News

View more

Trudeau vows to regulate oil and gas emissions, electric car sales

Canada Oil and Gas Emissions Cap sets five-year targets to cut sector emissions toward net-zero by 2050, alongside an EV mandate, carbon pricing signals, and support for carbon capture, clean energy jobs, climate policy.


Key Points

A federal policy to regulate and reduce oil and gas emissions via 5-year targets, reaching net-zero by 2050.

✅ Regulated 5-year milestones to cut oil and gas emissions to net-zero by 2050

✅ Interim EV mandate: 50% by 2030; 100% zero-emission sales by 2035

✅ $2B fund for clean energy jobs in oil- and gas-reliant communities


Liberal Leader Justin Trudeau vowed to regulate total emissions from Canada’s oil and gas producers as he laid out his first major climate change promises of the campaign Sunday, a plan that was welcomed by several environmental and climate organizations.

Trudeau said that if re-elected, the Liberals will set out regulated five-year targets for emissions from oil and gas production to get them to net-zero emissions by 2050, a goal that, according to an IEA report will require more electricity, but also create a $2 billion fund to create jobs in oil and gas-reliant communities in Alberta, Saskatchewan and Newfoundland and Labrador.

“Let’s be realistic, over a quarter of Canada’s emissions come from our oil and gas sector. We need the leadership of these industries to decarbonize our country,” Trudeau said.

“That’s why we’ll make sure oil and gas emissions don’t increase and instead go down with achievable milestones,” while ensuring local economies can prosper.“

The Liberals are also introducing an interim electric vehicle mandate, which will require half the cars sold in Canada to be zero-emission by 2030, and because cleaning up electricity is critical to meeting climate pledges, the policy pairs with power-sector decarbonization, ahead of the final mandated target of 100 per cent by 2035.

Trudeau spoke in Cambridge, Ont., where protesters once again made an appearance amid a visible police presence. Officers carried one woman off the property when she refused to leave when asked.

Trudeau alluded to the protesters and their actions, which included sounding sirens and chanting expletives, as he defended his government’s record on climate change including progress in the electricity sector nationally, and touted its new plan.

“Sirens in the background may remind us that this is a climate emergency. That’s why we will move faster and be bolder,” he said.

Canada’s largest oilsands producers have already committed to reaching net zero greenhouse gas emissions by 2050, but the policy proposed Sunday “calls the oil companies’ bluff” by making those goals a legislated requirement, said Keith Stewart, senior energy strategist with Greenpeace Canada.

The new timeline for electric vehicles also “sends a clear signal to auto companies to get cracking (and build them here),” he said on Twitter, even as proposals like a fully renewable grid by 2030 are debated today. “We’d like to see this happen faster but the shift away from voluntary targets to requirements is big.”


Merran Smith, executive director of Clean Energy Canada, a climate program at Simon Fraser University, said clean electricity, clean transportation and “phasing out oil and gas with accountable milestones” must be key priorities over the next decade, aligning with Canada’s race to net-zero and the role of renewable energy.

“Today’s announcement, which checks all of these boxes, is not just good ambition_it’s good policy. Policy that will drive down carbon pollution and drive up clean job growth and economic competitiveness. It is policy that will drive Canada forward with cleaner cars, power Canada with clean electricity, and invest in businesses that will last such as battery manufacturing, electric vehicle manufacturing and low carbon steel,” Smith said in an email.

Michael Bernstein, executive director of the climate policy organization Clean Prosperity, said the promises laid out Sunday offer a “strong boost” to the federal government’s previous climate commitments.

He said the organization prefers market incentives such as carbon pricing, that spur innovation over further regulation. But since the largest oilsands companies have already committed to reaching net-zero emissions, he said the newly unveiled policy could provide some support.

“ First, I would encourage the Liberal Party to release independent modelling showing the types of emissions reductions they expect to achieve with their new package of policies. Second, many policies are referred to in general terms so I hope the Liberal Party will provide further details in the coming days,” he said.

“Finally, the document does not specifically mention carbon capture or carbon dioxide removal technologies but both technologies will be critical to achieve some of the pledges in today’s announcement, especially reaching net-zero emissions in the oil a gas sector.”

NDP Leader Jagmeet Singh painted the announcement as the latest in a string of “empty promises” from the Liberals on climate change, saying Canada has the highest increase in greenhouse gas emissions among all G7 countries, and that provinces like B.C. risk missing 2050 targets as well, he argued.

“Climate targets mean nothing when you don’t act on them. We can’t afford more of Justin Trudeau’s empty words on climate change,” he said in a statement.

The Trudeau Liberals submitted new targets to the United Nations in July, promising that Canada will curb emissions by 40 to 45 per cent from 2005 levels by 2030, building on the net-zero by 2050 plan announced earlier, officials say.


Related News

View more

Offshore wind is set to become a $1 trillion business

Offshore wind power accelerates low-carbon electrification, leveraging floating turbines, high capacity factors, HVDC transmission, and hydrogen production to decarbonize grids, cut CO2, and deliver competitive, reliable renewable energy near demand centers.


Key Points

Offshore wind power uses offshore turbines to deliver low-carbon electricity with high capacity factors and falling costs.

✅ Sea-based wind farms with 40-50% capacity factors

✅ Floating turbines unlock deep-water, far-shore resources

✅ Enables hydrogen production and strengthens grid reliability


The need for affordable low-carbon technologies is greater than ever

Global energy-related CO2 emissions reached a historic high in 2018, driven by an increase in coal use in the power sector. Despite impressive gains for renewables, fossil fuels still account for nearly two-thirds of electricity generation, the same share as 20 years ago. There are signs of a shift, with increasing pledges to decarbonise economies and tackle air pollution, and with World Bank support helping developing countries scale wind, but action needs to accelerate to meet sustainable energy goals. As electrification of the global energy system continues, the need for clean and affordable low-carbon technologies to produce this electricity is more pressing than ever. This World Energy Outlook special report offers a deep dive on a technology that today has a total capacity of 23 GW (80% of it in Europe) and accounts for only 0.3% of global electricity generation, but has the potential to become a mainstay of the world's power supply. The report provides the most comprehensive analysis to date of the global outlook for offshore wind, its contributions to electricity systems and its role in clean energy transitions.


The offshore wind market has been gaining momentum

The global offshore wind market grew nearly 30% per year between 2010 and 2018, benefitting from rapid technology improvements. Over the next five years, about 150 new offshore wind projects are scheduled to be completed around the world, pointing to an increasing role for offshore wind in power supplies. Europe has fostered the technology's development, led by the UK offshore wind sector alongside Germany and Denmark. The United Kingdom and Germany currently have the largest offshore wind capacity in operation, while Denmark produced 15% of its electricity from offshore wind in 2018. China added more capacity than any other country in 2018.


The untapped potential of offshore wind is vast

The best offshore wind sites could supply more than the total amount of electricity consumed worldwide today. And that would involve tapping only the sites close to shores. The IEA initiated a new geospatial analysis for this report to assess offshore wind technical potential country by country. The analysis was based on the latest global weather data on wind speed and quality while factoring in the newest turbine designs. Offshore wind's technical potential is 36 000 TWh per year for installations in water less than 60 metres deep and within 60 km from shore. Global electricity demand is currently 23 000 TWh. Moving further from shore and into deeper waters, floating turbines could unlock enough potential to meet the world's total electricity demand 11 times over in 2040. Our new geospatial analysis indicates that offshore wind alone could meet several times electricity demand in a number of countries, including in Europe, the United States and Japan. The industry is adapting various floating foundation technologies that have already been proven in the oil and gas sector. The first projects are under development and look to prove the feasibility and cost-effectiveness of floating offshore wind technologies.


Offshore wind's attributes are very promising for power systems

New offshore wind projects have capacity factors of 40-50%, as larger turbines and other technology improvements are helping to make the most of available wind resources. At these levels, offshore wind matches the capacity factors of gas- and coal-fired power plants in some regions – though offshore wind is not available at all times. Its capacity factors exceed those of onshore wind and are about double those of solar PV. Offshore wind output varies according to the strength of the wind, but its hourly variability is lower than that of solar PV. Offshore wind typically fluctuates within a narrower band, up to 20% from hour to hour, than solar PV, which varies up to 40%.

Offshore wind's high capacity factors and lower variability make its system value comparable to baseload technologies, placing it in a category of its own – a variable baseload technology. Offshore wind can generate electricity during all hours of the day and tends to produce more electricity in winter months in Europe, the United States and China, as well as during the monsoon season in India. These characteristics mean that offshore wind's system value is generally higher than that of its onshore counterpart and more stable over time than that of solar PV. Offshore wind also contributes to electricity security, with its high availability and seasonality patterns it is able to make a stronger contribution to system needs than other variable renewables. In doing so, offshore wind contributes to reducing CO2 and air pollutant emissions while also lowering the need for investment in dispatchable power plants. Offshore wind also has the advantage of avoiding many land use and social acceptance issues that other variable renewables are facing.


Offshore wind is on track to be a competitive source of electricity

Offshore wind is set to be competitive with fossil fuels within the next decade, as well as with other renewables including solar PV. The cost of offshore wind is declining and is set to fall further. Financing costs account for 35% to 50% of overall generation cost, and supportive policy frameworks are now enabling projects to secure low cost financing in Europe, with zero-subsidy tenders being awarded. Technology costs are also falling. The levelised cost of electricity produced by offshore wind is projected to decline by nearly 60% by 2040. Combined with its relatively high value to the system, this will make offshore wind one of the most competitive sources of electricity. In Europe, recent auctions indicate that offshore wind will soon beat new natural gas-fired capacity on cost and be on a par with solar PV and onshore wind. In China, offshore wind is set to become competitive with new coal-fired capacity around 2030 and be on par with solar PV and onshore wind. In the United States, recent project proposals indicate that offshore wind will soon be an affordable option, even as the 1 GW timeline continues to evolve, with potential to serve demand centres along the country's east coast.

Innovation is delivering deep cost reductions in offshore wind, and transmission costs will become increasingly important. The average upfront cost to build a 1 gigawatt offshore wind project, including transmission, was over $4 billion in 2018, but the cost is set to drop by more than 40% over the next decade. This overall decline is driven by a 60% reduction in the costs of turbines, foundations and their installation. Transmission accounts for around one-quarter of total offshore wind costs today, but its share in total costs is set to increase to about one-half as new projects move further from shore. Innovation in transmission, for example through work to expand the limits of direct current technologies, will be essential to support new projects without raising their overall costs.


Offshore wind is set to become a $1 trillion business

Offshore wind power capacity is set to increase by at least 15-fold worldwide by 2040, becoming a $1 trillion business. Under current investment plans and policies, the global offshore wind market is set to expand by 13% per year, reflecting its growth despite Covid-19 in recent years, passing 20 GW of additions per year by 2030. This will require capital spending of $840 billion over the next two decades, almost matching that for natural gas-fired or coal-fired capacity. Achieving global climate and sustainability goals would require faster growth: capacity additions would need to approach 40 GW per year in the 2030s, pushing cumulative investment to over $1.2 trillion. 

The promising outlook for offshore wind is underpinned by policy support in an increasing number of regions. Several European North Seas countries – including the United Kingdom, Germany, the Netherlands and Denmark – have policy targets supporting offshore wind. Although a relative newcomer to the technology, China is quickly building up its offshore wind industry, aiming to develop a project pipeline of 10 GW by 2020. In the United States, state-level targets and federal incentives are set to kick-start the U.S. offshore wind surge in the coming years. Additionally, policy targets are in place and projects under development in Korea, Japan, Chinese Taipei and Viet Nam.

 The synergies between offshore wind and offshore oil and gas activities provide new market opportunities. Since offshore energy operations share technologies and elements of their supply chains, oil and gas companies started investing in offshore wind projects many years ago. We estimate that about 40% of the full lifetime costs of an offshore wind project, including construction and maintenance, have significant synergies with the offshore oil and gas sector. That translates into a market opportunity of $400 billion or more in Europe and China over the next two decades. The construction of foundations and subsea structures offers potential crossover business, as do practices related to the maintenance and inspection of platforms. In addition to these opportunities, offshore oil and gas platforms require electricity that is often supplied by gas turbines or diesel engines, but that could be provided by nearby wind farms, thereby reducing CO2 emissions, air pollutants and costs.


Offshore wind can accelerate clean energy transitions

Offshore wind can help drive energy transitions by decarbonising electricity and by producing low-carbon fuels. Over the next two decades, its expansion could avoid between 5 billion and 7 billion tonnes of CO2 emissions from the power sector globally, while also reducing air pollution and enhancing energy security by reducing reliance on imported fuels. The European Union is poised to continue leading the wind energy at sea in Europe industry in support of its climate goals: its offshore wind capacity is set to increase by at least fourfold by 2030. This growth puts offshore wind on track to become the European Union's largest source of electricity in the 2040s. Beyond electricity, offshore wind's high capacity factors and falling costs makes it a good match to produce low-carbon hydrogen, a versatile product that could help decarbonise the buildings sector and some of the hardest to abate activities in industry and transport. For example, a 1 gigawatt offshore wind project could produce enough low-carbon hydrogen to heat about 250 000 homes. Rising demand for low-carbon hydrogen could also dramatically increase the market potential for offshore wind. Europe is looking to develop offshore "hubs" for producing electricity and clean hydrogen from offshore wind.


It's not all smooth sailing

Offshore wind faces several challenges that could slow its growth in established and emerging markets, but policy makers and regulators can clear the path ahead. Developing efficient supply chains is crucial for the offshore wind industry to deliver low-cost projects. Doing so is likely to call for multibillion-dollar investments in ever-larger support vessels and construction equipment. Such investment is especially difficult in the face of uncertainty. Governments can facilitate investment of this kind by establishing a long-term vision for offshore wind and by drawing on U.K. policy lessons to define the measures to be taken to help make that vision a reality. Long-term clarity would also enable effective system integration of offshore wind, including system planning to ensure reliability during periods of low wind availability.

The success of offshore wind depends on developing onshore grid infrastructure. Whether the responsibility for developing offshore transmission lies with project developers or transmission system operators, regulations should encourage efficient planning and design practices that support the long-term vision for offshore wind. Those regulations should recognise that the development of onshore grid infrastructure is essential to the efficient integration of power production from offshore wind. Without appropriate grid reinforcements and expansion, there is a risk of large amounts of offshore wind power going unused, and opportunities for further expansion could be stifled. Development could also be slowed by marine planning practices, regulations for awarding development rights and public acceptance issues.

The future of offshore wind looks bright but hinges on the right policies

The outlook for offshore wind is very positive as efforts to decarbonise and reduce local pollution accelerate. While offshore wind provides just 0.3% of global electricity supply today, it has vast potential around the world and an important role to play in the broader energy system. Offshore wind can drive down CO2 emissions and air pollutants from electricity generation. It can also do so in other sectors through the production of clean hydrogen and related fuels. The high system value of offshore wind offers advantages that make a strong case for its role alongside other renewables and low-carbon technologies. Government policies will continue to play a critical role in the future of offshore wind and  the overall pace of clean energy transitions around the world.


Related News

View more

Sign Up for Electricity Forum’s Newsletter

Stay informed with our FREE Newsletter — get the latest news, breakthrough technologies, and expert insights, delivered straight to your inbox.

Electricity Today T&D Magazine Subscribe for FREE

Stay informed with the latest T&D policies and technologies.
  • Timely insights from industry experts
  • Practical solutions T&D engineers
  • Free access to every issue

Download the 2025 Electrical Training Catalog

Explore 50+ live, expert-led electrical training courses –

  • Interactive
  • Flexible
  • CEU-cerified