Enegix Base One Green Hydrogen Plant will produce renewable hydrogen via electrolysis in Ceara, Brazil, leveraging 3.4 GW baseload renewables, offshore wind, and hydro to scale clean energy, storage, and export logistics.
Key Points
A $5.4bn Ceara, Brazil project to produce 600m kg of green hydrogen annually using 3.4 GW of baseload renewables.
✅ 3.4 GW baseload from hydro and offshore wind pipelines
✅ Targets 600m kg green hydrogen per year via electrolysis
✅ Focus on storage, transport, and export supply chains
In March, Enegix Energy announced some of the most ambitious hydrogen plans the world has ever seen. The company signed a memorandum of understanding (MOU) with the government of the Brazilian state of Ceará to build the world’s largest green hydrogen plant in the state on the country’s north-eastern coast, and the figures are staggering.
The Base One facility will produce more than 600 million kilograms of green hydrogen annually from 3.4GW of baseload renewable energy, and receive $5.4bn in investment to get the project off the ground and producing within four years.
Green hydrogen, hydrogen produced by electrolysis that is powered by renewables, has significant potential as a clean energy source. Already seeing increased usage in the transport sector, the power source boasts the energy efficiency and the environmental viability to be a cornerstone of the world’s energy mix.
Yet practical challenges have often derailed large-scale green hydrogen projects, from the inherent obstacle of requiring separate renewable power facilities to the logistical and technological challenges of storing and transporting hydrogen. Could vast investment, clever planning, and supportive governments and programs like the DOE’s hydrogen hubs initiative help Enegix to deliver on green hydrogen’s oft-touted potential?
Brazilian billions
The Base One project is exceptional not only for its huge scale, but the timing of its construction, with demand for hydrogen set to increase dramatically over the next few decades. Figures from Wood Mackenzie suggest that hydrogen could account for 1.4 billion tonnes of energy demand by 2050, one-tenth of the world’s supply, with green hydrogen set to be the majority of this figure.
Yet considering that, prior to the announcement of the Enegix project, global green hydrogen capacity was just 94MW, advances in offshore green hydrogen and the development of a project of this size and scope could scale up the role of green hydrogen by orders of magnitude.
“We really need to [advance clean energy] without any emissions on a completely clean, carbon neutral and net-zero framework, and so we needed access to a large amount of green energy projects,” explains Wesley Cooke, founder and CEO of Enegix, a goal aligned with analyses that zero-emissions electricity by 2035 is possible, discussing the motivation behind the vast project.
With these ambitious goals in mind, the company needed to find a region with a particular combination of political will and environmental traits to enable such a project to take off.
“When we looked at all of these key things: pipeline for renewables, access to water, cost of renewables, and appetite for renewables, Brazil really stood out to us,” Cooke continues. “The state of Ceará, that we’ve got an MOU with the government in at the moment, ticks all of these boxes.”
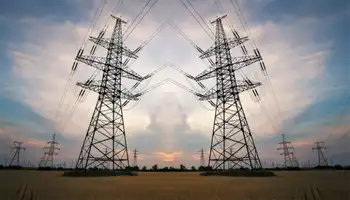
Ceará’s own clean energy plans align with Enegix’s, at least in terms of their ambition and desire for short-term development. Last October, the state announced that it plans to add 5GW of new offshore wind capacity in the next five years. With BI Energia alone providing $2.5bn in investment for its 1.2GW Camocim wind facility, there is significant financial muscle behind these lofty ambitions.
“One thing I should add is that Brazil is very blessed when it comes to baseload renewables,” says Cooke. “They have an incredibly high percentage of their country-wide energy that comes from renewable sources and a lot of this is in part due to the vast hydro schemes that they have for hydro dams. Not a lot of countries have that, and specifically when you’re trying to produce hydrogen, having access to vast amounts of renewables [is vital].”
Changing perceptions and tackling challenges
This combination of vast investment and integration with the existing renewable power infrastructure of Ceará could have cultural impacts too. The combination of state support for and private investment in clean energy offsets many of the narratives emerging from Brazil concerning its energy policies and environmental protections, even as debates over clean energy's trade-offs persist in Brazil and beyond, from the infamous Brumadinho disaster to widespread allegations of illegal deforestation and gold mining.
“I can’t speak for the whole of Brazil, but if we look at Ceará specifically, and even from what we’ve seen from a federal government standpoint, they have been talking about a hydrogen roadmap for Brazil for quite some time now,” says Cooke, highlighting the state’s long-standing support for green hydrogen. “I think we came in at the perfect time with a very solid plan for what we wanted to do, [and] we’ve had nothing but great cooperation, and even further than just cooperation, excitement around the MOU.”
This narrative shift could help overcome one of the key challenges facing many hydrogen projects, the idea that its practical difficulties render it fundamentally unsuitable for baseload power generation. By establishing a large-scale green hydrogen facility in a country that has recently struggled to present itself as one that is invested in renewables, the Base One facility could be the ultimate proof that such clean hydrogen projects are viable.
Nevertheless, practical challenges remain, as is the case with any energy project of this scale. Cooke mentions a number of solutions to two of the obstacles facing hydrogen production around the world: renewable energy storage and transportation of the material.
“We were looking at compressed hydrogen via specialised tankers [and] we were looking at liquefied hydrogen, [as] you have to get liquefied hydrogen very cool to around -253°, and you can use 30% to 40% of your total energy that you started with just to get it down to that temperature,” Cooke explains.
“The other aspect is that if you’re transporting this internationally, you really have to think about the supply chain. If you land in a country like Indonesia, that’s wonderful, but how do you get it from Indonesia to the customers that need it? What is the supply chain? What does that look like? Does it exist today?”
The future of green hydrogen
These practical challenges present something of a chicken and egg problem for the future of green hydrogen: considerable up-front investment is required for functions such as storage and transport, but the difficulties of these functions can scare off investors and make such investments uncommon.
Yet with the world’s environmental situation increasingly dire, more dramatic, and indeed risky, moves are needed to alter its energy mix, and Enegix is one company taking responsibility and accepting these risks.
“We need to have the renewables to match the dirty fuel types,” Cooke says. “This [investment] will really come from the decisions that are being made right now by large-scale companies, multi-billion-euro-per-year revenue companies, committing to building out large scale factories in Europe and Asia, to support PEM [hydrolysis].”
This idea of large-scale green hydrogen is also highly ambitious, considering the current state of the energy source. The International Renewable Energy Agency reports that around 95% of hydrogen comes from fossil fuels, so hydrogen has a long ways to go to clean up its own carbon footprint before going on to displace fossil fuel-driven industries.
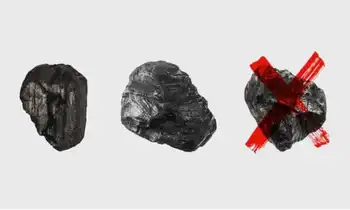
Yet this displacement is exactly what Enegix is targeting. Cooke notes that the ultimate goal of Enegix is not simply to increase hydrogen production for use in a single industry, such as clean vehicles. Instead, the idea is to develop green hydrogen infrastructure to the point where it can replace coal and oil as a source of baseload power, leapfrogging other renewables to form the bedrock of the world’s future energy mix.
“The problem with [renewable] baseload is that they’re intermittent; the wind’s not always blowing and the sun’s not always shining and batteries are still very expensive, although that is changing. When you put those projects together and look at the levelised cost of energy, this creates a chasm, really, for baseload.
“And for us, this is really where we believe that hydrogen needs to be thought of in more detail and this is what we’re really evangelising about at the moment.”
A more hydrogen-reliant energy mix could also bring social benefits, with Cooke suggesting that the same traits that make hydrogen unwieldy in countries with established energy infrastructures could make hydrogen more practically viable in other parts of the world.
“When you look at emerging markets and developing markets at the moment, the power infrastructure in some cases can be quite messy,” Cooke says. “You’ve got the potential for either paying for the power or extending your transmission grid, but rarely being able to do both of those.
“I think being able to do that last mile piece, utilising liquid organic hydrogen carrier as an energy vector that’s very cost-effective, very scalable, non-toxic, and non-flammable; [you can] get that power where you need it.
“We believe hydrogen has the potential to be very cost-effective at scale, supporting a vision of cheap, abundant electricity over time, but also very modular and usable in many different use cases.”
Related News