Substation Relay Protection Training
Our customized live online or in‑person group training can be delivered to your staff at your location.

- Live Online
- 12 hours Instructor-led
- Group Training Available
Regular Price:
$699
Coupon Price:
$599
WASHINGTON
—
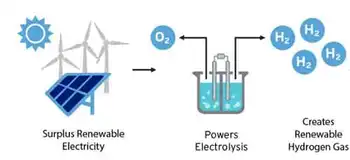
U.S. Clean Hydrogen Hubs aim to scale production, storage, transport, and use as DOE and the Biden administration fund regional projects under the infrastructure law, blending green and blue hydrogen, carbon capture, renewables, and pipelines.
The Situation Explained
Federally funded regional projects to make, move, and use low-carbon hydrogen via green, blue, and pink routes.
$7B DOE funding via infrastructure law
Mix of green, blue, pink hydrogen pathways
Targets 10M metric tons annually by 2030
New details are emerging about the Biden administration’s landmark plans to build out a U.S. clean hydrogen industry.
On Friday, the Department of Energy named the seven winners of $7 billion in federal funds to establish regional hydrogen hubs. The hubs — funded through the infrastructure law — are part of the administration’s efforts to jump-start an industry it sees as key to achieving climate goals like the goal of 100 percent clean electricity by 2035 set by the administration. The aim is to demonstrate everything from the production and storage of hydrogen to its transport and consumption.
“All across the country, from coast to coast, in the heartland, we’re building a clean energy future here in America, not somewhere else,” President Joe Biden said while announcing the hubs in Philadelphia.
From 79 initial proposals, DOE chose the following: the Mid-Atlantic Hydrogen Hub, Appalachian Hydrogen Hub, California Hydrogen Hub, Gulf Coast Hydrogen Hub, Heartland Hydrogen Hub, Midwest Hydrogen Hub and Pacific Northwest Hydrogen Hub.
Many of the winning proposals are backed by state government leaders and industry partners, and by Southeast cities that have ramped up clean energy purchases in recent years as well. The Midwest hub, for example, is a coalition of Illinois, Indiana and Michigan — supported by politicians like Illinois Gov. J.B. Pritzker (D), as well as such companies as Air Liquide, Ameren Illinois and Atlas Agro. The mid-Atlantic hub is supported by Democratic members of Congress representing the region, including Delaware Sens. Chris Coons and Tom Carper and Rep. Lisa Blunt Rochester.
The administration hopes the hubs will produce 10 million metric tons of “clean” hydrogen annually by 2030. But much about the projects remains unknown — including how trends like cheap batteries for solar could affect clean power supply — and dependent on negotiations with DOE.
A win for ‘blue’ hydrogen?
Nearly all hydrogen created in the U.S. today is extracted from natural gas through steam methane reformation. The emissions-intensive process produces what is known as “grey” hydrogen — or “blue” hydrogen when combined with carbon capture and storage.
Four recipients — the Appalachian, Gulf Coast, Heartland and Midwest hydrogen hubs — include blue hydrogen in their plans, though the infrastructure law only mandated one.
That has drawn the ire of environmentalists, who argue blue hydrogen is not emissions-free, partly because of the potential for methane leaks during the production process.
“This is worse than expected,” Clean Energy Group President Seth Mullendore said after the recipients were announced Friday. “The fact that more than half the hubs will be using fossil gas is outrageous.”
Critics have also pointed out that many of the industry partners backing the hub projects include oil and gas companies. The coalitions are a mix of private-sector groups — often including renewable energy developers — and government stakeholders. Proposals have also looped in universities, utilities, environmental groups, community organizations, labor unions and tribal nations, among others.
“The massive build out of hydrogen infrastructure is little more than an industry ploy to rebrand fracked gas,” said Food & Water Watch Policy Director Jim Walsh in a statement Friday. “In a moment when every political decision that we make must reject fossil expansion, the Biden administration is going in the opposite direction.”
The White House has emphasized that roughly two-thirds of the $7 billion pot is “associated” with the production of “green” hydrogen, which uses electricity from renewable sources. Two of the chosen proposals — in California and the Pacific Northwest — are making green hydrogen their focus, reflecting advances such as offshore green hydrogen being pursued by industry leaders, while three other hubs plan to include green hydrogen alongside hydrogen made with natural gas (blue) or nuclear energy (pink).
Many hubs plan to use several methods for hydrogen production, and globally, projects like Brazil's green hydrogen plant highlight the scale of investment, but the exact mix may change depending on which projects make it through the DOE negotiations process. The Midwest hub, for example, told E&E News it’s pursuing an “all-of-the-above” strategy and has projects for green, blue and “pink” hydrogen. The mid-Atlantic hub in southeastern Pennsylvania, Delaware and New Jersey will also generate hydrogen with nuclear reactors.
Energy Secretary Jennifer Granholm has described clean hydrogen as a fresh business opportunity, especially for the natural gas industry, which has supported the concept of sending hydrogen to market through its pipeline network. Lawmakers like Sen. Joe Manchin (D-W.Va.) — who said the Appalachian hub will make West Virginia the “new epicenter of hydrogen” — have pushed for continuing to use natural gas to make hydrogen in his state.
“Natural gas utilities are committed to exploring all options for emissions reduction as demonstrated by the 39 hydrogen pilot projects already underway and are eager to participate in a number of the hubs,” said American Gas Association President and CEO Karen Harbert in a statement Friday.


Green hydrogen also has faced criticism. Some groups argue that the renewable resources needed to produce green hydrogen are limited, even with sources such as wind, solar and hydropower technology, so funding should be reserved for applications that cannot be easily electrified, mostly industrial processes. There also is uncertainty about how the Treasury Department will handle hydrogen made from grid electricity — which can include power from fossil fuel plants — in its upcoming guidance on the first-ever tax credit for clean hydrogen production.
“Even the cleanest forms of hydrogen present serious problems,” Walsh said. “As groundwater sources are drying up across the country, there is no reason to waste precious drinking water resources on hydrogen when there are cheaper, cleaner energy sources that can facilitate a real transition off fossil fuels.”
But Angelina Galiteva, CEO of the hub in drought-prone California, said hydrogen will enable the state “to increase renewable penetration to reach all corners of the economy,” noting parallel initiatives such as Dubai's solar hydrogen plans that illustrate the potential.
“Transitioning to renewable clean hydrogen will pose significantly less stress on water resources than remaining on the current fossil path,” she said.
Related News
Related News
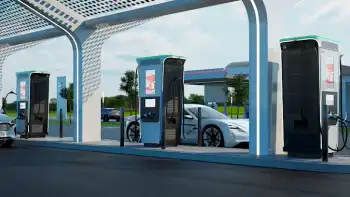
ABB claims its Terra 360 is the "world's fastest electric car charger"
ABB Terra 360 EV Charger offers 360 kW DC fast charging, ultra-fast top-ups, and multi-vehicle…
View more
Rhode Island issues its plan to achieve 100% renewable electricity by 2030
Rhode Island 100% Renewable Electricity by 2030 outlines pathways via offshore wind, retail solar, RECs,…
View more
Electric vehicles can fight climate change, but they’re not a silver bullet: U of T study
EV Adoption Limits highlight that electric vehicles alone cannot meet emissions targets; life cycle assessment,…
View more

UK Renewable energy projects worth billions stuck on hold
UK Renewable Grid Connection Delays threaten the 2035 zero-carbon electricity target as National Grid queues…
View more

Vancouver seaplane airline completes first point-to-point flight with prototype electric aircraft
Harbour Air Electric Seaplane completes a point-to-point test flight, showcasing electric aircraft innovation, zero-emission short-haul…
View more

Harbour Air's electric aircraft a high-flying example of research investment
Harbour Air Electric Aircraft Project advances zero-emission aviation with CleanBC Go Electric ARC funding, converting…
View more
Sign Up for Electricity Forum’s Newsletter
Stay informed with our FREE Newsletter — get the latest news, breakthrough technologies, and expert insights, delivered straight to your inbox.
Electricity Today T&D Magazine Subscribe for FREE

Stay informed with the latest T&D policies and technologies.
- Timely insights from industry experts
- Practical solutions T&D engineers
- Free access to every issue

