Spain seeks big fines over nuclear plant leak

By International Herald Tribune


NFPA 70b Training - Electrical Maintenance

Our customized live online or in‑person group training can be delivered to your staff at your location.

  • Live Online
  • 12 hours Instructor-led
  • Group Training Available
Regular Price:
$599
Coupon Price:
$499
Reserve Your Seat Today
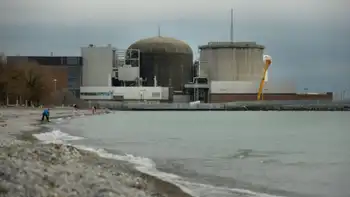
Spain's nuclear watchdog agency proposed a fine of up to €22.5 million (US$33 million) over a leak at a power plant, accusing operators of waiting three weeks to report it and downplaying the amount of contamination released.

The riverside Asco plant experienced a leak in November, but plant operators did not detect it until March and then waited to notify regulators on April 4, according to the Nuclear Safety Council.

The agency said the risk to humans and the environment was minimal, but that the plant's operators had nonetheless violated monitoring and incident-reporting rules.

It also said Asco, owned by utility Endesa, had grossly underreported the amount of contamination released.

The agency proposed six sanctions against the plant, which is located on the Ebro River, 44 miles (28 kilometers) upstream from the Mediterranean.

It is up to the Industry Ministry will decide whether to fine the company, and if so how much. The punishment could total €22.5 million (US$33 million).

In April, the council upgraded its classification of the leak from Level 1, the lowest on a scale of one to seven, to Level 2.

Spain has seven nuclear power plants operating. The Socialist government says it will let them run until their licenses expire, then decommission them.

Related News

Perry presses ahead on advanced nuclear reactors

Advanced Nuclear Reactors drive U.S. clean energy with small modular reactors, a new test facility at Idaho National Laboratory, and public-private partnerships accelerating nuclear innovation, safety, and cost reductions through DOE-backed programs and university simulators.


Key Points

Advanced nuclear reactors are next-gen designs, including SMRs, offering safer, cheaper, low-carbon power.

✅ DOE test facility at Idaho National Laboratory

✅ Small modular reactors with passive safety systems

✅ University simulators train next-gen nuclear operators


Energy Secretary Rick Perry is advancing plans to shift the United States towards next-gen nuclear power reactors.

The Energy Department announced this week it has launched a new test facility at the Idaho National Laboratory where private companies can work on advanced nuclear technologies, as the first new U.S. reactor in nearly seven years starts up, to avoid the high costs and waste and safety concerns facing traditional nuclear power plants.

“[The National Reactor Innovation Center] will enable the demonstration and deployment of advanced reactors that will define the future of nuclear energy,” Perry said.

With climate change concerns growing and net-zero emissions targets emerging, some Republicans and Democrats are arguing for the need for more nuclear reactors to feed the nation’s electricity demand. But despite nuclear plants’ absence of carbon emissions, the high cost of construction, questions around what to do with the spent nuclear rods and the possibility of meltdown have stymied efforts.

A new generation of firms, including Microsoft founder Bill Gates’ Terra Power venture, are working on developing smaller, less expensive reactors that do not carry a risk of meltdown.

“The U.S. is on the verge of commercializing groundbreaking nuclear innovation, and we must keep advancing the public-private partnerships needed to traverse the dreaded valley of death that all too often stifles progress,” said Rich Powell, executive director of ClearPath, a non-profit advocating for clean energy and green industrial strategies worldwide.

The new Idaho facility is budgeted at $5 million under next year’s federal budget, even as the cost of U.S. nuclear generation has fallen to a ten-year low, which remains under negotiation in Congress.

On Thursday another advanced nuclear developer working on small modular systems, Oregon-based NuScale Power, announced it was building three virtual nuclear control rooms at Texas A&M University, Oregon State University and the University of Idaho, with funding from the Energy Department.

The simulators will be open to researchers and students, to train on the operation of smaller, modular reactors, as well as the general public.

NuScale CEO John Hopkins said the simulators would “help ensure that we educate future generations about the important role nuclear power and small modular reactor technology will play in attaining a safe, clean and secure energy future for our country.”


Related News

View more

Maritime Electric team works on cleanup in Turks and Caicos

Maritime Electric Hurricane Irma Response details utility crews aiding Turks and Caicos with power restoration, storm recovery, debris removal, and essential services, coordinated with Fortis Inc., despite limited equipment, heat, and over 1,000 downed poles.


Key Points

A utility mission restoring power and essential services in Turks and Caicos after Irma, led by Maritime Electric.

✅ Over 1,000 poles down; crews climbing without bucket trucks

✅ Restoring hospitals, water, and communications first

✅ Fortis Inc. coordination; 2-3 week deployment with follow-on crews


Maritime Electric has sent a crew to help in the clean up and power restoration of Turks and Caicos after the Caribbean island was hit by Hurricane Irma, a storm that also saw FPL's massive response across Florida.

They arrived earlier this week and are working on removing debris and equipment so when supplies arrive, power can be brought back online, and similar mutual aid deployments, including Canadian crews to Florida, have been underway as well.

Fortis Inc., the parent company for Maritime Electric operates a utility in Turks and Caicos.

Kim Griffin, spokesperson for Maritime Electric, said there are over 1000 poles that were brought down by the storm, mirroring Florida restoration timelines reported elsewhere.

"It's really an intense storm recovery," she said. 'Good spirits'

The crew is working with less heavy equipment than they are used to, climbing poles instead of using bucket trucks, in hot and humid weather.

Griffin said their focus is getting essential services restored as quckly as possible, similar to progress in Puerto Rico's restoration efforts following recent hurricanes.

The crew will be there for two or three weeks and Griffin said Maritime Electric may send another group, as seen with Ontario's deployment to Florida, to continue the job.

She said the team has been well received and is in "good spirits."

"The people around them have been very positive that they're there," she said.

"They've said it's just been overwhelming how kind and generous the people have been to them."


Related News

View more

In a record year for clean energy purchases, Southeast cities stand out

Municipal Renewable Energy Procurement surged as cities contracted 3.7 GW of solar and wind, leveraging green tariffs, community solar, and utility partnerships across the Southeast, led by Houston, RMI, and WRI data.


Key Points

The process by which cities contract solar and wind via utilities or green tariffs to meet climate goals.

✅ 3.7 GW procured in 2020, nearly 25% year-over-year growth

✅ Houston runs city ops on 500 MW solar, a record purchase

✅ Southeast cities use green tariffs and community solar


Cities around the country bought more renewable energy last year than ever before, reflecting how renewables may soon provide one-fourth of U.S. electricity across the grid, with some of the most remarkable projects in the Southeast, according to new data unveiled Thursday.

Even amid the pandemic, about eight dozen municipalities contracted to buy nearly 3.7 gigawatts of mostly solar and wind energy — enough to power more than 800,000 homes. The figure is almost a quarter higher than the year before.

Half of the cites listed as “most noteworthy” in Thursday’s release —  from research groups Rocky Mountain Institute and World Resources Institute — are in the region that stretches from Texas to Washington, D.C. 

Houston stands out for the sheer enormity of its purchase: In July, it began powering city operations entirely from nearly 500 megawatts of solar power — the largest municipal purchase of renewable energy ever in the United States, as renewable electricity surpassed coal nationwide.

The groups also feature smaller deals in North Carolina and Tennessee, achieved through a utility partnership called a green tariff.

“We wanted to recognize that Nashville and Charlotte were really blazing a new trail,” said Stephen Abbott, principal at the Rocky Mountain Institute.

And the nation’s capital shows how renewable energy can be a source of revenue: It’s leasing out its public transit station rooftops for 10 megawatts of community solar.

All of these strategies will be necessary for scores of U.S. cities to meet their ambitious climate goals, researchers believe. An interactive clean energy targets tracker shows all 95 clean energy procurements from the year in detail.


Tracker 
Even before former President Donald Trump promised to remove the United States from the Paris Climate Accord, a lack of federal action on climate left a void that some cities and counties were beginning to fill, as renewables hit a record 28% in a recent month. In 2015, the first year tracked by researchers at the Rocky Mountain Institute and the World Resources Institute, municipalities contracted to buy more than 1 gigawatt of wind, solar and other forms of clean energy. 

But when Trump officially set in motion the withdrawal from the climate agreement, the ranks of municipalities dedicated to 100% clean energy multiplied. Today there are nearly 200 of them. The growth in activity last year reflects, in part, that surge of new pledges.

“It takes a while to get city staff up to speed and understand the options, and create the roadmap and then start executing,” Abbott said. “There is a bit of a lag, but we’re starting to see the impact.”

Even in Houston — one of the earliest to begin procuring renewable energy — there has been a steep learning curve as market forces change and prices drop, including cheaper solar batteries shaping procurement strategies, said Lara Cottingham, Houston’s chief of staff and chief sustainability officer.

No matter how well resourced and educated their staff, cities have to clear a thicket of structural, political and economic challenges to procure renewable energy. Most don’t own their own sources of power. Nearly all face budget constraints. Few have enough land or government rooftops to meet their goals within city limits.

“Cities face a situation where it’s a square peg in a round hole,” Cottingham said.

The hurdles are especially steep in much of the Southeast, where only publicly regulated utilities can sell electricity to retail customers, even large ones such as major cities. That’s where a green tariff regime comes in: Cities can purchase clean energy from a third party, such as a solar company, using the utility as a go-between.

Early last year, Charlotte became the largest city to use such a program, partnering with Duke Energy and two North Carolina solar developers to build a solar farm 50 miles north in Iredell County. At first, the city will pay a premium for the energy, but in the latter half of the 20-year contract, as gas prices rise, it will save money compared to business as usual.

“Over the course of 20 years, it’s projected we would save about $2 million,” Katie Riddle, sustainability analyst with Charlotte, told the Energy News Network last year.

The growing size of projects, innovative partnerships like green tariff programs, and the improving economics all give Abbott hope that renewable energy investments from cities will only grow — even with the Trump presidency over and the country back in the Paris agreement.

And when cities meet their goals for procuring renewable energy for their own operations, they must then turn to an even bigger task: reducing the carbon footprint of every person in their jurisdiction with broader decarbonization strategies and community engagement.

“The city needs to do its part for sure,” said Houston’s Cottingham. “Then we have this challenge of how do we get everyone else to.”


Related News

View more

A resilient Germany is weathering the energy crunch

German Energy Price Brakes harness price signals in a market-based policy, cutting gas consumption, preserving industrial output, and supporting CO2 reduction, showcasing Germany's resilience and adaptation while protecting households and businesses across Europe.


Key Points

Fixed-amount subsidies preserving price signals to curb gas use, shield consumers, and sustain industrial output.

✅ Maintains incentives via market-based price signals

✅ Cuts gas consumption without distorting EU markets

✅ Protects households and industry while curbing CO2


German industry and society are once again proving much more resilient and adaptable than certain people feared. Horror scenarios of a dangerous energy rationing or a massive slump in our economy have often been bandied about. But we are nowhere near that. With a challenging year just behind us, this is good news — not only for Germany, but also for Europe, where France-Germany energy cooperation has strengthened solidarity.

Companies and households reacted swiftly to the sharp increases in energy prices, in line with momentum in the global energy transition seen across markets. They installed more efficient heating or production facilities, switched to alternatives and imported intermediate products. The results are encouraging: German households and businesses have reduced gas consumption significantly, despite recent cold weather. From the start of the war in Ukraine to mid-December industrial gas consumption in Germany was (temperature-adjusted) around 20 per cent lower than the average level for the preceding three years. Even if some firms have cut back production, especially in energy-intensive sectors, industrial output as a whole has only fallen by about 1 per cent since the start of 2022. Added to this, in a survey released by the Ifo institute in November, over a third of German companies saw the potential to reduce gas consumption further without endangering output.

Instead of imposing excessive laws and regulations, we have relied on price signals and the prudence of market participants to create the right incentives and reduce gas consumption, as falling costs like record-low solar power prices continue to reinforce those signals across sectors.

We will follow this approach in coming months, when energy savings will remain important, even as the EU electricity outlook anticipates sharply higher demand by 2050. Our latest relief measures will not distort price signals. To this end, the Bundestag approved gas and electricity price brakes in its final session in 2022. They are designed to function without any intervention in markets or prices. This system will pay out a fixed amount relative to previous years’ consumption and the current difference to a reference price — regardless of current consumption.

Energy price brakes are the main component of Germany’s “protective shield”, which makes up to €200bn available for measures in 2022 to 2024. Seen in relation to the German economy’s size, its past heavy reliance on Russian energy imports and the fact that the measures will expire in 2024, these are balanced and expedient mechanisms. In contrast to instruments used in other countries, our new arrangements will not affect the price formation process driven by supply and demand, or on incentives to save gas. Companies and households will continue to save the full market price when they reduce consumption by a unit of gas or electricity. In this way, the price brakes also avoid the creation of additional demand for gas at the expense of consumers in other European countries, even as Europe’s Big Oil turning electric signals broader structural shifts in energy markets. No one need fear that competition will be distorted or that gas will be bought up. Indeed, a recent IMF working paper on cushioning the impact of high energy prices on households explicitly praises the German energy price brakes.

Current developments confirm the effectiveness of a market-based approach — and show that we should also rely on price signals when it comes to reducing CO₂ emissions, as suggested by IEA CO2 trends in recent years. Last year, households and companies had only a few weeks to adapt, yet we have already seen a strong response. The effect of CO₂ prices can be even stronger, as adaptation is possible over a much longer time and they additionally affect expectations and long-term decisions. Regulatory interventions and subsidy schemes, even if well targeted, cannot compete with market co-ordination and incentives that support individual decision-making and promote innovation.

Europe and Germany can weather this crisis without a collapse in industrial production. We also have an opportunity to deal efficiently with the move to climate neutrality, aligned with Germany’s hydrogen strategy for imported low-carbon fuels. In both cases, we should have confidence in price signals as well as in the power of people and business to innovate and adapt.


Related News

View more

How Energy Use Has Evolved Throughout U.S. History

U.S. Energy Transition traces the shift from coal and oil to natural gas, nuclear power, and renewables like wind and solar, driven by efficiency, grid modernization, climate goals, and economic innovation.


Key Points

The U.S. Energy Transition is the shift from fossil fuels to cleaner power, driven by tech, policy, and markets.

✅ Shift from coal and oil to gas, nuclear, wind, and solar

✅ Enabled by grid modernization, storage, and efficiency

✅ Aims to cut emissions while ensuring reliability and affordability


The evolution of energy use in the United States is a dynamic narrative that reflects technological advancements, economic shifts, environmental awareness, and societal changes over time. From the nation's early reliance on wood and coal to the modern era dominated by oil, natural gas, and renewable sources, the story of energy consumption in the U.S. is a testament to innovation and adaptation.

Early Energy Sources: Wood and Coal

In the early days of U.S. history, energy needs were primarily met through renewable resources such as wood for heating and cooking. As industrialization took hold in the 19th century, coal emerged as a dominant energy source, fueling steam engines and powering factories, railways, and urban growth. The widespread availability of coal spurred economic development and shaped the nation's infrastructure.

The Rise of Petroleum and Natural Gas

The discovery and commercialization of petroleum in the late 19th century transformed the energy landscape once again. Oil quickly became a cornerstone of the U.S. economy, powering transportation, industry, and residential heating, and informing debates about U.S. energy security in policy circles. Concurrently, natural gas emerged as a significant energy source, particularly for heating and electricity generation, as pipelines expanded across the country.

Electricity Revolution

The 20th century witnessed a revolution in electricity generation and consumption, and understanding where electricity comes from helps contextualize how systems evolved. The development of hydroelectric power, spurred by projects like the Hoover Dam and Tennessee Valley Authority, provided clean and renewable energy to millions of Americans. The widespread electrification of rural areas and the proliferation of appliances in homes and businesses transformed daily life and spurred economic growth.

Nuclear Power and Energy Diversification

In the mid-20th century, nuclear power emerged as a promising alternative to fossil fuels, promising abundant energy with minimal greenhouse gas emissions. Despite concerns about safety and waste disposal, nuclear power plants became a significant part of the U.S. energy mix, providing a stable base load of electricity, even as the aging U.S. power grid complicates integration of variable renewables.

Renewable Energy Revolution

In recent decades, the U.S. has seen a growing emphasis on renewable energy sources such as wind, solar, and geothermal power, yet market shocks and high fuel prices alone have not guaranteed a rapid green revolution, prompting broader policy and investment responses. Advances in technology, declining costs, and environmental concerns have driven investments in clean energy infrastructure and policies promoting renewable energy adoption. States like California and Texas lead the nation in wind and solar energy production, demonstrating the feasibility and benefits of transitioning to sustainable energy sources.

Energy Efficiency and Conservation

Alongside shifts in energy sources, improvements in energy efficiency and conservation have played a crucial role in reducing per capita energy consumption and greenhouse gas emissions. Energy-efficient appliances, building codes, and transportation innovations have helped mitigate the environmental impact of energy use while reducing costs for consumers and businesses, and weather and economic factors also influence demand; for example, U.S. power demand fell in 2023 on milder weather, underscoring the interplay between efficiency and usage.

Challenges and Opportunities

Looking ahead, the U.S. faces both challenges and opportunities in its energy future, as recent energy crisis effects ripple across electricity, gas, and EVs alike. Addressing climate change requires further investments in renewable energy, grid modernization, and energy storage technologies. Balancing energy security, affordability, and environmental sustainability remains a complex task that requires collaboration between government, industry, and society.

Conclusion

The evolution of energy use throughout U.S. history reflects a continuous quest for innovation, economic growth, and environmental stewardship. From wood and coal to nuclear power and renewables, each era has brought new challenges and opportunities in meeting the nation's energy needs. As the U.S. transitions towards a cleaner and more sustainable energy future, leveraging technological advancements and embracing policy solutions, amid debates over U.S. energy dominance, will be essential in shaping the next chapter of America's energy story.


Related News

View more

Which of the cleaner states imports dirty electricity?

Hourly Electricity Emissions Tracking maps grid balancing areas, embodied emissions, and imports/exports, revealing carbon intensity shifts across PJM, ERCOT, and California ISO, and clarifying renewable energy versus coal impacts on health and climate.


Key Points

An hourly method tracing generation, flows, and embodied emissions to quantify carbon intensity across US balancing areas.

✅ Hourly traces of imports/exports and generation mix

✅ Consumption-based carbon intensity by balancing area

✅ Policy insights for renewables, coal, health costs


In the United States, electricity generation accounts for nearly 30% of our carbon emissions. Some states have responded to that by setting aggressive renewable energy standards; others are hoping to see coal propped up even as its economics get worse. Complicating matters further is the fact that many regional grids are integrated, and as America goes electric the stakes grow, meaning power generated in one location may be exported and used in a different state entirely.

Tracking these electricity exports is critical for understanding how to lower our national carbon emissions. In addition, power from a dirty source like coal has health and environment impacts where it's produced, and the costs of these aren't always paid by the parties using the electricity. Unfortunately, getting reliable figures on how electricity is produced and where it's used is challenging, even for consumers trying to find where their electricity comes from in the first place, leaving some of the best estimates with a time resolution of only a month.

Now, three Stanford researchers—Jacques A. de Chalendar, John Taggart, and Sally M. Benson—have greatly improved on that standard, and they have managed to track power generation and use on an hourly basis. The researchers found that, of the 66 grid balancing areas within the United States, only three have carbon emissions equivalent to our national average, and they have found that imports and exports of electricity have both seasonal and daily changes. de Chalendar et al. discovered that the net results can be substantial, with imported electricity increasing California's emissions/power by 20%.

Hour by hour
To figure out the US energy trading landscape, the researchers obtained 2016 data for grid features called balancing areas. The continental US has 66 of these, providing much better spatial resolution on the data than the larger grid subdivisions. This doesn't cover everything—several balancing areas in Canada and Mexico are tied in to the US grid—and some of these balancing areas are much larger than others. The PJM grid, serving Pennsylvania, New Jersey, and Maryland, for example, is more than twice as large as Texas' ERCOT, in a state that produces and consumes the most electricity in the US.

Despite these limitations, it's possible to get hourly figures on how much electricity was generated, what was used to produce it, and whether it was used locally or exported to another balancing area. Information on the generating sources allowed the researchers to attach an emissions figure to each unit of electricity produced. Coal, for example, produces double the emissions of natural gas, which in turn produces more than an order of magnitude more carbon dioxide than the manufacturing of solar, wind, or hydro facilities. These figures were turned into what the authors call "embodied emissions" that can be traced to where they're eventually used.

Similar figures were also generated for sulfur dioxide and nitrogen oxides. Released by the burning of fossil fuels, these can both influence the global climate and produce local health problems.

Huge variation
The results were striking. "The consumption-based carbon intensity of electricity varies by almost an order of magnitude across the different regions in the US electricity system," the authors conclude. The low is the Bonneville Power grid region, which is largely supplied by hydropower; it has typical emissions below 100kg of carbon dioxide per megawatt-hour. The highest emissions come in the Ohio Valley Electric region, where emissions clear 900kg/MW-hr. Only three regional grids match the overall grid emissions intensity, although that includes the very large PJM (where capacity auction payouts recently fell), ERCOT, and Southern Co balancing areas.

Most of the low-emissions power that's exported comes from the Pacific Northwest's abundant hydropower, while the Rocky Mountains area exports electricity with the highest associated emissions. That leads to some striking asymmetries. Local generation in the hydro-rich Idaho Power Company has embodied emissions of only 71kg/MW-hr, while its imports, coming primarily from Rocky Mountain states, have a carbon content of 625kg/MW-hr.

The reliance on hydropower also makes the asymmetry seasonal. Local generation is highest in the spring as snow melts, but imports become a larger source outside this time of year. As solar and wind can also have pronounced seasonal shifts, similar changes will likely be seen as these become larger contributors to many of these regional grids. Similar things occur daily, as both demand and solar production (and, to a lesser extent, wind) have distinct daily profiles.

The Golden State
California's CISO provides another instructive case. Imports represent less than 30% of its total electric use in 2016, yet California electricity imports provided 40% of its embodied emissions. Some of these, however, come internally from California, provided by the Los Angeles Department of Water and Power. The state itself, however, has only had limited tracking of imported emissions, lumping many of its sources as "other," and has been exporting its energy policies to Western states in ways that shape regional markets.

Overall, the 2016 inventory provides a narrow picture of the US grid, as plenty of trends are rapidly changing our country's emissions profile, including the rise of renewables and the widespread adoption of efficiency measures and other utility trends in 2017 that continue to evolve. The method developed here can, however, allow for annual updates, providing us with a much better picture of trends. That could be quite valuable to track things like how the rapid rise in solar power is altering the daily production of clean power.

More significantly, it provides a basis for more informed policymaking. States that wish to promote low-emissions power can use the information here to either alter the source of their imports or to encourage the sites where they're produced to adopt more renewable power. And those states that are exporting electricity produced primarily through fossil fuels could ensure that the locations where the power is used pay a price that includes the health costs of its production.


Related News

View more

Sign Up for Electricity Forum’s Newsletter

Stay informed with our FREE Newsletter — get the latest news, breakthrough technologies, and expert insights, delivered straight to your inbox.

Electricity Today T&D Magazine Subscribe for FREE

Stay informed with the latest T&D policies and technologies.
  • Timely insights from industry experts
  • Practical solutions T&D engineers
  • Free access to every issue

Live Online & In-person Group Training

Advantages To Instructor-Led Training – Instructor-Led Course, Customized Training, Multiple Locations, Economical, CEU Credits, Course Discounts.

Request For Quotation

Whether you would prefer Live Online or In-Person instruction, our electrical training courses can be tailored to meet your company's specific requirements and delivered to your employees in one location or at various locations.