Canada Clean Electricity Regulations outline a 2035 net-zero grid target, driving decarbonization via wind, solar, hydro, SMRs, carbon capture, and efficiency, balancing reliability, affordability, and federal-provincial collaboration while phasing out coal and limiting fossil-fuel generation.
Key Points
Federal rules to cap CO2 from power plants and deliver a reliable, affordable net-zero grid by 2035.
✅ Applies to fossil-fired units; standards effective by Jan 1, 2035.
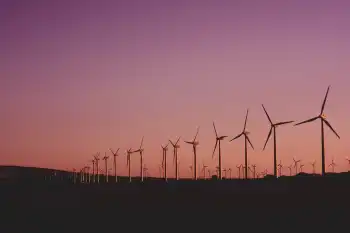
✅ Promotes wind, solar, hydro, SMRs, carbon capture, and efficiency.
✅ Balances reliability, affordability, and emissions cuts; ongoing consultation.
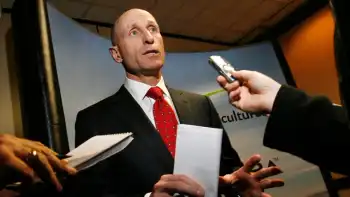
Saskatchewan’s premier said the federal government is “changing goalposts” with its proposed target for a net-zero electricity grid.
“We were looking at a net-zero plan in Saskatchewan and across Canada by the year 2050. That’s now been bumped to 2035. Well there are provinces that quite frankly aren’t going to achieve those types of targets by 2035,” Premier Scott Moe said Wednesday.
Ottawa proposed the Clean Electricity Regulations – formerly the Clean Electricity Standard – as part of its target for Canada to transition to net-zero emissions by 2050.
The regulations would help the country progress towards an updated proposed goal of a net-zero electricity grid by 2035.
“They’re un-consulted, notional targets that are put forward by the federal government without working with industries, provinces or anyone that’s generating electricity,” Moe said.
The Government of Canada was seeking feedback from stakeholders on the plan’s regulatory framework document earlier this year, up until August 2022.
“The clean electricity standard is something that’s still being consulted on and we certainly heard the views of Saskatchewan – not just Saskatchewan, many other provinces – and I think that’s something that’s being reflected on,” Jonathan Wilkinson, Canada’s minister of natural resources, said during an event near Regina Wednesday.
“We also recognize that the federal government has a role to play in helping provinces to make the kinds of changes that would need to be made in order to actually achieve a clean grid,” Wilkinson added.
The information received during the consultation will help inform the development of the proposed regulations, which are expected to be released before the end of the year, according to the federal government.
NET-ZERO ELECTRICITY GRID
The federal government said its Clean Electricity Regulations (CER) is part of a suite of measures, as the country moves towards a broad “decarbonization” of the economy, with Alberta's clean electricity path illustrating provincial approaches as well.
Net-zero emissions would mean Canada’s economy would either emit no greenhouse gas emissions or offset its emissions.
The plan encourages energy efficiency, abatement and non-emitting generation technologies such as carbon capture and storage and electricity generation options such as solar, wind, geothermal, small modular nuclear reactors (SMRs) and hydro, among others.
The government suggests consumer costs could be lowered by using some of these energy efficiency techniques, alongside demand management and a shift to lower-cost wind and solar power, echoing initiatives like the SaskPower 10% rebate aimed at affordability.
The CER focuses on three principles, each tied to affordability debates like the SaskPower rate hike in Saskatchewan:
Maximize greenhouse gas reductions to achieve the 2035 target
Ensure a reliable electrical grid to support Canadians and the economy
Maintain electrical affordability
“Achieving a net-zero electricity supply is key to reaching Canada’s climate targets in two ways,” the government said in its proposed regulations.
“First, it will reduce [greenhouse gas] emissions from the production of electricity. Second, using clean electricity instead of fossil fuels in vehicles, heating and industry will reduce emissions from those sectors too.
The regulations would regulate carbon dioxide emissions from electricity generating units that combust any amount of fossil fuel, have a capacity above a small megawatt threshold and sell electricity onto a regulated electricity system.
New rules would also be implemented for the development of new electricity generation units firing fossil fuels in or after 2025 and existing units. All units would be subject to emission standards by Jan. 1, 2035, at the latest.
The federal government launched consultations on the proposed regulations in March 2022.
Canada also has a 2030 emissions reduction plan that works towards meeting its Paris Agreement target to reduce emissions by 40-45 per cent from 2005 levels by 2030. This plan includes regulations to phase out coal-fired electricity by 2030.
COLLABORATION
The province recently introduced the Saskatchewan First Act, in an attempt to confirm its own jurisdiction and sovereignty when it comes to natural resources.
The act would amend Saskatchewan’s constitution to exert exclusive legislative jurisdiction under the Constitution of Canada.
The province is seeking jurisdiction over the exploration of non-renewable resources, the development, conservation and management of non-renewable natural and forestry resources, and the operation of sites and facilities for the generation and production of electrical energy.
While the federal government and Saskatchewan have come head-to-head publicly over several policy concerns in the past year, both sides remain open to collaborating on issues surrounding natural resources.
“We do have provincial jurisdiction in the development of these natural resources. We’d like to work collaboratively with the federal government on developing some of the most sustainable potash, uranium, agri-food products in the world,” Moe said.
Minister Wilkinson noted that while both the federal and provincial governments aim to respect each other’s jurisdiction, there is often some overlap, particularly in the case of environmental and economic policies, with Alberta's electricity sector changes underscoring those tensions as well.
“My view is we should endeavour to try to figure out ways that we can work together, and to ensure that we’re actually making progress for Saskatchewanians and for Canadians,” Wilkinson said.
“I think that Canadians expect us to try to figure out ways to work together, and where there are some disputes that can’t get resolved, ultimately the Supreme Court will decide on the issue of jurisdiction as they did in the case on the price on pollution.”
Moe said Saskatchewan is always open to working with the federal government, but not at the expense of its “provincial, constitutional autonomy.”
Related News