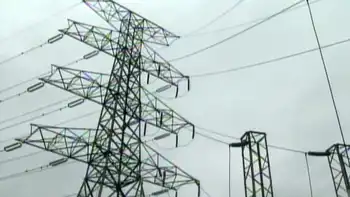
SkyPower to build wind power project in Fermeuse

By Canada NewsWire


CSA Z463 Electrical Maintenance

Our customized live online or in‑person group training can be delivered to your staff at your location.

  • Live Online
  • 6 hours Instructor-led
  • Group Training Available
Regular Price:
$249
Coupon Price:
$199
Reserve Your Seat Today
SkyPower Corp. ("SkyPower"), a company affiliated with Lehman Brothers, announced today that it signed a 20-year power purchase agreement with Newfoundland and Labrador Hydro ("Hydro") to build, operate and sell power from a 27 MW Wind Project to be located in Newfoundland and Labrador.

The project is located near the town of Fermeuse, will comprise nine 3.0 MW wind turbines and is expected to be in operation by the end of 2008.

"The Government of Newfoundland and Labrador has developed one of the most progressive energy policies in the country and their support for the development of wind power is exemplary," said Kerry Adler, CEO of SkyPower.

"The Town of Fermeuse is located in one of the highest wind sites in the country and I am pleased to have the opportunity to work with Hydro to harness the wind and build a major renewable energy project for this region."

"I am excited to see the wind farm proceed towards its plan for construction next year and with the benefits it will bring to the area. We are thrilled that SkyPower has chosen to develop its project here in Fermeuse and we welcome the project," said Fermeuse Mayor Patricia Coady.

Related News

Annual U.S. coal-fired electricity generation will increase for the first time since 2014

U.S. coal-fired generation 2021 rose as higher natural gas prices, stable coal costs, and a recovering power sector shifted the generation mix; capacity factors rebounded despite low coal stocks and ongoing plant retirements.


Key Points

Coal output rose 22% on high gas prices and higher capacity factors; a 5% decline is expected in 2022.

✅ Natural gas delivered cost averaged $4.93/MMBtu, more than double 2020

✅ Coal capacity factor rose to ~51% from 40% in 2020

✅ 2022 coal generation forecast to fall about 5%


We expect 22% more U.S. coal-fired generation in 2021 than in 2020, according to our latest Short-Term Energy Outlook (STEO). The U.S. electric power sector has been generating more electricity from coal-fired power plants this year as a result of significantly higher natural gas prices and relatively stable coal prices, even as non-fossil sources reached 40% of total generation. This year, 2021, will yield the first year-over-year increase in coal generation in the United States since 2014, highlighted by a January power generation jump earlier in the year.

Coal and natural gas have been the two largest sources of electricity generation in the United States. In many areas of the country, these two fuels compete to supply electricity based on their relative costs and sensitivity to policies and gas prices as well. U.S. natural gas prices have been more volatile than coal prices, so the cost of natural gas often determines the relative share of generation provided by natural gas and coal.

Because natural gas-fired power plants convert fuel to electricity more efficiently than coal-fired plants, record natural gas generation has at times underscored that advantage, and natural gas-fired generation can have an economic advantage even if natural gas prices are slightly higher than coal prices. Between 2015 and 2020, the cost of natural gas delivered to electric generators remained relatively low and stable. This year, however, natural gas prices have been much higher than in recent years. The year-to-date delivered cost of natural gas to U.S. power plants has averaged $4.93 per million British thermal units (Btu), more than double last year’s price.

The overall decline in electricity demand in 2020 and record-low natural gas prices led coal plants to significantly reduce the percentage of time that they generated power. In 2020, the utilization rate (known as the capacity factor) of U.S. coal-fired generators averaged 40%. Before 2010, coal capacity factors routinely averaged 70% or more. This year’s higher natural gas prices have increased the average coal capacity factor to about 51%, which is almost the 2018 average, a year when wind and solar reached 10% nationally.

Although rising natural gas prices have resulted in more U.S. coal-fired generation than last year, this increase in coal generation will most likely not continue as solar and wind expand in the generation mix. The electric power sector has retired about 30% of its generating capacity at coal plants since 2010, and no new coal-fired capacity has come online in the United States since 2013. In addition, coal stocks at U.S. power plants are relatively low, and production at operating coal mines has not been increasing as rapidly as the recent increase in coal demand. For 2022, we forecast that U.S. coal-fired generation will decline about 5% in response to continuing retirements of generating capacity at coal power plants and slightly lower natural gas prices.


Related News

View more

Parsing Ontario's electricity cost allocation

Ontario Global Adjustment and ICI balance hydro rates, renewable cost shift, and peak demand. Class A and Class B customers face demand response decisions amid pandemic occupancy uncertainty and volatile GA charges through 2022.


Key Points

A pricing model where GA costs and ICI peak allocation shape Class A/B bills, driven by renewables cost shifts.

✅ Renewable cost shift trims GA; larger Class A savings expected.

✅ Class A peak strategy returns; occupancy uncertainty persists.

✅ Class B faces volatile GA; limited levers beyond efficiency.


Ontario’s large commercial electricity customers can approach the looming annual decision about their billing structure for the 12 months beginning July 1 with the assurance of long-term relief on a portion of their costs, amid changes coming for electricity consumers that could affect planning. That’s to be weighed against uncertainties around energy demand and whether a locked-in cost allocation formula that looked favourable in pre-pandemic times will remain so until June 30, 2022.

“The biggest unknown is we just don’t know when the people are coming back,” Jon Douglas, director of sustainability with Menkes Property Management Services, reflected during a webinar sponsored by the Building Owners and Managers Association (BOMA) of Greater Toronto last week. “The occupancy in our office buildings this fall, and going into the new year, could really impact the outcome of the decision.”

After a year of operational upheaval and more modifications to provincial electricity pricing policies, BOMA Toronto’s regularly scheduled workshop ahead of the June 15 deadline for eligible customers to opt into the Industrial Conservation Initiative (ICI) program had a lot of ground to cover. Notably, beginning in January, all commercial customers have seen a reduction in the global adjustment (GA) component of their monthly hydro bills after the Ontario government shifted costs associated with contracted non-hydroelectric renewable supply to reduce the burden on industrial ratepayers from electricity rates to the general provincial account — a move that trims approximately $258 million per month from the total GA charged to industrial and commercial customers. However, they won’t garner the full benefit of that until 2022 since they’re currently repaying about $333 million in GA costs that were deferred in April, May and June of 2020.

Renewable cost shift pares the global adjustment
For now, Ontario government officials estimate the renewable cost shift equates to a 12 per cent discount relative to 2020 prices, even as typical bills may rise about 2% as fixed pricing ends in some cases. Once last year’s GA deferral is repaid at the end of 2021, they project the average Class A customer participating in the ICI program should realize a 16 per cent saving on the total hydro bill, while Class B customers paying the GA on a volumetric per kilowatt-hour (kWh) basis will see a slightly more moderate 15 per cent decrease.

“This is the biggest change to electricity pricing that’s happened since the introduction of ICI,” Tim Christie, director of electricity policy, economics and system planning for Ontario’s Ministry of Energy, Northern Development and Mines, told online workshop attendees. “The government is funding the out-of-market costs of renewables. It does tail off into the 2030s as those contracts (for wind, solar and biomass generation) expire, but over the next eight-ish years, it’s pretty steady at around just over $3 billion per year.”

Extrapolating from 2020 costs, he pegged average electricity costs at roughly 9.1 cents/kWh for Class A commercial customers and 13.2 cents/kWh for Class B, a point of concern for Ontario manufacturers facing high rates as well. However, energy management specialists suggest actual 2021 numbers haven’t proved that out.

“In commercial buildings, we’re averaging 10 to 12 cents for Class A in 2021, and we’re seeing more than that for about 14, 15 cents for Class B,” reported Scott Rouse, managing partner with the consulting firm, Energy@Work.

GA costs for Class B customers dropped nearly 30 per cent in the first four months of 2021 compared to the last four months of 2020, when they averaged 11.8 cents/kWh. Thus far, though, there have been significant month-to-month fluctuations, with a low of 5.04 cents/kWh in February and a high of 10.9 cents/kWh in April contributing to the four-month average of 8.3 cents/kWh.

“In 2020, system-wide GA very often averaged more than $1 billion per month,” Rouse said. “This February it dropped to $500 million, which was really quite surprising. So it is a very volatile cost.”

Although welcome, the renewable cost shift does alter the payback on energy-saving investments, particularly for demand response mechanisms like energy storage. When combined with pandemic-related uncertainty and a series of policy and program reversals alongside calls to clean up Ontario’s hydro policy in recent years, the industry’s appetite for some more capital-intensive technologies appears to be flagging.

“Volatility puts a pause on some of the innovation,” said Terry Flynn, general manager with BentallGreenOak and chair of BOMA Toronto’s energy committee. “It could be a leading edge, but it might be a bleeding edge that won’t bear any fruit because the way the commodity costs are structured will change.”

“There’s kind of a wait-and-see approach on some of these bigger investments,” Douglas concurred.

Industrial Conservation Initiative underpins commercial class divide
Turning to the ICI, Class A customers — defined as those with average monthly energy demand of at least 1 megawatt (MW) — encountered some unexpected changes to the program rules during 2020. Meanwhile, Class B customers — encompassing the vast share of commercial properties smaller than about 350,000 square feet — confront the persistent reality of electricity cost allocation that offloads the burden from larger players onto them.

Through the ICI, participating Class A customers pay a share of the global adjustment that’s prorated to their energy use during the five hours of the period from May 1 to April 30 when the highest overall system demand is recorded. This gives Class A customers the opportunity to lock in a favourable factor for calculating their share of monthly system-wide global adjustment costs if they can successful project and curtail energy loads during those five hours of peak demand. On the flipside, Class B customers pay the remainder of those system-wide costs, on a straightforward per-kWh basis, once Class A payments have been reconciled.

“Class B has sometimes been regarded as the forgotten middle child of the customer classes in Ontario where all the shifted costs in the system kind of pile up,” acknowledged Mark Olsheski, vice president, energy and environment, with Sussex Strategy Group. “Likewise, there can be big unpredictable and uncontrollable swings in the global adjustment rate from month to month and, outside of pure energy efficiency, there really is precious little opportunity or empowerment for a Class B customer to take actions to lower their bills.”

Nevertheless, COVID-19 presents a few extra hiccups for Class A customers this year. Conventionally, late May is when they receive notification of the cost allocation factor that would be used to determine their GA for the upcoming July 1 to June 30 period. This year, though, all current ICI participants will retain the factor they secured by responding to the five hours of peak demand during the 12 months from May 1, 2019 to April 30, 2020 after the Ontario government placed a temporary halt on the peak demand response aspect of the program last summer. Regardless, eligible ICI participants must formally opt into the program by June 15 or they will be billed as Class B customers.

Peak chasing resumes for summer 2021
Since peak demand hours conventionally occur from June to September, Class A customers will once again be studying forecasts intently and preparing to respond via Peak Perks as the heat wave season sets in. That should help alleviate some of the system stresses that arose last summer — prompting policy-makers to reject lobbying for a continued pause on peak demand response.

“The policy rationale was to allow consumers to focus on their operations when recovering from COVID as opposed to reducing peaks. The other issue was that we did not expect the peaks to be high last summer given COVID shutdowns,” Christie recounted. “But due to some hot weather, more people at home and also the lack of ICI response, we saw peaks we haven’t seen in many, many years come up last summer. So the peak hiatus has ended and this summer we’ll be back to responding to ICI as per normal.”

Among Class A customers, owners/managers of office and retail facilities generally have the most to lose from a billing formula tied to the energy demand of more densely occupied buildings in the summer of 2019. However, they could be much more competitively positioned for 2022-23 if their buildings remain below full occupancy and energy demand stays lower than usual this summer.

“Where we can improve is the IESO (Independent Electricity System Operator) and the LDCs (local distribution companies) need to help customers get their real-time data, especially in light of the phantom demand issue, interpret their bills and their Class A versus B scenarios much more easily and comprehensively,” urged Lee Hodgkinson, vice president, technical services, sustainability and ESG, with Dream Unlimited. “ I look for APIs (application programming interface) and direct data flow from the LDCs to the building owners so that we can access that data really easily.”

Given Class A’s historic advantages, few eligible ICI participants are expected to migrate out to Class B. From a sustainability perspective, there’s perhaps more cause to question how the ICI’s 1-MW threshold encourages strategies to move in the other direction.

“You could jack up demand in some buildings and get them into Class A basically by firing up the chillers on the weekend and then pouring cooling outside to get rid of it,” Douglas noted. “That has nothing to do with climate change strategy or sustainability, but it’s a cost- saving strategy, and, sometimes, when you look at the math, it’s hundreds of thousands of dollars you can save.”

Brian Hewson, vice president, consumer protection and industry performance with the Ontario Energy Board (OEB), confirmed the OEB is currently scrutinizing the discrepancy that leaves Class B as the only consumer group with no flexibility to curtail energy load during higher-priced periods, and will be providing advice to the Ministry of Energy. In the interim, that status does, at least, simplify tactics.

“Just reduce your kWh and it doesn’t matter what time of day because you’re paying that fixed rate for 24 hours a day. So if you can curb your demand at night, you get a big bang for your dollar,” Rouse advised.

“We do talk about rates a lot, but if you’re not using it, you’re not paying for it,” Flynn agreed. “A lot of our focus is still on really to try to reduce the number of kilowatts that we use. That seems to be the best thing to do.”


Related News

View more

LNG powered with electricity could be boon for B.C.'s independent power producers

B.C. LNG Electrification embeds clean hydro and wind power into low-emission liquefied natural gas, cutting carbon intensity, enabling coal displacement in Asia, and opening grid-scale demand for independent power producers and ITMO-based climate accounting.


Key Points

Powering LNG with clean electricity cuts carbon intensity, displaces coal, and grows demand for B.C.'s clean power.

✅ Electric-drive LNG cuts emissions intensity by up to 80%.

✅ Creates major grid load, boosting B.C. independent power producers.

✅ Enables ITMO crediting when coal displacement is verified.


B.C. has abundant clean power – if only there was a way to ship those electrons across the sea to help coal-dependent countries reduce their emissions, and even regionally, Alberta–B.C. grid link benefits could help move surplus power domestically.

Natural gas that is liquefied using clean hydro and wind power and then exported would be, in a sense, a way of embedding B.C.’s low emission electricity in another form of energy, and, alongside the Canada–Germany clean energy pact, part of a broader export strategy.

Given the increased demand that could come from an LNG industry – especially one that moves towards greater electrification and, as the IEA net-zero electricity report notes, broader system demand – poses some potentially big opportunities for B.C.’s clean energy independent power sector, as those attending the Clean Energy Association of BC's annual at the Generate conference heard recently.

At a session on LNG electrification, delegates were told that LNG produced in B.C. with electricity could have some significant environmental benefits.

Given how much power an LNG plant that uses electric drive consumes, an electrified LNG industry could also pose some significant opportunities for independent power producers – a sector that had the wind taken out of its sails with the sanctioning of the Site C dam project.

Only one LNG plant being built in B.C. – Woodfibre LNG – will use electric drive to produce LNG, although the companies behind Kitimat LNG have changed their original design plans, and now plan to use electric drive drive as well.

Even small LNG plants that use electric drive require a lot of power.

“We’re talking about a lot of power, since it’s one of the biggest consumers you can connect to a grid,” said Sven Demmig, head of project development for Siemens.

Most LNG plants still burn natural gas to drive the liquefaction process – a choice that intersects with climate policy and electricity grids in Canada. They typically generate 0.35 tonnes of CO2e per tonne of LNG produced.

Because it will use electric drive, LNG produced by Woodfibre LNG will have an emissions intensity that is 80% less than LNG produced in the Gulf of Mexico, said Woodfibre president David Keane.

In B.C., the benchmark for GHG intensities for LNG plants has been set at 0.16 tonnes of CO2e per tonne of LNG. Above that, LNG producers would need to pay higher carbon taxes than those that are below the benchmark.

The LNG Canada plant has an intensity of 0.15 tonnes og CO2e per tonne of LNG. Woodfibre LNG will have an emissions intensity of just 0.059, thanks to electric drive.

“So we will be significantly less than any operating facility in the world,” Keane said.

Keane said Sinopec has recently estimated that it expects China’s demand for natural gas to grow by 82% by 2030.

“So China will, in fact, get its gas supply,” Keane said. “The question is: where will that supply come from?

“For every tonne of LNG that’s being produced today in the United States -- and tonne of LNG that we’re not producing in Canada -- we’re seeing about 10 million tonnes of carbon leakage every single year.”

The first Canadian company to produce LNG that ended up in China is FortisBC. Small independent operators have been buying LNG from FortisBC’s Tilbury Island plant and shipping to China in ISO containers on container ships.

David Bennett, director of communications for FortisBC, said those shipments are traced to industries in China that are, indeed, using LNG instead of coal power now.

“We know where those shipping containers are going,” he said. “They’re actually going to displace coal in factories in China.”

Verifying what the LNG is used for is important, if Canadian producers want to claim any kind of climate credit. LNG shipped to Japan or South Korea to displace nuclear power, for example, would actually result in a net increase in GHGs. But used to displace coal, the emissions reductions can be significant, since natural gas produces about half the CO2 that coal does.

The problem for LNG producers here is B.C.’s emissions reduction targets as they stand today. Even LNG produced with electricity will produce some GHGs. The fact that LNG that could dramatically reduce GHGs in other countries, if it displaces coal power, does not count in B.C.’s carbon accounting.

Under the Paris Agreement, countries agree to set their own reduction targets, and, for Canada, cleaning up Canada’s electricity remains critical to meeting climate pledges, but don’t typically get to claim any reductions that might result outside their own country.

Canada is exploring the use of Internationally Transferred Mitigation Outcomes (ITMO) under the Under the Paris Agreement to allow Canada to claim some of the GHG reductions that result in other countries, like China, through the export of Canadian LNG.

“For example, if I were producing 4 million tonnes of greenhouse gas emissions in B.C. and I was selling 100% of my LNG to China, and I can verify that they’re replacing coal…they would have a reduction of about 60 or million tonnes of greenhouse gas emissions,” Keane said.

“So if they’re buying 4 million tonnes of emissions from us, under these ITMOs, then they have net reduction of 56 million tonnes, we’d have a net increase of zero.”

But even if China and Canada agreed to such a trading arrangement, the United Nations still hasn’t decided just how the rules around ITMOs will work.


Related News

View more

Tornadoes and More: What Spring Can Bring to the Power Grid

Spring Storm Grid Risks highlight tornado outbreaks, flooding, power outages, and transmission disruptions, with NOAA flood outlooks, coal and barge delays, vulnerable nuclear sites, and distribution line damage demanding resilience, reliability, and emergency preparedness.


Key Points

Spring Storm Grid Risks show how tornadoes and floods disrupt power systems, fuel transport, and plants guide resilience.

✅ Tornado outbreaks and derechos damage distribution and transmission

✅ Flooding drives outages via treefall, substation and plant inundation

✅ Fuel logistics disrupted: rail coal, river barges, road access


The storm and tornado outbreak that recently barreled through the US Midwest, South and Mid-Atlantic was a devastating reminder of how much danger spring can deliver, despite it being the “milder” season compared to summer and winter.  

Danger season is approaching, and the country is starting to see the impacts. 

The event killed at least 32 people across seven states. The National Weather Service is still tallying up the number of confirmed tornadoes, which has already passed 100. Communities coping with tragedy are assessing the damage, which so far includes at least 72 destroyed homes in one Tennessee county alone, and dozens more homes elsewhere. 

On Saturday, April 1–the day after the storm struck–there were 1.1 million US utility customers without power, even as EIA reported a January power generation surge earlier in the year. On Monday morning, April 3, there were still more than 80,000 customers in the dark, according to PowerOutage.us. The storm system brought disruptions to both distribution grids–those networks of local power lines you generally see running overhead to buildings–as well as the larger transmission grid in the Midwest, which is far less common than distribution-level issues. 

While we don’t yet have a lot of granular details about this latest storm’s grid impacts, recent shifts in demand like New York City's pandemic power patterns show how operating conditions evolve, and it’s worth going through what else the country might be in for this spring, as well as in future springs. Moreover, there are steps policymakers can take to prepare for these spring weather phenomena and bolster the reliability and resilience of the US power system. 

Heightened flood risk 
The National Oceanic Atmospheric Administration (NOAA) said in a recent outlook that about 44 percent of the United States is at risk of floods this spring, equating to about 146 million people. This includes most of the eastern half of the country, the federal agency said. 

The agency also sees “major” flood risk potential in some parts of the Upper Mississippi River Basin, and relatively higher risk in the Sierra Nevada region, due in part to a historic snowpack in California.  

Multiple components of the power system can be affected by spring floods. 

Power lines – Floods can saturate soil and make trees more likely to uproot and fall onto power lines. This has been contributing to power outages during California’s recent heavy storms–called atmospheric rivers–that started over the winter. In other regions, soil moisture has even been used as a predictor of where power outages will occur due to hurricanes, so that utility companies are better prepared to send line repair crews to the right areas. Hurricanes are primarily a summer and fall phenomenon, and summer also brings grid stress from air conditioning demand in many states, so for now, during spring, they are less of a concern.  

Fuel transport – Spring floods can hinder the transportation of fuels like coal. While it is a heavily polluting fossil fuel that is set to continue declining as a fuel source for US electricity generation, with the EIA summer outlook for wind and solar pointing to further shifts, coal still accounted for roughly 20 percent of the country’s generation in 2022.   

About 70 percent of US coal is transported at least part of the way by trains. The rail infrastructure to transport coal from the Powder River Basin in Montana and Wyoming–the country’s primary coal source–was proven to be vulnerable to extreme floods in the spring of 2011, and even more extreme floods in the spring of 2019. The 2019 floods’ disruptions of coal shipments to power plants via rail persisted for months and into the summertime, also affecting river shipments of coal by barge. In June 2019, hundreds of barges were stalled in the Mississippi River, through which millions of tons of the fossil fuel are normally transported. 

Power plants – Power plants themselves can also be at risk of flooding, since most of them are sited near a source of water that is used to create steam to spin the plants’ turbines, and conversely, low water levels can constrain hydropower as seen in Western Canada hydropower drought during recent reservoir shortfalls. Most US fossil fuel generating capacity from sources like methane gas, which recently set natural gas power records across the grid, and coal utilizes steam to generate electricity. 

However, much of the attention paid to the flood risk of power plant sites has centered on nuclear plants, a key source of low-carbon electricity discussed in IAEA low-carbon electricity lessons that also require a water source for the creation of steam, as well as for keeping the plant cool in an emergency. To name a notable flood example here in the United States–both visually and substantively–in 2011, the Fort Calhoun nuclear plant in Nebraska was completely surrounded by water due to late-spring flooding along the Missouri River. This sparked a lot of concerns because it was just a few months after the March 2011 meltdown of the Fukushima Daiichi nuclear plant in Japan. The public was thankfully not harmed by the Nebraska incident, but this was unfortunately not an isolated incident in terms of flood risks posed to the US nuclear power fleet. 


Related News

View more

Spent fuel removal at Fukushima nuclear plant delayed up to 5 years

Fukushima Daiichi decommissioning delay highlights TEPCO's revised timeline, spent fuel removal at Units 1 and 2, safety enclosures, decontamination, fuel debris extraction by robot arm, and contaminated water management under stricter radiation control.


Key Points

A government revised schedule pushing back spent fuel removal and decommissioning milestones at Fukushima Daiichi.

✅ TEPCO delays spent fuel removal at Units 1 and 2 for safety.

✅ Enclosures, decontamination, and robotics mitigate radioactive risk.

✅ Contaminated water cut target: 170 tons/day to 100 by 2025.


The Japanese government decided Friday to delay the removal of spent fuel from the Fukushima Daiichi nuclear power plant's Nos. 1 and 2 reactors by as much as five years, casting doubt on whether it can stick to its timeframe for dismantling the crippled complex.

The process of removing the spent fuel from the units' pools had previously been scheduled to begin in the year through March 2024.

In its latest decommissioning plan, the government said the plant's operator, Tokyo Electric Power Company Holdings Inc., will not begin the roughly two-year process (a timeline comparable to major reactor refurbishment programs seen worldwide) at the No. 1 unit at least until the year through March 2028 and may wait until the year through March 2029.

Work at the No. 2 unit is now slated to start between the year through March 2025 and the year through March 2027, it said.

The delay is necessary to take further safety precautions such as the construction of an enclosure around the No. 1 unit to prevent the spread of radioactive dust, and decontamination of the No. 2 unit, even as authorities have begun reopening previously off-limits towns nearby, the government said. It is the fourth time it has revised its schedule for removing the spent fuel rods.

"It's a very difficult process and it's hard to know what to expect. The most important thing is the safety of the workers and the surrounding area," industry minister Hiroshi Kajiyama told a press conference.

The government set a new goal of finishing the removal of the 4,741 spent fuel rods across all six of the plant's reactors by the year through March 2032, amid ongoing debates about the consequences of early nuclear plant closures elsewhere.

Plant operator TEPCO has started the process at the No. 3 unit and already finished at the No. 4 unit, which was off-line for regular maintenance at the time of the disaster. A schedule has yet to be set for the Nos. 5 and 6 reactors.

While the government maintained its overarching timeframe of finishing the decommissioning of the plant 30 to 40 years from the 2011 crisis triggered by a magnitude 9.0 earthquake and tsunami, there may be further delays, even as milestones at other nuclear projects are being reached worldwide.

The government said it will begin removing fuel debris from the three reactors that experienced core meltdowns in the year through March 2022, starting with the No. 2 unit as part of broader reactor decommissioning efforts.

The process, considered the most difficult part of the decommissioning plan, will involve using a robot arm, reflecting progress in advanced reactors technologies, to initially remove small amounts of debris, moving up to larger amounts.

The government also said it will aim to reduce the pace at which contaminated water at the plant increases. Water for cooling the melted cores, mixed with underground water, amounts to around 170 tons a day. That number will be brought down to 100 tons by 2025, it said.

The water is being treated to remove the most radioactive materials and stored in tanks on the plant's grounds, but already more than 1 million tons has been collected and space is expected to run out by the summer of 2022.


Related News

View more

COVID-19 Response: Electric Power Industry Closely Coordinating With Federal Partners

ESCC COVID-19 Response coordinates utilities, public power, and cooperatives to protect the energy grid and electricity reliability, aligning with DOE, DHS, CDC, FERC, and NERC on continuity of operations, mutual assistance, and supply chain resilience.


Key Points

An industry government effort ensuring reliability, operations continuity and supply chain stability during COVID-19.

✅ Twice weekly ESCC calls align DOE, DHS, HHS, CDC, FERC, NERC priorities.

✅ Focus on control centers, generation, quarantine access, mutual aid.

✅ Resource Guide supports localized decisions and supply chain resilience.


The nation’s investor-owned electric companies, public power utilities, and electric cooperatives are working together to protect the energy grid as the U.S. grid addresses COVID-19 challenges and ensure continued access to safe and reliable electricity during the COVID-19 global health crisis.

The electric power industry has been planning for years, including extensive disaster planning across utilities, for an emergency like the COVID-19 pandemic, as well as countless other types of emergencies, and the industry is coordinating closely with government partners through the Electricity Subsector Coordinating Council (ESCC) to ensure that organizations have the resources they need to keep the lights on.

The ESCC is holding high-level coordination calls twice a week with senior leadership from the Departments of Energy, Homeland Security, and Health and Human Services, the Centers for Disease Control and Prevention, the Federal Energy Regulatory Commission, and the North American Electric Reliability Corporation. These calls help ensure that industry and government work together to resolve any challenges that arise during this health emergency and that electricity remains safe for customers.

“Electricity and the energy grid are indispensable to our society, and one of our greatest strengths as an industry is our ability to convene and adapt quickly to changing circumstances and challenging events,” said Edison Electric Institute President Tom Kuhn. “Our industry plans for all types of contingencies, with examples such as local response planning, and strong industry-government coordination and cross-sector collaboration are critical to our planning and response. We appreciate the ongoing leadership and support of our government partners as we all respond to COVID-19 and power through this crisis together.”

The ESCC quickly mobilized and established strategic working groups dedicated to identifying and solving for short-, medium-, and long-term issues facing the industry during the COVID-19 pandemic, with utilities implementing necessary precautions to maintain service across regions.

The five current areas of focus are:

1. Continuity of operations at control centers, including on-site staff lockdowns when needed
2. Continuity of operations at generation facilities
3. Access to, and operations in, restricted or quarantined areas
4. Protocols for mutual assistance
5. Supply chain challenges

“The electric power industry has taken steps to prepare for the evolving coronavirus challenges, while maintaining our commitment to the communities we serve, including customer relief efforts announced by some providers,” said National Rural Electric Cooperative Association CEO Jim Matheson. “We have a strong track record of preparing for many kinds of emergencies that could impact the ability to generate and deliver electricity. While planning for this situation is unique from other business continuity planning, we are taking actions to prepare to operate with a smaller workforce, potential disruptions in the supply chain, and limited support services for an extended period of time.”

The ESCC has developed a COVID-19 Resource Guide linked here and available at electricitysubsector.org. This document was designed to support electric power industry leaders in making informed localized decisions in response to this evolving health crisis. The guide will evolve as additional recommended practices are identified and as more is learned about appropriate mitigation strategies.

“The American Public Power Association (APPA) continues to work with our communityowned public power members and our industry and government partners to gather and share upto-date information, best practices, and guidance to support them in safely maintaining operational integrity,” said APPA CEO Joy Ditto.


Related News

View more

Sign Up for Electricity Forum’s Newsletter

Stay informed with our FREE Newsletter — get the latest news, breakthrough technologies, and expert insights, delivered straight to your inbox.

Electricity Today T&D Magazine Subscribe for FREE

Stay informed with the latest T&D policies and technologies.
  • Timely insights from industry experts
  • Practical solutions T&D engineers
  • Free access to every issue

Download the 2025 Electrical Training Catalog

Explore 50+ live, expert-led electrical training courses –

  • Interactive
  • Flexible
  • CEU-cerified