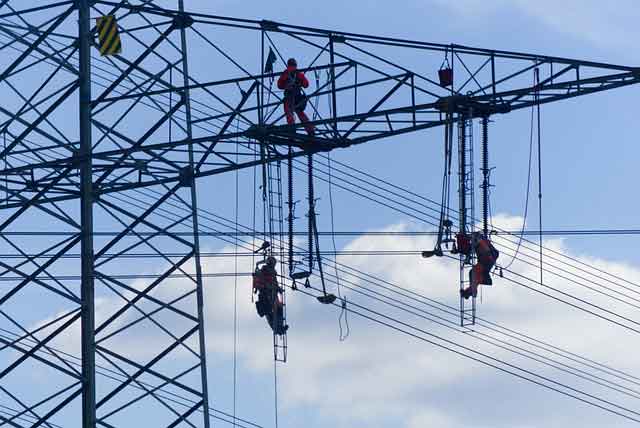
Increased solar activity will play havoc with grid

By Space Daily


NFPA 70b Training - Electrical Maintenance

Our customized live online or in‑person group training can be delivered to your staff at your location.

  • Live Online
  • 12 hours Instructor-led
  • Group Training Available
Regular Price:
$699
Coupon Price:
$599
Reserve Your Seat Today
Our Sun is muscling up again. According to NASA, it is beginning another 11-year cycle of activity.

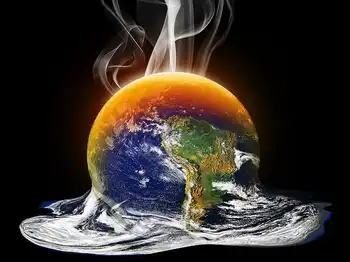
Considering that the Sun is to blame for some unfavorable climate changes on the Earth, the coming decade could spell more trouble for our planet.

The first measuring instruments made their appearance 440 years ago. They showed that our nearest star treats the Earth to more than just solar eclipses. Sunspots, solar flares, faculae and other phenomena affect everything on the Earth: from atmospheric events to human behavior. These phenomena are known collectively as solar activity.

This activity, expressing itself through bursts of solar radiation, magnetic storms or fiery flares, can vary in intensity, from very low to very strong. It is the storms that pose the greatest danger to civilization.

On August 28, 1859, polar lights glowed and shimmered all over the American continent as darkness fell. Many people thought their city was aflame. The instruments used to record this magnetic fluctuation across the world went off their scales. Telegraph systems malfunctioned, hit by a massive surge in voltage.

This was an actual solar storm. Its results for humankind were small, because civilization had not yet entered a hi-tech phase of development. Had something similar happen in our nuclear space age, destruction would have been catastrophic.

Meanwhile, according to scientific data, storms of such size occur relatively seldom: once in five centuries. But events with half the intensity happen every 50 years. The last one took place on November 13, 1960 and disturbed the Earth's geomagnetic fields, upsetting the operation of radio stations.

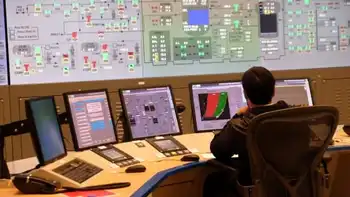
Now our dependence on radio electronic devices is so immense that increased solar activity could disable life-support systems all over the world, and not only on the surface.

America has long been sounding an alarm, because their continent is so close to the northern magnetic pole and is the most vulnerable to solar activity.

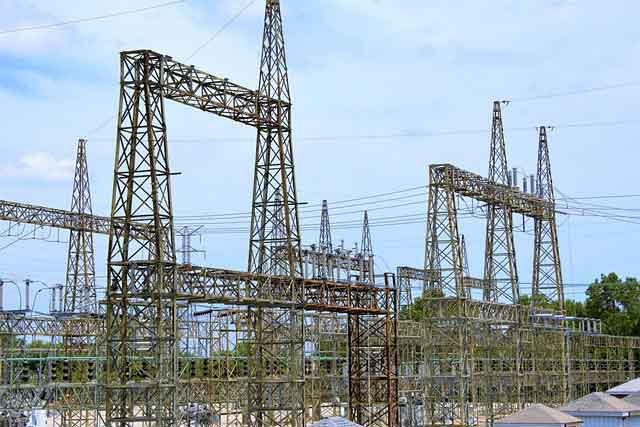
A study by the MetaTech Corporation revealed that an impact similar to that of 1859 would incapacitate the entire electricity grid in North America. Even the relatively weak magnetic storm of 1989, provoked by solar activity, caused an accident at a Canadian hydro-electric power plant that left 6 million people in the U.S. and Canada without electric power for nine hours.

According to a special report prepared by MetaTech for Congress in 2003, salvage and rescue work to restore power in areas with developed infrastructure could have been launched, according to estimates, only within several weeks or a month.

Poor space weather makes all orbital systems malfunction. According to the U.S. Department of Homeland Security, satellites damaged by the Sun cost $100 million per year to repair. Satellite insurance companies paid out $2 billion between 1996 and 2005 to compensate for damage to and loss of spacecraft because of solar effects.

A heavy solar storm can cause disruption to space-based navigation systems. Mistakes in coordinate measurements can be as great as 50 m and more, making a navigation satellite unfit for its mission. A serious loss of accuracy in the GPS Navstar system was recorded during a solar storm on October 23, 2003.

The mechanism of solar storms is unlikely to be fully understood anytime soon. On the other hand, space weather is easy to forecast with available equipment. Many years ago, NASA proposed orbiting special probes to monitor space weather. Modern space technology can produce low-priced standardized devices for warning of pending space weather anomalies.

Related News

U.S. Announces $28 Million To Advance And Deploy Hydropower Technology

DOE Hydropower Funding advances clean energy R&D, pumped storage hydropower, retrofits for non-powered dams, and fleet modernization under the Bipartisan Infrastructure Law and Inflation Reduction Act, boosting long-duration energy storage, licensing studies, and sustainability engagement.


Key Points

A $28M DOE initiative supporting hydropower R&D, pumped storage, retrofits, and stakeholder sustainability efforts.

✅ Funds retrofits for non-powered dams, expanding low-impact supply

✅ Backs studies to license new pumped storage facilities

✅ Engages stakeholders on modernization and environmental impacts


The U.S. Department of Energy (DOE) today announced more than $28 million across three funding opportunities to support research and development projects that will advance and preserve hydropower as a critical source of clean energy. Funded through President Biden’s Bipartisan Infrastructure Law, this funding will support the expansion of low-impact hydropower (such as retrofits for dams that do not produce power) and pumped storage hydropower, the development of new pumped storage hydropower facilities, and engagement with key voices on issues like hydropower fleet modernization, sustainability, and environmental impacts. President Biden’s Inflation Reduction Act also includes a standalone tax credit for energy storage, which will further enhance the economic attractiveness of pumped storage hydropower. Hydropower will be a key clean energy source in transitioning away from fossil fuels and meeting President Biden’s goals of 100% carbon pollution free electricity by 2035 through a clean electricity standard policy pathway and a net-zero carbon economy by 2050.

“Hydropower has long provided Americans with significant, reliable energy, which will now play a crucial role in achieving energy independence and protecting the climate,” said U.S. Secretary of Energy Jennifer M. Granholm. “President Biden’s Agenda is funding critical innovations to capitalize on the promise of hydropower and ensure communities have a say in building America’s clean energy future, including efforts to revitalize coal communities through clean projects.” 

Hydropower accounts for 31.5% of U.S. renewable electricity generation and about 6.3% of total U.S. electricity generation, with complementary programs to bolster energy security for rural communities supporting grid resilience, while pumped storage hydropower accounts for 93% of U.S. utility-scale energy storage, ensuring power is available when homes and businesses need it, even as the aging U.S. power grid poses challenges to renewable integration.  

The funding opportunities include, as part of broader clean energy funding initiatives, the following: 

  • Advancing the sustainable development of hydropower and pumped storage hydropower by encouraging innovative solutions to retrofit non-powered dams, the development and testing of technologies that mitigate challenges to pumped storage hydropower deployment, as well as opportunities for organizations not extensively engaged with DOE’s Water Power Technologies Office to support hydropower research and development. (Funding amount: $14.5 million) 
  • Supporting studies that facilitate the FERC licensing process and eventual construction and commissioning of new pumped storage hydropower facilities to facilitate the long-duration storage of intermittent renewable electricity. (Funding amount: $10 million)
  • Uplifting the efforts of diverse hydropower stakeholders to discuss and find paths forward on topics that include U.S. hydropower fleet modernization, hydropower system sustainability, and hydropower facilities’ environmental impact. (Funding amount: $4 million) 


Related News

View more

Parsing Ontario's electricity cost allocation

Ontario Global Adjustment and ICI balance hydro rates, renewable cost shift, and peak demand. Class A and Class B customers face demand response decisions amid pandemic occupancy uncertainty and volatile GA charges through 2022.


Key Points

A pricing model where GA costs and ICI peak allocation shape Class A/B bills, driven by renewables cost shifts.

✅ Renewable cost shift trims GA; larger Class A savings expected.

✅ Class A peak strategy returns; occupancy uncertainty persists.

✅ Class B faces volatile GA; limited levers beyond efficiency.


Ontario’s large commercial electricity customers can approach the looming annual decision about their billing structure for the 12 months beginning July 1 with the assurance of long-term relief on a portion of their costs, amid changes coming for electricity consumers that could affect planning. That’s to be weighed against uncertainties around energy demand and whether a locked-in cost allocation formula that looked favourable in pre-pandemic times will remain so until June 30, 2022.

“The biggest unknown is we just don’t know when the people are coming back,” Jon Douglas, director of sustainability with Menkes Property Management Services, reflected during a webinar sponsored by the Building Owners and Managers Association (BOMA) of Greater Toronto last week. “The occupancy in our office buildings this fall, and going into the new year, could really impact the outcome of the decision.”

After a year of operational upheaval and more modifications to provincial electricity pricing policies, BOMA Toronto’s regularly scheduled workshop ahead of the June 15 deadline for eligible customers to opt into the Industrial Conservation Initiative (ICI) program had a lot of ground to cover. Notably, beginning in January, all commercial customers have seen a reduction in the global adjustment (GA) component of their monthly hydro bills after the Ontario government shifted costs associated with contracted non-hydroelectric renewable supply to reduce the burden on industrial ratepayers from electricity rates to the general provincial account — a move that trims approximately $258 million per month from the total GA charged to industrial and commercial customers. However, they won’t garner the full benefit of that until 2022 since they’re currently repaying about $333 million in GA costs that were deferred in April, May and June of 2020.

Renewable cost shift pares the global adjustment
For now, Ontario government officials estimate the renewable cost shift equates to a 12 per cent discount relative to 2020 prices, even as typical bills may rise about 2% as fixed pricing ends in some cases. Once last year’s GA deferral is repaid at the end of 2021, they project the average Class A customer participating in the ICI program should realize a 16 per cent saving on the total hydro bill, while Class B customers paying the GA on a volumetric per kilowatt-hour (kWh) basis will see a slightly more moderate 15 per cent decrease.

“This is the biggest change to electricity pricing that’s happened since the introduction of ICI,” Tim Christie, director of electricity policy, economics and system planning for Ontario’s Ministry of Energy, Northern Development and Mines, told online workshop attendees. “The government is funding the out-of-market costs of renewables. It does tail off into the 2030s as those contracts (for wind, solar and biomass generation) expire, but over the next eight-ish years, it’s pretty steady at around just over $3 billion per year.”

Extrapolating from 2020 costs, he pegged average electricity costs at roughly 9.1 cents/kWh for Class A commercial customers and 13.2 cents/kWh for Class B, a point of concern for Ontario manufacturers facing high rates as well. However, energy management specialists suggest actual 2021 numbers haven’t proved that out.

“In commercial buildings, we’re averaging 10 to 12 cents for Class A in 2021, and we’re seeing more than that for about 14, 15 cents for Class B,” reported Scott Rouse, managing partner with the consulting firm, Energy@Work.

GA costs for Class B customers dropped nearly 30 per cent in the first four months of 2021 compared to the last four months of 2020, when they averaged 11.8 cents/kWh. Thus far, though, there have been significant month-to-month fluctuations, with a low of 5.04 cents/kWh in February and a high of 10.9 cents/kWh in April contributing to the four-month average of 8.3 cents/kWh.

“In 2020, system-wide GA very often averaged more than $1 billion per month,” Rouse said. “This February it dropped to $500 million, which was really quite surprising. So it is a very volatile cost.”

Although welcome, the renewable cost shift does alter the payback on energy-saving investments, particularly for demand response mechanisms like energy storage. When combined with pandemic-related uncertainty and a series of policy and program reversals alongside calls to clean up Ontario’s hydro policy in recent years, the industry’s appetite for some more capital-intensive technologies appears to be flagging.

“Volatility puts a pause on some of the innovation,” said Terry Flynn, general manager with BentallGreenOak and chair of BOMA Toronto’s energy committee. “It could be a leading edge, but it might be a bleeding edge that won’t bear any fruit because the way the commodity costs are structured will change.”

“There’s kind of a wait-and-see approach on some of these bigger investments,” Douglas concurred.

Industrial Conservation Initiative underpins commercial class divide
Turning to the ICI, Class A customers — defined as those with average monthly energy demand of at least 1 megawatt (MW) — encountered some unexpected changes to the program rules during 2020. Meanwhile, Class B customers — encompassing the vast share of commercial properties smaller than about 350,000 square feet — confront the persistent reality of electricity cost allocation that offloads the burden from larger players onto them.

Through the ICI, participating Class A customers pay a share of the global adjustment that’s prorated to their energy use during the five hours of the period from May 1 to April 30 when the highest overall system demand is recorded. This gives Class A customers the opportunity to lock in a favourable factor for calculating their share of monthly system-wide global adjustment costs if they can successful project and curtail energy loads during those five hours of peak demand. On the flipside, Class B customers pay the remainder of those system-wide costs, on a straightforward per-kWh basis, once Class A payments have been reconciled.

“Class B has sometimes been regarded as the forgotten middle child of the customer classes in Ontario where all the shifted costs in the system kind of pile up,” acknowledged Mark Olsheski, vice president, energy and environment, with Sussex Strategy Group. “Likewise, there can be big unpredictable and uncontrollable swings in the global adjustment rate from month to month and, outside of pure energy efficiency, there really is precious little opportunity or empowerment for a Class B customer to take actions to lower their bills.”

Nevertheless, COVID-19 presents a few extra hiccups for Class A customers this year. Conventionally, late May is when they receive notification of the cost allocation factor that would be used to determine their GA for the upcoming July 1 to June 30 period. This year, though, all current ICI participants will retain the factor they secured by responding to the five hours of peak demand during the 12 months from May 1, 2019 to April 30, 2020 after the Ontario government placed a temporary halt on the peak demand response aspect of the program last summer. Regardless, eligible ICI participants must formally opt into the program by June 15 or they will be billed as Class B customers.

Peak chasing resumes for summer 2021
Since peak demand hours conventionally occur from June to September, Class A customers will once again be studying forecasts intently and preparing to respond via Peak Perks as the heat wave season sets in. That should help alleviate some of the system stresses that arose last summer — prompting policy-makers to reject lobbying for a continued pause on peak demand response.

“The policy rationale was to allow consumers to focus on their operations when recovering from COVID as opposed to reducing peaks. The other issue was that we did not expect the peaks to be high last summer given COVID shutdowns,” Christie recounted. “But due to some hot weather, more people at home and also the lack of ICI response, we saw peaks we haven’t seen in many, many years come up last summer. So the peak hiatus has ended and this summer we’ll be back to responding to ICI as per normal.”

Among Class A customers, owners/managers of office and retail facilities generally have the most to lose from a billing formula tied to the energy demand of more densely occupied buildings in the summer of 2019. However, they could be much more competitively positioned for 2022-23 if their buildings remain below full occupancy and energy demand stays lower than usual this summer.

“Where we can improve is the IESO (Independent Electricity System Operator) and the LDCs (local distribution companies) need to help customers get their real-time data, especially in light of the phantom demand issue, interpret their bills and their Class A versus B scenarios much more easily and comprehensively,” urged Lee Hodgkinson, vice president, technical services, sustainability and ESG, with Dream Unlimited. “ I look for APIs (application programming interface) and direct data flow from the LDCs to the building owners so that we can access that data really easily.”

Given Class A’s historic advantages, few eligible ICI participants are expected to migrate out to Class B. From a sustainability perspective, there’s perhaps more cause to question how the ICI’s 1-MW threshold encourages strategies to move in the other direction.

“You could jack up demand in some buildings and get them into Class A basically by firing up the chillers on the weekend and then pouring cooling outside to get rid of it,” Douglas noted. “That has nothing to do with climate change strategy or sustainability, but it’s a cost- saving strategy, and, sometimes, when you look at the math, it’s hundreds of thousands of dollars you can save.”

Brian Hewson, vice president, consumer protection and industry performance with the Ontario Energy Board (OEB), confirmed the OEB is currently scrutinizing the discrepancy that leaves Class B as the only consumer group with no flexibility to curtail energy load during higher-priced periods, and will be providing advice to the Ministry of Energy. In the interim, that status does, at least, simplify tactics.

“Just reduce your kWh and it doesn’t matter what time of day because you’re paying that fixed rate for 24 hours a day. So if you can curb your demand at night, you get a big bang for your dollar,” Rouse advised.

“We do talk about rates a lot, but if you’re not using it, you’re not paying for it,” Flynn agreed. “A lot of our focus is still on really to try to reduce the number of kilowatts that we use. That seems to be the best thing to do.”


Related News

View more

Altmaier's new electricity forecast: the main driver is e-mobility

Germany 2030 Electricity Demand Forecast projects 658 TWh, driven by e-mobility, heat pumps, and green hydrogen. BMWi and BDEW see higher renewables, onshore wind, photovoltaics, and faster grid expansion to meet climate targets.


Key Points

A BMWi outlook to 658 TWh by 2030, led by e-mobility, plus demand from heat pumps, green hydrogen, and industry.

✅ Transport adds ~70 TWh; cars take 44 TWh by 2030

✅ Heat pumps add 35 TWh; green hydrogen needs ~20 TWh

✅ BDEW urges 70% renewables and faster grid expansion


Gross electricity consumption in Germany will increase from 595 terawatt hours (TWh) in 2018 to 658 TWh in 2030. That is an increase of eleven percent. This emerges from the detailed analysis of the development of electricity demand that the Federal Ministry of Economics (BMWi) published on Tuesday. The main driver of the increase is therefore the transport sector. According to the paper, increased electric mobility in particular contributes 68 TWh to the increase, in line with rising EV power demand trends across markets. Around 44 TWh of this should be for cars, 7 TWh for light commercial vehicles and 17 TWh for heavy trucks. If the electricity consumption for buses and two-wheelers is added, this results in electricity consumption for e-mobility of around 70 TWh.

The number of purely battery-powered vehicles is increasing according to the investigation by the BMWi to 16 million by 2030, reflecting the global electric car market momentum, plus 2.2 million plug-in hybrids. In 2018 there were only around 100,000 electric cars, the associated electricity consumption was an estimated 0.3 TWh, and plug-in mileage in 2021 highlighted the rapid uptake elsewhere. For heat pumps, the researchers predict an increase in demand by 35 TWh to around 42 TWh. They estimate the electricity consumption for the production of around 12.5 TWh of green hydrogen in 2030 to be just under 20 TWh. The demand at battery factories and data centers will increase by 13 TWh compared to 2018 by this point in time. In the data centers, there is no higher consumption due to more efficient hardware despite advancing digitization.

The updated figures are based on ongoing scenario calculations by Prognos, in which the market researchers took into account the goals of the Climate Protection Act for 2030 and the wider European electrification push for decarbonization. In the preliminary estimate presented by Federal Economics Minister Peter Altmaier (CDU) in July, a range of 645 to 665 TWh was determined for gross electricity consumption in 2030. Previously, Altmaier officially said that electricity demand in this country would remain constant for the next ten years. In June, Chancellor Angela Merkel (CDU) called for an expanded forecast that would have to include trends in e-mobility adoption within a decade and the Internet of Things, for example.

Higher electricity demand
The Federal Association of Energy and Water Management (BDEW) is assuming an even higher electricity demand of around 700 TWh in nine years. In any case, a higher share of renewable energies in electricity generation of 70 percent by 2030 is necessary in order to be able to achieve the climate targets and to address electricity price volatility risks. The expansion paths urgently need to be increased and obstacles removed. This could mean around 100 gigawatts (GW) for onshore wind turbines, 11 GW for biomass and at least 150 GW for photovoltaics by 2030. Faster network expansion and renovation will also become even more urgent, as electric cars challenge grids in many regions.


Related News

View more

Cabinet Of Ministers Of Ukraine - Prime Minister: Our Goal In The Energy Sector Is To Synchronize Ukraine's Integrated Power System With Entso-e

Ukraine's EU Energy Integration aims for ENTSO-E synchronization, electricity market liberalization, EU Green Deal alignment, energy efficiency upgrades, hydrogen development, and streamlined grid connections to accelerate reform, market pricing, and sustainable growth.


Key Points

Ukraine's EU Energy Integration syncs with ENTSO-E, liberalizes power markets, and aligns with the EU Green Deal.

✅ ENTSO-E grid synchronization and cross-border trade readiness

✅ Electricity market liberalization and market-based pricing

✅ EU Green Deal alignment: efficiency, hydrogen, coal regions


Ukraine's goal in the energy sector is to ensure the maximum integration of energy markets with EU markets, and in line with the EU plan to dump Russian energy that is reshaping the region, synchronization of Ukraine's integrated energy system with ENTSO-E while leaning on electricity imports as needed to maintain stability. Prime Minister Denys Shmyhal emphasized in his statement at the Fourth Ukraine Reform Conference underway through July 7-8 in Vilnius, the Republic of Lithuania.

The Head of Government presented a plan of reforms in Ukraine until 2030. In particular, energy sector reform and environmental protection, according to the PM, include the liberalization of the electricity market, with recent amendments to the market law guiding implementation, the simplification of connection to the electrical grid system and the gradual transition to market electricity prices, alongside potential EU emergency price measures under discussion, and the monetization of subsidies for vulnerable groups.

"Ukraine shares and fully supports the EU's climate ambitions and aims to synchronize its policies in line with the EU Green Deal, including awareness of Hungary's energy alignment with Russia to ensure coherent regional planning. The interdepartmental working group has determined priority areas for cooperation with the European Union: energy efficiency, hydrogen, transformation of coal regions, waste management," said the Prime Minister.

According to Denys Shmyhal, Ukraine has supported the EU's climate ambitions to move towards climate-neutral development by 2050 within the framework of the European Green Deal and should become an integral part of it in order not only to combat the effects of climate change in synergy with the EU but, as the country prepares for winter energy challenges and strengthens resilience, within the economic strategy development aimed to enhance security and create new opportunities for Ukrainian business, with continued energy security support from partners bolstering implementation.


Related News

View more

Energy crisis: EU outlines possible gas price cap strategies

EU Gas Price Cap Strategies aim to curb inflation during an energy crisis by capping wholesale gas and electricity generation costs, balancing supply and demand, mitigating subsidies, and safeguarding supply security amid Russia-Ukraine shocks.


Key Points

Temporary EU measures to cap gas and power prices, curb inflation, manage demand, and protect supply security.

✅ Flexible temporary price limits to secure gas supplies

✅ Framework cap on gas for electricity generation with demand checks

✅ Risk: subsidies, higher demand, and market distortions


The European Commission has outlined possible strategies to cap gas prices as the bloc faces a looming energy crisis this winter. 

Member states are divided over the emergency measures designed to pull down soaring inflation amid Russia's war in Ukraine. 

One proposal is a temporary "flexible" limit on gas prices to ensure that Europe can continue to secure enough gas, EU energy commissioner Kadri Simson said on Tuesday. 

Another option could be an EU-wide "framework" for a price cap on gas used to generate electricity, which would be combined with measures to ensure gas demand does not rise as a result, she said.

EU leaders are meeting on Friday to debate gas price cap strategies amid warnings that Europe's energy nightmare could worsen this winter.

Last week, France, Italy, Poland and 12 other EU countries urged the Commission to propose a broader price cap targeting all wholesale gas trade. 

But Germany -- Europe's biggest gas buyer -- and the Netherlands are among those opposing electricity market reforms within the bloc.

Russia has slashed gas deliveries to Europe since its February invasion of Ukraine, with Moscow blaming the cuts on Western sanctions imposed in response to the invasion, as the EU advances a plan to dump Russian energy across the bloc.

Since then, the EU has agreed on emergency laws to fill gas storage and windfall profit levies to raise money to help consumers with bills. 

Price cap critics
One energy analyst told Euronews that an energy price cap was an "unchartered territory" for the European Union. 

The EU's energy sector is largely liberalised and operates under the fundamental rules of supply and demand, making rolling back electricity prices complex in practice.

"My impression is that member states are looking at prices and quantities in isolation and that's difficult because of economics," said Elisabetta Cornago, a senior energy researcher at the Centre for European Reform.

"It's hard to picture such a level of market intervention This is uncharted territory."

The energy price cap would "quickly start costing billions" because it would force governments to continually subsidise the difference between the real market price and the artificially capped price, another expert said. 

"If you are successful and prices are low and you still get gas, consumers will increase their demand: low price means high demand. Especially now that winter is coming," said Bram Claeys, a senior advisor at the Regulatory Assistance Project. 


Related News

View more

Solar + Wind = 10% of US Electricity Generation in 1st Half of 2018

US Electricity Generation H1 2018 saw wind and solar gains but hydro declines, as natural gas led the grid mix and coal fell; renewables' share, GWh, emissions, and capacity additions shaped the power sector.


Key Points

It is the H1 2018 US power mix, where natural gas led, coal declined, and wind and solar grew while hydro fell.

✅ Natural gas reached 32% of generation, highest share

✅ Coal fell; renewables roughly tied nuclear at ~20%

✅ Wind and solar up; hydro output down vs 2017


To complement our revival of US electricity capacity reports, here’s a revival of our reports on US electricity generation.

As with the fresh new capacity report, things are not looking too bright when it comes to electricity generation. There’s still a lot of grey — in the bar charts below, in the skies near fossil fuel power plants, and in the human and planetary outlook based on how slowly we are cutting fossil fuel electricity generation.

As you can see in the charts above, wind and solar energy generation increased notably from the first half of 2017 to the first half of 2018, and the EIA expected larger summer solar and wind generation in subsequent months, reinforcing that momentum.

A large positive when it comes to the environment and human health is that coal generation dropped a great deal year over year — by even more than renewables increased, though the EIA later noted an increase in coal-fired generation in a subsequent year, complicating the trend. However, on the down side, natural gas soared as it became the #1 source of electricity generation in the United States (32% of US electricity). Furthermore, coal was still solidly in the #2 position (27% of US electricity). Renewables and nuclear were essentially in a tie at 19.8% of generation, with renewables just a tad above nuclear.

Actually, combined with an increase in nuclear power generation, natural gas electricity production increased so much that the renewable energy share of electricity generation actually dropped in the first half of 2018 versus the first half of 2017, even amid declining electricity use in some periods. It was 19.8% this year and 20% last year.

Again, solar and wind saw a significant growth in its market share, from 9% to 9.9%, but hydro brought the whole category down due to a decrease from 9% to 8%.

The visuals above are probably the best way to examine it all. The H1 2018 chart was still dominated by fossil fuels, which together accounted for approximately 60% of electricity generation, even though by 2021 non-fossil sources supplied about 40% of U.S. electricity, highlighting the longer-term shift. In H1 2017, the figure was 59.7%. Furthermore, if you switch to the “Change H1 2018 vs H1 2017 (GWh)” chart, you can watch a giant grey bar representing natural gas take over the top of the chart. It almost looks like it’s part of the border of the chart. The biggest glimmer of positivity in that chart is seeing the decline in coal at the bottom.

What will the second half of the year bring? Well, the gigantic US electricity generation market shifts slowly, even as monthly figures can swing, as January generation jumped 9.3% year over year according to the EIA, reminding us about volatility. There is so much base capacity, and power plants last so long, that it takes a special kind of magic to create a rapid transition to renewable energy. As you know from reading this quarter’s US renewable energy capacity report, only 43% of new US power capacity in the first half of the year was from renewables. The majority of it was from natural gas. Along with other portions of the calculation, that means that electricity generation from natural gas is likely to increase more than electricity generation from renewables.

Jump into the numbers below and let us know if you have any more thoughts.


Related News

View more

Sign Up for Electricity Forum’s Newsletter

Stay informed with our FREE Newsletter — get the latest news, breakthrough technologies, and expert insights, delivered straight to your inbox.

Electricity Today T&D Magazine Subscribe for FREE

Stay informed with the latest T&D policies and technologies.
  • Timely insights from industry experts
  • Practical solutions T&D engineers
  • Free access to every issue

Live Online & In-person Group Training

Advantages To Instructor-Led Training – Instructor-Led Course, Customized Training, Multiple Locations, Economical, CEU Credits, Course Discounts.

Request For Quotation

Whether you would prefer Live Online or In-Person instruction, our electrical training courses can be tailored to meet your company's specific requirements and delivered to your employees in one location or at various locations.