US power grid modernization addresses aging infrastructure, climate resilience, extreme weather, EV demand, and clean energy integration, using AI, transmission upgrades, and resilient substations to improve reliability, reduce outages, and enable rapid recovery.
Key Points
US power grid modernization strengthens infrastructure for resilience, reliability, and clean energy under rising demand.
✅ Hardening substations, lines, and transformers against extreme weather
✅ Integrating EV load, DERs, and renewables into transmission and distribution
✅ Using AI, sensors, and automation to cut outages and speed restoration
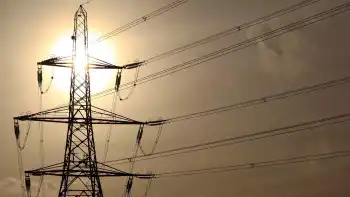
The power grid in the U.S. is aging and already struggling to meet current demand, with dangerous vulnerabilities documented across the system today. It faces a future with more people — people who drive more electric cars and heat homes with more electric furnaces.
Alice Hill says that's not even the biggest problem the country's electricity infrastructure faces.
"Everything that we've built, including the electric grid, assumed a stable climate," she says. "It looked to the extremes of the past — how high the seas got, how high the winds got, the heat."
Hill is an energy and environment expert at the Council on Foreign Relations. She served on the National Security Council staff during the Obama administration, where she led the effort to develop climate resilience. She says past weather extremes can no longer safely guide future electricity planning.
"It's a little like we're building the plane as we're flying because the climate is changing right now, and it's picking up speed as it changes," Hill says.
The newly passed infrastructure package dedicates billions of dollars to updating the energy grid with smarter electricity infrastructure programs that aim to modernize operations. Hill says utility companies and public planners around the country are already having to adapt. She points to the storm surge of Hurricane Sandy in 2012.
Article continues after sponsor message
"They thought the maximum would be 12 feet," she says. "That storm surge came in close to 14 feet. It overcame the barriers at the tip of Manhattan, and then the electric grid — a substation blew out. The city that never sleeps [was] plunged into darkness."
Hill noted that Con Edison, the utility company providing New York City with energy, responded with upgrades to its grid: It buried power lines, introduced artificial intelligence, upgraded software to detect failures. But upgrading the way humans assess risk, she says, is harder.
"What happens is that some people tend to think, well, that last storm that we just had, that'll be the worst, right?" Hill says. "No, there is a worse storm ahead. And then, probably, that will be exceeded."
In 2021, the U.S. saw electricity outages for millions of people as a result of historic winter storms in Texas, a heatwave in the Pacific Northwest and Hurricane Ida along the Gulf Coast. Climate change will only make extreme weather more likely and more intense, driving longer, more frequent outages for utilities and customers.
In the West, California's grid reliability remains under scrutiny as the state navigates an ambitious clean energy shift.
And that has forced utility companies and other entities to grapple with the question: How can we prepare for blackouts and broader system stress we've never experienced before?
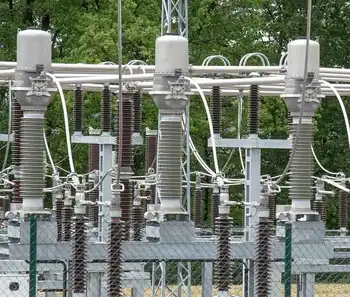
A modern power station in Maryland is built for the future
In the town of Edgemere, Md., the Fitzell substation of Baltimore Gas and Electric delivers electricity to homes and businesses. The facility is only a year or so old, and Laura Wright, the director of transmission and substation engineering, says it's been built with the future in mind.
She says the four transformers on site are plenty for now. And to counter the anticipated demand of population growth and a future reliance on electric cars, she says the substation has been designed for an easy upgrade.
"They're not projecting to need that additional capacity for a while, but we designed this station to be able to take that transformer out and put in a larger one," Wright says.
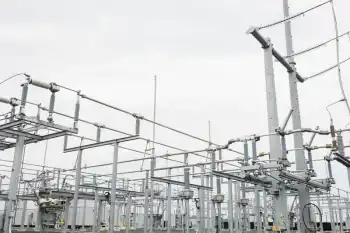
Slopes were designed to insulate the substation from sea level rise. And should the substation experience something like a catastrophic flooding event or deadly tornado, there's a plan for that too.
"If we were to have a failure of a transformer," Wright says, "we can bring one of those mobile transformers into the substation, park it in the substation, connect it up in place of that transformer. And we can do that in two to three days."
The Fitzell substation is a new, modern complex. Older sites can be knocked down for weeks.
That raises the question: Can the amount of money dedicated to the power grid in the new infrastructure legislation actually make meaningful changes to the energy system across the country, where studies find more blackouts than other developed nations persist?
"The infrastructure bill, unfortunately, only scratches the surface," says Daniel Cohan, an associate professor in civil and environmental engineering at Rice University.
Though the White House says $65 billion of the infrastructure legislation is dedicated to power infrastructure, a World Resources Institute analysis noted that only $27 billion would go to the electric grid — a figure that Cohan also used.
"If you drill down into how much is there for the power grid, it's only about $27 billion or so, and mainly for research and demonstration projects and some ways to get started," he says.
Cohan, who is also author of the forthcoming book Confronting Climate Gridlock, says federal taxpayer dollars can be significant but that most of the needed investment will eventually come from the private sector — from utility companies and other businesses spending "many hundreds of billions of dollars per decade," even as grid modernization affordability remains a concern. He also says the infrastructure package "misses some opportunities" to initiate that private-sector action through mandates.
"It's better than nothing, but, you know, with such momentous challenges that we face, this isn't really up to the magnitude of that challenge," Cohan says.
Cohan argues that thinking big, and not incrementally, can pay off. He believes a complete transition from fossil fuels to clean energy by 2035 is realistic and attainable — a goal the Biden administration holds — and could lead to more than just environmental benefit.
"It also can lead to more affordable electricity, more reliable electricity, a power supply that bounces back more quickly when these extreme events come through," he says. "So we're not just doing it to be green or to protect our air and climate, but we can actually have a much better, more reliable energy supply in the future."
Related News