San Diego Navy Office goes to Sweden for wind power

By San Diego Business Journal


Protective Relay Training - Basic

Our customized live online or in‑person group training can be delivered to your staff at your location.

  • Live Online
  • 12 hours Instructor-led
  • Group Training Available
Regular Price:
$699
Coupon Price:
$599
Reserve Your Seat Today
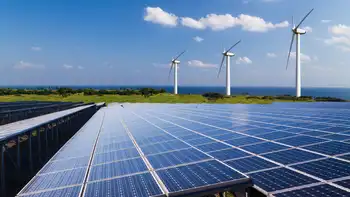
The Marines are erecting the first large-scale wind turbine at its logistics base in Barstow, said the San Diego-based Navy unit that oversees design and construction of public works projects.

The purchase of the wind turbine from a Swedish manufacturer will allow Marine Corps Logistics Base Barstow to generate an average of 3,000 megawatt hours of power each year for the base, complementing existing electric power, and translates to saving about $500,000 a year, said Monica Hernandez, contract specialist for Naval Facilities Engineering Command Southwest, the NavyÂ’s construction and real estate manager based in San Diego.

The Navy sought a wind generation system for the base starting in January 2006, but couldnÂ’t find a U.S. company to provide a system that met its specs, leading to the $4.5 million contract with the Swedish firm. The contract required a special waiver before it was signed in November, according to the command.

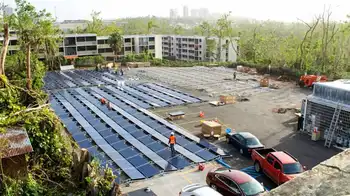
The Navy has installed solar panels at some of its bases, including Coronado and Point Loma, but this wind turbine is the first of its kind, said Navy spokesman Lee Saunders.

Rosemead-based Southern California Edison is providing design and construction services to the project, which is scheduled to be completed in November.

Related News

UK low-carbon electricity generation stalls in 2019

UK low-carbon electricity 2019 saw stalled growth as renewables rose slightly, wind expanded, nuclear output fell, coal hit record lows, and net-zero targets demand faster deployment to cut CO2 intensity below 100gCO2/kWh.


Key Points

Low-carbon sources supplied 54% of UK power in 2019, up just 1TWh; wind grew, nuclear fell, and coal dropped to 2%.

✅ Wind up 8TWh; nuclear down 9TWh amid outages

✅ Fossil fuels 43% of generation; coal at 2%

✅ Net-zero needs 15TWh per year added to 2030


The amount of electricity generated by low-carbon sources in the UK stalled in 2019, Carbon Brief analysis shows.

Low-carbon electricity output from wind, solar, nuclear, hydro and biomass rose by just 1 terawatt hour (TWh, less than 1%) in 2019. It represents the smallest annual increase in a decade, where annual growth averaged 9TWh. This growth will need to double in the 2020s to meet UK climate targets while replacing old nuclear plants as they retire.

Some 54% of UK electricity generation in 2019 came from low-carbon sources, including 37% from renewables and 20% from wind alone, underscoring wind's leading role in the power mix during key periods. A record-low 43% was from fossil fuels, with 41% from gas and just 2% from coal, also a record low. In 2010, fossil fuels generated 75% of the total.

Carbon Brief’s analysis of UK electricity generation in 2019 is based on figures from BM Reports and the Department for Business, Energy and Industrial Strategy (BEIS). See the methodology at the end for more on how the analysis was conducted.

The numbers differ from those published earlier in January by National Grid, which were for electricity supplied in Great Britain only (England, Wales and Scotland, but excluding Northern Ireland), including via imports from other countries.

Low-carbon low
In 2019, the UK became the first major economy to target net-zero greenhouse gas emissions by 2050, increasing the ambition of its legally binding Climate Change Act.

To date, the country has cut its emissions by around two-fifths since 1990, with almost all of its recent progress coming from the electricity sector.

Emissions from electricity generation have fallen rapidly in the decade since 2010 as coal power has been almost phased out and even gas output has declined. Fossil fuels have been displaced by falling demand and by renewables, such as wind, solar and biomass.

But Carbon Brief’s annual analysis of UK electricity generation shows progress stalled in 2019, with the output from low-carbon sources barely increasing compared to a year earlier.

The chart below shows low-carbon generation in each year since 2010 (grey bars) and the estimated level in 2019 (red). The pale grey bars show the estimated future output of existing low-carbon sources after old nuclear plants retire and the pale red bars show the amount of new generation needed to keep electricity sector emissions to less than 100 grammes of CO2 per kilowatt hour (gCO2/kWh), the UK’s nominal target for the sector.

 Annual electricity generation in the UK by fuel, terawatt hours, 2010-2019. Top panel: fuel by fuel. Bottom panel: cumulative total generation from all sources. Source: BEIS energy trends, BM Reports and Carbon Brief analysis. Chart by Carbon Brief using Highcharts.
As the chart shows, the UK will require significantly more low-carbon electricity over the next decade as part of meeting its legally binding climate goals.

The nominal 100gCO2/kWh target for 2030 was set in the context of the UK’s less ambitious goal of cutting emissions to 80% below 1990 levels by 2050. Now that the country is aiming to cut emissions to net-zero by 2050, that 100gCO2/kWh indicator is likely to be the bare minimum.

Even so, it would require a rapid step up in the pace of low-carbon expansion, compared to the increases seen over the past decade. On average, low-carbon generation has risen by 9TWh each year in the decade since 2010 – including a rise of just 1TWh in 2019.

Given scheduled nuclear retirements and rising demand expected by the Committee on Climate Change (CCC) – with some electrification of transport and heating – low-carbon generation would need to increase by 15TWh each year until 2030, just to meet the benchmark of 100gCO2/kWh.

For context, the 3.2 gigawatt (GW) Hinkley C new nuclear plant being built in Somerset will generate around 25TWh once completed around 2026. The world’s largest offshore windfarm, the 1.2GW Hornsea One scheme off the Yorkshire coast, will generate around 5TWh each year.

The new Conservative government is targeting 40GW of offshore wind by 2030, up from today’s figure of around 8GW. If policies are put in place to meet this goal, then it could keep power sector emissions below 100gCO2/kWh, depending on the actual performance of the windfarms built.

However, new onshore wind and solar, further new nuclear or other low-carbon generation, such as gas with carbon capture and storage (CCS), is likely to be needed if demand is higher than expected, or if the 100gCO2/kWh benchmark is too weak in the context of net-zero by 2050.

The CCC says it is “likely” to “reflect the need for more rapid deployment” of low-carbon towards net-zero emissions in its advice on the sixth UK carbon budget for 2033-2037, due in September.

Trading places
Looking more closely at UK electricity generation in 2019, Carbon Brief’s analysis shows why there was so little growth for low-carbon sources compared to the previous year.

There was another increase for wind power in 2019 (up 8TWh, 14%), with record wind generation as several large new windfarms were completed including the 1.2GW Hornsea One project in October and the 0.6GW Beatrice offshore windfarm in Q2 of 2019. But this was offset by a decline for nuclear (down 9TWh, 14%), due to ongoing outages for reactors at Hunterston in Scotland and Dungeness in Kent.

(Analysis of data held by trade organisation RenewableUK suggests some 0.6GW of onshore wind capacity also started operating in 2019, including the 0.2GW Dorenell scheme in Moray, Scotland.)

As a result of these movements, the UK’s windfarms overtook nuclear for the first time ever in 2019, becoming the country’s second-largest source of electricity generation, and earlier, wind and solar together surpassed nuclear in the UK as momentum built. This is shown in the figure below, with wind (green line, top panel) trading places with nuclear (purple) and gas (dark blue) down around 25% since 2010 but remaining the single-largest source.

 Annual electricity generation in the UK by fuel, terawatt hours, 2010-2019. Top panel: fuel by fuel. Bottom panel: cumulative total generation from all sources. Source: BEIS energy trends, BM Reports and Carbon Brief analysis. Chart by Carbon Brief using Highcharts.
The UK’s currently suspended nuclear plants are due to return to service in January and March, according to operator EDF, the French state-backed utility firm. However, as noted above, most of the UK’s nuclear fleet is set to retire during the 2020s, with only Sizewell B in Suffolk due to still be operating by 2030. Hunterston is scheduled to retire by 2023 and Dungeness by 2028.

Set against these losses, the UK has a pipeline of offshore windfarms, secured via “contracts for difference” with the government, at a series of auctions. The most recent auction, in September 2019, saw prices below £40 per megawatt hour – similar to current wholesale electricity prices.

However, the capacity contracted so far is not sufficient to meet the government’s target of 40GW by 2030, meaning further auctions – or some other policy mechanism – will be required.

Coal zero
As well as the switch between wind and nuclear, 2019 also saw coal fall below solar for the first time across a full year, echoing the 2016 moment when wind outgenerated coal across the UK, after it suffered another 60% reduction in electricity output. Just six coal plants remain in the UK, with Aberthaw B in Wales and Fiddlers Ferry in Cheshire closing in March.

Coal accounted for just 2% of UK generation in 2019, a record-low coal share since centralised electricity supplies started to operate in 1882. The fuel met 40% of UK needs as recently as 2012, but has plummeted thanks to falling demand, rising renewables, cheaper gas and higher CO2 prices.

The reduction in average coal generation hides the fact that the fuel is now often not required at all to meet the UK’s electricity needs. The chart below shows the number of days each year when coal output was zero in 2019 (red line) and the two previous years (blue).

 Cumulative number of days when UK electricity generation from renewable sources has been higher than that from fossil fuels. Source: BEIS energy trends, BM Reports and Carbon Brief analysis. Chart by Carbon Brief using Highcharts.
The 83 days in 2019 with zero coal generation amount to nearly a quarter of the year and include the record-breaking 18-day stretch without the fuel.

Great Britain has been running for a record TWO WEEKS without using coal to generate electricity – the first time this has happened since 1882.

The country’s grid has been coal-free for 45% of hours in 2019 so far.https://www.carbonbrief.org/countdown-to-2025-tracking-the-uk-coal-phase-out …

Coal generation was set for significant reductions around the world in 2019 – including a 20% reduction for the EU as a whole – according to analysis published by Carbon Brief in November.

Notably, overall UK electricity generation fell by another 9TWh in 2019 (3%), bringing the total decline to 58TWh since 2010. This is equivalent to more than twice the output from the Hinkley C scheme being built in Somerset. As Carbon Brief explained last year, falling demand has had a similar impact on electricity-sector CO2 emissions as the increase in output from renewables.

This is illustrated by the fact that the 9TWh reduction in overall generation translated into a 9TWh (6%) cut in fossil-fuel generation during 2019, with coal falling by 10TWh and gas rising marginally.

Increasingly renewable
As fossil-fuel output and overall generation have declined, the UK’s renewable sources of electricity have continued to increase. Their output has risen nearly five-fold in the past decade and their share of the UK total has increased from 7% in 2010 to 37% in 2019.

As a result, the UK’s increasingly renewable grid is seeing more minutes, hours and days during which the likes of wind, solar and biomass collectively outpace all fossil fuels put together, and on some days wind is the main source as well.

The chart below shows the number of days during each year when renewables generated more electricity than fossil fuels in 2019 (red line) and each of the previous four years (blue lines). In total, nearly two-fifths of days in 2019 crossed this threshold.

 Cumulative number of days when the UK has not generated any electricity from coal. Source: BEIS energy trends, BM Reports and Carbon Brief analysis. Chart by Carbon Brief using Highcharts.
There were also four months in 2019 when renewables generated more of the UK’s electricity than fossil fuels: March, August, September and December. The first ever such month came in September 2018 and more are certain to follow.

National Grid, which manages Great Britain’s high-voltage electricity transmission network, is aiming to be able to run the system without fossil fuels by 2025, at least for short periods. At present, it sometimes has to ask windfarm operators to switch off and gas plants to start running in order to keep the electricity grid stable.

Note that biomass accounted for 11% of UK electricity generation in 2019, nearly a third of the total from all renewables. Some two-thirds of the biomass output is from “plant biomass”, primarily wood pellets burnt at Lynemouth in Northumberland and the Drax plant in Yorkshire. The remainder was from an array of smaller sites based on landfill gas, sewage gas or anaerobic digestion.

The CCC says the UK should “move away” from large-scale biomass power plants, once existing subsidy contracts for Drax and Lynemouth expire in 2027.

Using biomass to generate electricity is not zero-carbon and in some circumstances could lead to higher emissions than from fossil fuels. Moreover, there are more valuable uses for the world’s limited supply of biomass feedstock, the CCC says, including carbon sequestration and hard-to-abate sectors with few alternatives.

Methodology
The figures in the article are from Carbon Brief analysis of data from BEIS Energy Trends chapter 5 and chapter 6, as well as from BM Reports. The figures from BM Reports are for electricity supplied to the grid in Great Britain only and are adjusted to include Northern Ireland.

In Carbon Brief’s analysis, the BM Reports numbers are also adjusted to account for electricity used by power plants on site and for generation by plants not connected to the high-voltage national grid. This includes many onshore windfarms, as well as industrial gas combined heat and power plants and those burning landfill gas, waste or sewage gas.

By design, the Carbon Brief analysis is intended to align as closely as possible to the official government figures on electricity generated in the UK, reported in BEIS Energy Trends table 5.1.

Briefly, the raw data for each fuel is in most cases adjusted with a multiplier, derived from the ratio between the reported BEIS numbers and unadjusted figures for previous quarters.

Carbon Brief’s method of analysis has been verified against published BEIS figures using “hindcasting”. This shows the estimates for total electricity generation from fossil fuels or renewables to have been within ±3% of the BEIS number in each quarter since Q4 2017. (Data before then is not sufficient to carry out the Carbon Brief analysis.)

For example, in the second quarter of 2019, a Carbon Brief hindcast estimates gas generation at 33.1TWh, whereas the published BEIS figure was 34.0TWh. Similarly, it produces an estimate of 27.4TWh for renewables, against a BEIS figure of 27.1TWh.

National Grid recently shared its own analysis for electricity in Great Britain during 2019 via its energy dashboard, which differs from Carbon Brief’s figures.


Related News

View more

Doug Ford ‘proud’ of decision to tear up hundreds of green energy contracts

Ontario Renewable Energy Cancellations highlight Doug Ford's move to scrap wind turbine contracts, citing electricity rate relief and taxpayer savings, while critics, the NDP, and industry warn of job losses, termination fees, and auditor scrutiny.


Key Points

Ontario's termination of renewable contracts, defended as cost and rate relief, faces disputes over savings and jobs.

✅ PCs cite electricity rate relief and taxpayer savings.

✅ Critics warn of job losses and termination fees.

✅ Auditor inquiry sought into contract cancellation costs.


Ontario Premier Doug Ford, whose new stance on wind power has drawn attention, said Thursday he is “proud” of his decision to tear up hundreds of renewable energy deals, a move that his government acknowledges could cost taxpayers more than $230 million.

Ford dismissed criticism that his Progressive Conservatives are wasting public money, telling a news conference that the cancellation of 750 contracts signed by the previous Liberal government will save cash, even as Ontario moves to reintroduce renewable energy projects in the coming years.

“I’m so proud of that,” Ford said of his decision. “I’m proud that we actually saved the taxpayers $790 million when we cancelled those terrible, terrible, terrible wind turbines that really for the last 15 years have destroyed our energy file.”

Later Thursday, Ford went further in defending the cancelled contracts, saying “if we had the chance to get rid of all the wind mills we would,” though a court ruling near Cornwall challenged such cancellations.

The NDP first reported the cost of the cancellations Tuesday, saying the $231 million figure was listed as “other transactions”, buried in government documents detailing spending in the 2018-2019 fiscal year.

The Progressive Conservatives have said the final cost of the cancellations, which include the decommissioning of a wind farm already under construction in Prince Edward County, Ont., has yet to be established, amid warnings about wind project cancellation costs from developers.

The government has said it tore up the deals because the province didn’t need the power and it was driving up electricity rates, and the decision will save millions over the life of the contracts. Industry officials have disputed those savings, saying the cancellations will just mean job losses for small business, and ignore wind power’s growing competitiveness in electricity markets.

NDP Leader Andrea Horwath has asked Ontario’s auditor general to investigate the contracts and their termination fees, amid debates over Ontario’s electricity future among leadership contenders. She called Ford’s remarks on Thursday “ridiculous.”

“Every jurisdiction around the world is trying to figure out how to bring more renewables onto their electricity grids,” she said. “This government is taking us backwards and costing us at the very least $231 million in tearing these energy contracts.”

At the federal level, a recent green electricity contract with an Edmonton company underscores that shift.


Related News

View more

Climate change: Greenhouse gas concentrations again break records

Rising Greenhouse Gas Concentrations drive climate change, with CO2, methane, and nitrous oxide surging; WMO data show higher radiative forcing, elevated pre-industrial baselines, and persistent atmospheric concentrations despite Paris Agreement emissions pledges.


Key Points

Increasing atmospheric CO2, methane, and nitrous oxide levels that raise radiative forcing and drive warming.

✅ WMO data show CO2 at 407.8 ppm in 2018, above decade average

✅ Methane and nitrous oxide surged, elevating total radiative forcing

✅ Concentrations differ from emissions; sinks absorb about half


The World Meteorological Organization (WMO) says the increase in CO2 was just above the average rise recorded over the last decade.

Levels of other warming gases, such as methane and nitrous oxide, have also surged by above average amounts.

Since 1990 there's been an increase of 43% in the warming effect on the climate of long lived greenhouse gases.

The WMO report looks at concentrations of warming gases in the atmosphere rather than just emissions.

The difference between the two is that emissions refer to the amount of gases that go up into the atmosphere from the use of fossil fuels, such as burning coal for coal-fired electricity generation and from deforestation.

Concentrations are what's left in the air after a complex series of interactions between the atmosphere, the oceans, the forests and the land. About a quarter of all carbon emissions are absorbed by the seas, and a similar amount by land and trees, while technologies like carbon capture are being explored to remove CO2.

Using data from monitoring stations in the Arctic and all over the world, researchers say that in 2018 concentrations of CO2 reached 407.8 parts per million (ppm), up from 405.5ppm a year previously.

This increase was above the average for the last 10 years and is 147% of the "pre-industrial" level in 1750.

The WMO also records concentrations of other warming gases, including methane and nitrous oxide, and some countries have reported declines in certain potent gases, as noted in US greenhouse gas controls reports, though global levels remain elevated. About 40% of the methane emitted into the air comes from natural sources, such as wetlands, with 60% from human activities, including cattle farming, rice cultivation and landfill dumps.

Methane is now at 259% of the pre-industrial level and the increase seen over the past year was higher than both the previous annual rate and the average over the past 10 years.

Nitrous oxide is emitted from natural and human sources, including from the oceans and from fertiliser-use in farming. According to the WMO, it is now at 123% of the levels that existed in 1750.

Last year's increase in concentrations of the gas, which can also harm the ozone layer, was bigger than the previous 12 months and higher than the average of the past decade.

What concerns scientists is the overall warming impact of all these increasing concentrations. Known as total radiative forcing, this effect has increased by 43% since 1990, and is not showing any indication of stopping.

There is no sign of a slowdown, let alone a decline, in greenhouse gases concentration in the atmosphere despite all the commitments under the Paris agreement on climate change and the ongoing global energy transition efforts," said WMO Secretary-General Petteri Taalas.

"We need to translate the commitments into action and increase the level of ambition for the sake of the future welfare of mankind," he added.

"It is worth recalling that the last time the Earth experienced a comparable concentration of CO2 was three to five million years ago. Back then, the temperature was 2-3C warmer, sea level was 10-20m higher than now," said Mr Taalas.

The UN Environment Programme will report shortly on the gap between what actions countries are taking to cut carbon, for example where Australia's emissions rose 2% recently, and what needs to be done to keep under the temperature targets agreed in the Paris climate pact.

Preliminary findings from this study, published during the UN Secretary General's special climate summit last September, indicated that emissions continued to rise during 2018, although global emissions flatlined in 2019 according to the IEA.

Both reports will help inform delegates from almost 200 countries who will meet in Madrid next week for COP25, following COP24 in Katowice the previous year, the annual round of international climate talks.


Related News

View more

Federal net-zero electricity regulations will permit some natural gas power generation

Canada Clean Electricity Regulations allow flexible, technology-neutral pathways to a 2035 net-zero grid, permitting limited natural gas with carbon capture, strict emissions standards, and exemptions for emergencies and peak demand across provinces and territories.


Key Points

Federal draft rules for a 2035 net-zero grid, allowing limited gas with CCS under strict performance and compliance standards.

✅ Performance cap: 30 tCO2 per GWh annually for gas plants

✅ CCS must sequester 95% of emissions to comply

✅ Emergency and peak demand exemptions permitted


After facing pushback from Alberta and Saskatchewan, and amid looming power challenges nationwide, Canada's draft net-zero electricity regulations — released today — will permit some natural gas power generation. 

Environment Minister Steven Guilbeault released Ottawa's proposed Clean Electricity Regulations on Thursday.

Provinces and territories will have a minimum 75-day window to comment on the draft regulations. The final rules are intended to pave the way to a net-zero power grid in Canada, aligning with 2035 clean electricity goals established nationally. 

Calling the regulations "technology neutral," Guilbeault said the federal government believes there's enough flexibility to accommodate the different energy needs of Canada's diverse provinces and territories, including how Ontario is embracing clean power in its planning. 

"What we're talking about is not a fossil fuel-free grid by 2035; it's a net zero grid by 2035," Guilbeault said. 

"We understand there will be some fossil fuels remaining … but we're working to minimize those, and the fossil fuels that will be used in 2035 will have to comply with rigorous environmental and emission standards," he added. 

Some analysts argue that scrapping coal-fired electricity can be costly and ineffective, underscoring the trade-offs in transition planning.

While non-emitting sources of electricity — hydroelectricity, wind and solar and nuclear — should not have any issues complying with the regulations, natural gas plants will have to meet specific criteria.

Those operations, the government said, will need to emit the equivalent of 30 tonnes of carbon dioxide per gigawatt hour or less annually to help balance demand and emissions across the grid.

Federal officials said existing natural gas power plants could comply with that performance standard with the help of carbon capture and storage systems, which would be required to sequester 95 per cent of their emissions.

"In other words, it's achievable, and it is achievable by existing technology," said a government official speaking to reporters Thursday on background and not for attribution.

The regulations will also allow a certain level of natural gas power production without the need to capture emissions. Capturing emissions will be exempted during emergencies and peak periods when renewables cannot keep up with demand. 

Some newer plants might not have to comply with the rules until the 2040s, because the regulations apply to plants 20 years after they are commissioned, which dovetails with net-zero by 2050 commitments from electricity associations. 

The two-decade grace period does not apply to plants that open after the regulations are expected to be finalized in 2025.


Related News

View more

South Australia rides renewables boom to become electricity exporter

Australia electricity grid transition is accelerating as renewables, wind, solar, and storage drive decentralised generation, emissions cuts, and NEM trade shifts, with South Australia becoming a net exporter post-Hazelwood closure and rooftop solar surging.


Key Points

Australia electricity shift to renewables, distributed generation and storage, cutting emissions, reshaping NEM flows.

✅ South Australia now exports power post-Hazelwood closure

✅ Rooftop solar is the fastest-growing NEM generation source

✅ Gas peaking and storage investments balance variable renewables


The politics may not change much, but Australia’s electricity grid is changing before our very eyes – slowly and inevitably becoming more renewable, more decentralised, and in step with Australia's energy transition that is challenging the pre-conceptions of many in the industry.

The latest national emissions audit from The Australia Institute, which includes an update on key electricity trends in the national electricity market, notes some interesting developments over the last three months.

The most surprising of those developments may be the South Australia achievement, which shows that since the closure of the Hazelwood brown coal generator in Victoria in March 2017, and as renewables outpacing brown coal in other markets, South Australia has become a net exporter of electricity, in net annualised terms.

Hugh Saddler, lead author of the study, notes that this is a big change for South Australia, which in 1999 and 2000, when it had only gas and local coal, used to import 30% of its electricity demand.

#google#

The fact that wholesale prices in South Australia were higher in other states – then, as they are now – has nothing to with wind and solar, but the fact that it has no low-cost conventional source and a peaky demand profile (then and now).

“The difference today is that the state is now taking advantage of its abundant resources of wind and solar radiation, and the new technologies which have made them the lowest cost sources of new generation, to supply much of its electricity requirements,” Saddler writes.

Other things to note about the flows between states is that Victoria was about equal on imports and exports with its three neighbouring states, despite the closure of Hazelwood. NSW continues to import around 10% of its needs from cheaper providers in Queensland.

Gas-fired generation had increased in the last year or two in South Australia as a result of the Northern closure, but is still below the levels of a decade ago.

But because it is expensive, this is likely to spur more investment in storage.

As for rooftop solar, Saddler notes that the share of residential solar in the grid is still relatively small but, despite excess solar risks flagged by distributors, it is the most steadily growing generation source in the NEM.

That line is expected to grow steadily. By 2040, or perhaps 2050, the share of distributed generation, which includes rooftop solar, battery storage and demand management, is expected to reach nearly half of all Australia’s grid demand.

Saddler, says, however, that the increase in large-scale solar over the last few months is a significant milestone in Australia’s transition towards clean electricity generation, mirroring trends in India's on-grid solar development seen in recent years. (See very top graph).

“Firstly, they are a concrete demonstration that the construction cost advantage, which wind enjoyed over solar until a year or two ago, is gone.

“From now on we can expect new capacity to be a mix of both technologies. Indeed, the Clean Energy Regulator states that it expects solar to account for half of all (new renewable) capacity by 2020, and the US is moving toward 30% from wind and solar as well.”


Related News

View more

Germany's Call for Hydrogen-Ready Power Plants

Germany Hydrogen-Ready Power Plants Tender accelerates the energy transition by enabling clean energy generation, decarbonization, and green hydrogen integration through retrofit and new-build capacity, resilient infrastructure, flexible storage, and grid reliability provisions.


Key Points

Germany tender to build or convert plants for hydrogen, advancing decarbonization, energy security, and clean power.

✅ Hydrogen-ready retrofits and new-build generation capacity

✅ Supports decarbonization, grid reliability, and flexible storage

✅ Future-proof design for green hydrogen supply integration


Germany, a global leader in energy transition and environmental sustainability, has recently launched an ambitious call for tenders aimed at developing hydrogen-ready power plants. This initiative is a significant step in the country's strategy to transform its energy infrastructure and support the broader goal of a greener economy. The move underscores Germany’s commitment to reducing greenhouse gas emissions and advancing clean energy technologies.

The Need for Hydrogen-Ready Power Plants

Hydrogen, often hailed as a key player in the future of clean energy, offers a promising solution for decarbonizing various sectors, including power generation. Unlike fossil fuels, hydrogen produces zero carbon emissions when used in fuel cells or burned. This makes it an ideal candidate for replacing conventional energy sources that contribute to climate change.

Germany’s push for hydrogen-ready power plants reflects the country’s recognition of hydrogen’s potential in achieving its climate goals. Traditional power plants, which typically rely on coal, natural gas, or oil, emit substantial amounts of CO2. Transitioning these plants to utilize hydrogen can significantly reduce their carbon footprint and align with Germany's climate targets.

The Details of the Tender

The recent tender call is part of Germany's broader strategy to incorporate hydrogen into its energy mix, amid a nuclear option debate in climate policy. The tender seeks proposals for power plants that can either be converted to use hydrogen or be built with hydrogen capability from the outset. This approach allows for flexibility and innovation in how hydrogen technology is integrated into existing and new energy infrastructures.

One of the critical aspects of this initiative is the focus on “hydrogen readiness.” This means that power plants must be designed or retrofitted to operate with hydrogen either exclusively or in combination with other fuels. The goal is to ensure that these facilities can adapt to the growing availability of hydrogen and seamlessly transition from conventional fuels without significant additional modifications.

By setting such requirements, Germany aims to stimulate the development of technologies that can handle hydrogen’s unique properties and ensure that the infrastructure is future-proofed. This includes addressing challenges related to hydrogen storage, transportation, and combustion, and exploring concepts like storing electricity in natural gas pipes for system flexibility.

Strategic Implications for Germany

Germany’s call for hydrogen-ready power plants has several strategic implications. First and foremost, it aligns with the country’s broader energy strategy, which emphasizes the need for a transition from fossil fuels to cleaner alternatives, building on its decision to phase out coal and nuclear domestically. As part of its commitment to the Paris Agreement and its own climate action plans, Germany has set ambitious targets for reducing greenhouse gas emissions and increasing the share of renewable energy in its energy mix.

Hydrogen plays a crucial role in this strategy, particularly for sectors where direct electrification is challenging. For instance, heavy industry and certain industrial processes, such as green steel production, require high-temperature heat that is difficult to achieve with electricity alone. Hydrogen can fill this gap, providing a cleaner alternative to natural gas and coal.

Moreover, this initiative helps Germany bolster its leadership in green technology and innovation. By investing in hydrogen infrastructure, Germany positions itself as a pioneer in the global energy transition, potentially influencing international standards and practices. The development of hydrogen-ready power plants also opens up new economic opportunities, including job creation in engineering, construction, and technology sectors.

Challenges and Opportunities

While the push for hydrogen-ready power plants presents significant opportunities, it also comes with challenges. Hydrogen production, especially green hydrogen produced from renewable sources, remains relatively expensive compared to conventional fuels. Scaling up production and reducing costs are critical for making hydrogen a viable alternative for widespread use.

Furthermore, integrating hydrogen into existing power infrastructure, alongside electricity grid expansion, requires careful planning and investment. Issues such as retrofitting existing plants, ensuring safe handling of hydrogen, and developing efficient storage and transportation systems must be addressed.

Despite these challenges, the long-term benefits of hydrogen integration are substantial, and a net-zero roadmap indicates electricity costs could fall by a third. Hydrogen can enhance energy security, reduce reliance on imported fossil fuels, and support global climate goals. For Germany, this initiative is a step towards realizing its vision of a sustainable, low-carbon energy system.

Conclusion

Germany’s call for hydrogen-ready power plants is a forward-thinking move that reflects its commitment to sustainability and innovation. By encouraging the development of infrastructure capable of using hydrogen, Germany is taking a significant step towards a cleaner energy future. While challenges remain, the strategic focus on hydrogen underscores Germany’s leadership in the global transition to a low-carbon economy. As the world grapples with the urgent need to address climate change, Germany’s approach serves as a model for integrating emerging technologies into national energy strategies.


Related News

View more

Sign Up for Electricity Forum’s Newsletter

Stay informed with our FREE Newsletter — get the latest news, breakthrough technologies, and expert insights, delivered straight to your inbox.

Electricity Today T&D Magazine Subscribe for FREE

Stay informed with the latest T&D policies and technologies.
  • Timely insights from industry experts
  • Practical solutions T&D engineers
  • Free access to every issue

Live Online & In-person Group Training

Advantages To Instructor-Led Training – Instructor-Led Course, Customized Training, Multiple Locations, Economical, CEU Credits, Course Discounts.

Request For Quotation

Whether you would prefer Live Online or In-Person instruction, our electrical training courses can be tailored to meet your company's specific requirements and delivered to your employees in one location or at various locations.