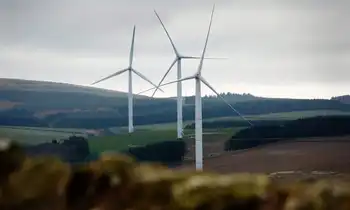
Turbine shortage to leave some Scottish communities in the dark

By The Observer


High Voltage Maintenance Training Online

Our customized live online or in‑person group training can be delivered to your staff at your location.

  • Live Online
  • 12 hours Instructor-led
  • Group Training Available
Regular Price:
$599
Coupon Price:
$499
Reserve Your Seat Today
A worldwide shortage of wind-turbines has been caused by a sudden surge in demand and the frenzied industrial growth of China creating delivery delays that could take years to rectify.

Plans to cut carbon dioxide emissions and meet more of Britain's energy needs by an expansion of offshore wind farms have had to be revised, because experts now believe the chances of building them before 2010 at the earliest is unlikely.

“There is a worldwide shortage of wind turbines,” said Dr Gordon Edge, director of economics and markets at the British Wind Energy Association, who claimed that a recent series of tax credits introduced in the US for the American wind power industry had sparked a construction boom.

“The US industry is going hell for leather at the moment and relying on imports of wind turbines from Europe. All new projects are having to negotiate a long time in advance. People are ordering turbines now for delivery in 2009 and smaller players with not so much market power are losing out even more. Globally, it's going to take two or three years for us to catch up with demand.”

There are now 1,866 turbines in operation at 148 sites in the UK, with an additional 352 sites either under construction or planned. For many rural communities in Scotland and the rest of the UK, wind farms have long been seen as a potential economic boom and several small communities have set up their own projects.

The island of Gigha is often held up as an example of how small communities can cash in on the natural resource of wind power. Since organising a community buyout of the island, its population has increased by more than 50 per cent, reversing 300 years of decline. Several new businesses have been started up, including Gigha Renewable Energy - a small wind farm that generates more than enough electricity for the island and sells the rest to the National Grid for about £100,000 a year.

Many other Scottish communities followed suit but, as the clamour for turbines increases, the dream of self-sufficiency is in the doldrums as supply is outstripped by demand.

At least four communities in the Highlands and Islands have put their plans for self-sufficiency on hold as manufacturers ignore their pleas for turbines in favour of bigger, more lucrative contracts.

“A lot of the turbine manufacturers won't even talk to small community projects looking for just one, two or three turbines,” said Ian McLean, of Renewable Devices Energy Solutions, an Edinburgh-based company that has been involved in the development of about a dozen small wind farms.

“Costs have gone up dramatically because of the Chinese buying up all the raw materials and the US snapping up every turbine they can get their hands on. Unless you are a big developer looking to buy a lot of turbines in one go, most big manufacturers aren't interested.”

The Highlands and Islands Community Energy Company is assisting 28 local energy schemes and trying to combine orders so that they can negotiate more easily with manufacturers. According to David Stephenson, chairman of Westray Renewable Energy, a turbine costing about £700,000 could bring in an estimated £3m-£4m over 20 years and help communities become self-sufficient.

However, despite planning permission and the offer of a grid connection, the island can't find any manufacturer willing to supply it with a single turbine.

“Unfortunately we have been hoist by our own successful global petard. A number of factors have conspired against us,” said a spokeswoman for the British Wind Energy Association.

Related News

Wind Power Surges in U.S. Electricity Mix

U.S. Wind Power 2025 drives record capacity additions, with FERC data showing robust renewable energy growth, IRA incentives, onshore and offshore projects, utility-scale generation, grid integration, and manufacturing investment boosting clean electricity across key states.


Key Points

Overview of record wind additions, IRA incentives, and grid expansion defining the U.S. clean electricity mix in 2025.

✅ FERC: 30.1% of new U.S. capacity in Jan 2025 from wind

✅ Major projects: Cedar Springs IV, Boswell, Prosperity, Golden Hills

✅ IRA incentives drive onshore, offshore builds and manufacturing


In early 2025, wind power has significantly strengthened its position in the United States' electricity generation portfolio. According to data from the Federal Energy Regulatory Commission (FERC), wind energy accounted for 30.1% of the new electricity capacity added in January 2025, and as the most-used renewable source in the U.S., it also surpassed the previous record set in 2024. This growth is attributed to substantial projects such as the 390.4 MW Cedar Springs Wind IV and the 330.0 MW Boswell Wind Farm in Wyoming, along with the 300.0 MW Prosperity Wind Farm in Illinois and the 201.0 MW Golden Hills Wind Farm Expansion in Oregon. 

The expansion of wind energy capacity is part of a broader trend where solar and wind together accounted for over 98% of the new electricity generation capacity added in the U.S. in January 2025. This surge is further supported by the federal government's Inflation Reduction Act (IRA) and broader policy support for renewables, which has bolstered incentives for renewable energy projects, leading to increased investments and the establishment of new manufacturing facilities. 

By April 2025, clean electricity sources, including wind and solar, were projected to surpass 51% of total utility-scale electricity generation in the U.S., building on a 25.5% renewable share seen in recent data, marking a significant milestone in the nation's energy transition. This achievement is attributed to a combination of factors: a seasonal drop in electricity demand during the spring shoulder season, increased wind speeds in key areas like Texas, and higher solar production due to longer daylight hours and expanded capacity in states such as California, Arizona, and Nevada, supported by record installations across the solar and storage industry. 

Despite a 7% decline in wind power production in early April compared to the same period in 2024—primarily due to weaker wind speeds in regions like Texas—the overall contribution of wind energy remained robust, supported by an 82% clean-energy pipeline that includes wind, solar, and batteries. This resilience underscores the growing reliability of wind power as a cornerstone of the U.S. electricity mix. 

Looking ahead, the U.S. Department of Energy projects that wind energy capacity will continue to grow, with expectations of adding between 7.3 GW and 9.9 GW in 2024, and potentially increasing to 14.5 GW to 24.8 GW by 2028. This growth is anticipated to be driven by both onshore and offshore wind projects, with onshore wind representing the majority of new additions, continuing a trajectory since surpassing hydro capacity in 2016 in the U.S.

Early 2025 has witnessed a notable increase in wind power's share of the U.S. electricity generation mix. This trend reflects the nation's ongoing commitment to expanding renewable energy sources, especially after renewables surpassed coal in 2022, supported by favorable policies and technological advancements. As the U.S. continues to invest in and develop wind energy infrastructure, the role of wind power in achieving a cleaner and more sustainable energy future becomes increasingly pivotal.


Related News

View more

Switch from fossil fuels to electricity could cost $1.4 trillion, Canadian Gas Association warns

Canada Electrification Costs: report estimates $580B-$1.4T to scale renewable energy, wind, solar, and storage capacity to 2050, shifting from natural gas toward net-zero emissions and raising average household energy spending by $1,300-$3,200 annually.


Key Points

Projected national expense to expand renewables and electrify energy systems by 2050, impacting household energy bills.

✅ $580B-$1.4T forecast for 2020-2050 energy transition

✅ 278-422 GW wind, solar, storage capacity by 2050

✅ Household costs up $1,300-$3,200 per year on average


The Canadian Gas Association says building renewable electricity capacity to replace just half of Canada's current fossil fuel-generated energy, a shift with significant policy implications for grids across provinces, could increase national costs by as much as $1.4 trillion over the next 30 years.

In a report, it contends, echoing an IEA report on net-zero, that growing electricity's contribution to Canada's energy mix from its current 19 per cent to about 60 per cent, a step critical to meeting climate pledges that policymakers emphasize, will require an expansion from 141 gigawatts today to between 278 and 422 GW of renewable wind, solar and storage capacity by 2050.

It says that will increase national energy costs by between $580 billion and $1.4 trillion between 2020 and 2050, a projection consistent with recent reports of higher electricity prices in Alberta amid policy shifts, translating into an average increase in Canadian household spending of $1,300 to $3,200 per year.

The study, prepared by consulting firm ICF for the association, assumes electrification begins in 2020 and is applied in all feasible applications by 2050, with investments in the electricity system, guided by the implications of decarbonizing the grid for reliability and cost, proceeding as existing natural gas and electric end use equipment reaches normal end of life.

Association CEO Tim Egan says the numbers are "pretty daunting" and support the integration of natural gas with electric, amid Canada's race to net-zero commitments, instead of using an electric-only option as the most cost-efficient way for Canada to reach environmental policy goals.

But Keith Stewart, senior energy strategist with Greenpeace Canada, says scientists are calling for the world to get to net-zero emissions by 2050, and Canada's net-zero by 2050 target underscores that urgency to avoid "catastrophic" levels of warming, so investing in natural gas infrastructure to then shut it down seems a "very expensive option."


Related News

View more

U.S. Residents Averaged Fewer Power Outages in 2022

2022 U.S. Power Outage Statistics show lower SAIDI as fewer major events hit, with SAIFI trends, electric reliability, outage duration and frequency shaped by hurricanes, winter storms, vegetation, and utility practices across states.


Key Points

They report SAIDI and SAIFI for 2022, showing outage duration, frequency, and impacts of major weather events.

✅ 2022 SAIDI averaged 5.6 hours; SAIFI averaged 1.4 interruptions.

✅ Fewer major events lowered outage duration versus 2021.

✅ Hurricanes and winter storms drove long outages in several states.


In 2022, U.S. electricity consumers on average experienced about 5.5 hours of power disruptions, a decrease from nearly two hours compared to 2021. This information comes from the latest Annual Electric Power Industry Report. The reduction in yearly power interruptions primarily resulted from fewer significant events in 2022 compared to the previous year, and utility disaster planning continues to support grid resilience as severe weather persists.

Since 2013, excluding major events, the annual average duration of power interruptions has consistently hovered around two hours. Factors contributing to major power disruptions include weather-related incidents, vegetation interference near power lines, and specific utility practices, while pandemic-related grid operations influenced workforce planning more than outage frequency. To assess the reliability of U.S. electric utilities, two key indexes are utilized:

  • The System Average Interruption Duration Index (SAIDI) calculates the total length (in hours) an average customer endures non-brief power interruptions over a year.
  • The System Average Interruption Frequency Index (SAIFI) tracks the number of times interruptions occur.

The influence of major events on electrical reliability is gauged by comparing affected states' SAIDI and SAIFI values against the U.S. average, which was 5.6 hours of outages and 1.4 outages per customer in 2022. The year witnessed 18 weather-related disasters in the U.S., each resulting in over $1 billion in damages, and COVID-19 grid assessments indicated the electricity system was largely safe from pandemic impacts. Noteworthy major events include:

  • Hurricane Ian in September 2022, leaving over 2.6 million Floridian customers without electricity, with restoration in some areas taking weeks rather than days.
  • Hurricane Nicole in November 2022, causing over 300,000 Florida customers to lose power.
  • Winter Storm Elliott in December 2022, affecting over 1.5 million customers in multiple states including Texas where utilities struggled after Hurricane Harvey to restore service, and Florida, and bringing up to four feet of snow in parts of New York.

In 2022, states like Florida, West Virginia, Maine, Vermont, and New Hampshire experienced the most prolonged power interruptions, with New Hampshire averaging 10.3 hours and Florida 19.1 hours, and FPL's Irma storm response illustrates how restoration can take days or weeks in severe cases. Conversely, the District of Columbia, Delaware, Rhode Island, Nebraska, and Iowa had the shortest total interruptions, with the District of Columbia averaging just 34 minutes and Iowa 85 minutes.

The frequency of outages, unlike their duration, is more often linked to non-major events. Across the nation, Alaska recorded the highest number of power disruptions per customer (averaging 3.5), followed by several heavily forested states like Tennessee and Maine. Power outages due to falling tree branches are common, particularly during winter storms that burden tree limbs and power lines, as seen in a North Seattle outage affecting 13,000 customers. The District of Columbia stood out with the shortest and fewest outages per customer.


Related News

View more

Doug Ford ‘proud’ of decision to tear up hundreds of green energy contracts

Ontario Renewable Energy Cancellations highlight Doug Ford's move to scrap wind turbine contracts, citing electricity rate relief and taxpayer savings, while critics, the NDP, and industry warn of job losses, termination fees, and auditor scrutiny.


Key Points

Ontario's termination of renewable contracts, defended as cost and rate relief, faces disputes over savings and jobs.

✅ PCs cite electricity rate relief and taxpayer savings.

✅ Critics warn of job losses and termination fees.

✅ Auditor inquiry sought into contract cancellation costs.


Ontario Premier Doug Ford, whose new stance on wind power has drawn attention, said Thursday he is “proud” of his decision to tear up hundreds of renewable energy deals, a move that his government acknowledges could cost taxpayers more than $230 million.

Ford dismissed criticism that his Progressive Conservatives are wasting public money, telling a news conference that the cancellation of 750 contracts signed by the previous Liberal government will save cash, even as Ontario moves to reintroduce renewable energy projects in the coming years.

“I’m so proud of that,” Ford said of his decision. “I’m proud that we actually saved the taxpayers $790 million when we cancelled those terrible, terrible, terrible wind turbines that really for the last 15 years have destroyed our energy file.”

Later Thursday, Ford went further in defending the cancelled contracts, saying “if we had the chance to get rid of all the wind mills we would,” though a court ruling near Cornwall challenged such cancellations.

The NDP first reported the cost of the cancellations Tuesday, saying the $231 million figure was listed as “other transactions”, buried in government documents detailing spending in the 2018-2019 fiscal year.

The Progressive Conservatives have said the final cost of the cancellations, which include the decommissioning of a wind farm already under construction in Prince Edward County, Ont., has yet to be established, amid warnings about wind project cancellation costs from developers.

The government has said it tore up the deals because the province didn’t need the power and it was driving up electricity rates, and the decision will save millions over the life of the contracts. Industry officials have disputed those savings, saying the cancellations will just mean job losses for small business, and ignore wind power’s growing competitiveness in electricity markets.

NDP Leader Andrea Horwath has asked Ontario’s auditor general to investigate the contracts and their termination fees, amid debates over Ontario’s electricity future among leadership contenders. She called Ford’s remarks on Thursday “ridiculous.”

“Every jurisdiction around the world is trying to figure out how to bring more renewables onto their electricity grids,” she said. “This government is taking us backwards and costing us at the very least $231 million in tearing these energy contracts.”

At the federal level, a recent green electricity contract with an Edmonton company underscores that shift.


Related News

View more

Spent fuel removal at Fukushima nuclear plant delayed up to 5 years

Fukushima Daiichi decommissioning delay highlights TEPCO's revised timeline, spent fuel removal at Units 1 and 2, safety enclosures, decontamination, fuel debris extraction by robot arm, and contaminated water management under stricter radiation control.


Key Points

A government revised schedule pushing back spent fuel removal and decommissioning milestones at Fukushima Daiichi.

✅ TEPCO delays spent fuel removal at Units 1 and 2 for safety.

✅ Enclosures, decontamination, and robotics mitigate radioactive risk.

✅ Contaminated water cut target: 170 tons/day to 100 by 2025.


The Japanese government decided Friday to delay the removal of spent fuel from the Fukushima Daiichi nuclear power plant's Nos. 1 and 2 reactors by as much as five years, casting doubt on whether it can stick to its timeframe for dismantling the crippled complex.

The process of removing the spent fuel from the units' pools had previously been scheduled to begin in the year through March 2024.

In its latest decommissioning plan, the government said the plant's operator, Tokyo Electric Power Company Holdings Inc., will not begin the roughly two-year process (a timeline comparable to major reactor refurbishment programs seen worldwide) at the No. 1 unit at least until the year through March 2028 and may wait until the year through March 2029.

Work at the No. 2 unit is now slated to start between the year through March 2025 and the year through March 2027, it said.

The delay is necessary to take further safety precautions such as the construction of an enclosure around the No. 1 unit to prevent the spread of radioactive dust, and decontamination of the No. 2 unit, even as authorities have begun reopening previously off-limits towns nearby, the government said. It is the fourth time it has revised its schedule for removing the spent fuel rods.

"It's a very difficult process and it's hard to know what to expect. The most important thing is the safety of the workers and the surrounding area," industry minister Hiroshi Kajiyama told a press conference.

The government set a new goal of finishing the removal of the 4,741 spent fuel rods across all six of the plant's reactors by the year through March 2032, amid ongoing debates about the consequences of early nuclear plant closures elsewhere.

Plant operator TEPCO has started the process at the No. 3 unit and already finished at the No. 4 unit, which was off-line for regular maintenance at the time of the disaster. A schedule has yet to be set for the Nos. 5 and 6 reactors.

While the government maintained its overarching timeframe of finishing the decommissioning of the plant 30 to 40 years from the 2011 crisis triggered by a magnitude 9.0 earthquake and tsunami, there may be further delays, even as milestones at other nuclear projects are being reached worldwide.

The government said it will begin removing fuel debris from the three reactors that experienced core meltdowns in the year through March 2022, starting with the No. 2 unit as part of broader reactor decommissioning efforts.

The process, considered the most difficult part of the decommissioning plan, will involve using a robot arm, reflecting progress in advanced reactors technologies, to initially remove small amounts of debris, moving up to larger amounts.

The government also said it will aim to reduce the pace at which contaminated water at the plant increases. Water for cooling the melted cores, mixed with underground water, amounts to around 170 tons a day. That number will be brought down to 100 tons by 2025, it said.

The water is being treated to remove the most radioactive materials and stored in tanks on the plant's grounds, but already more than 1 million tons has been collected and space is expected to run out by the summer of 2022.


Related News

View more

Next Offshore Wind in U.S. Can Compete With Gas, Developer Says

Offshore Wind Cost Competitiveness is rising as larger turbines boost megawatt output, cut LCOE, and trim maintenance and installation time, enabling projects in New England to rival natural gas pricing while scaling reliably.


Key Points

It describes how larger offshore turbines lower LCOE and O&M, making U.S. projects price competitive with natural gas.

✅ Larger turbines boost MW output and reduce LCOE.

✅ Lower O&M and faster installation cut lifecycle costs.

✅ Competes with gas in New England bids, per BNEF.


Massive offshore wind turbines keep getting bigger, as projects like the biggest UK offshore wind farm come online, and that’s helping make the power cheaper — to the point where developers say new projects in U.S. waters can compete with natural gas.

The price “is going to be a real eye-opener,” said Bryan Martin, chairman of Deepwater Wind LLC, which won an auction in May to build a 400-megawatt wind farm southeast of Rhode Island.

Deepwater built the only U.S. offshore wind farm, a 30-megawatt project that was completed south of Block Island in 2016. The company’s bid was selected by Rhode Island the same day that Massachusetts picked Vineyard Wind to build an 800-megawatt wind farm in the same area, while international investors such as Japanese utilities in UK projects signal growing confidence.

#google#

Bigger turbines that make more electricity have cut the cost per megawatt by about half, a trend aided by higher-than-expected wind potential in many markets, said Tom Harries, a wind analyst at Bloomberg New Energy Finance. That also reduces maintenance expenses and installation time. All of this is helping offshore wind vie with conventional power plants.

“You could not build a thermal gas plant in New England for the price of the wind bids in Massachusetts and Rhode Island,” Martin said Friday at the U.S. Offshore Wind Conference in Boston. “It’s very cost-effective for consumers.”

The Massachusetts project could be about $100 to $120 a megawatt hour, according to a February estimate from Harries, though recent UK price spikes during low wind highlight volatility. The actual prices there and in Rhode Island weren’t disclosed.

For comparison, a new U.S. combine-cycle gas turbine ranges from $40 to $60 a megawatt-hour, and a new coal plant is $67 to $113, according to BNEF data.


A new power plant in land-constrained New England would probably be higher than that, and during winter peaks the region has seen record oil-fired generation in New England that underscores reliability concerns. More importantly, gas plants get a significant portion of their revenue from being able to guarantee that power is always available, something wind farms can’t do, said William Nelson, a New York-based analyst with BNEF. Looking only at the price at which offshore turbines can deliver electricity is a “narrow mindset,” he said.


Related News

View more

Sign Up for Electricity Forum’s Newsletter

Stay informed with our FREE Newsletter — get the latest news, breakthrough technologies, and expert insights, delivered straight to your inbox.

Electricity Today T&D Magazine Subscribe for FREE

Stay informed with the latest T&D policies and technologies.
  • Timely insights from industry experts
  • Practical solutions T&D engineers
  • Free access to every issue

Download the 2025 Electrical Training Catalog

Explore 50+ live, expert-led electrical training courses –

  • Interactive
  • Flexible
  • CEU-cerified