Ukraine Power Grid Restoration accelerates across liberated Kharkiv, restoring electricity, heat, and water amid missile and drone strikes, demining operations, blackouts, and winterization efforts, showcasing resilience, emergency repairs, and critical infrastructure recovery.
Key Points
Ukraine's rapid push to repair war-damaged grids, restore heat and water, and stabilize key services before winter.
✅ Priority repairs restore electricity and water in liberated Kharkiv.
✅ Crews de-mine lines and work under shelling, drones, and missiles.
✅ Winterization adds generators, mobile stoves, and large firewood supplies.
On the freshly liberated battlefields of northeast Ukraine, a pile of smashed glass windows outside one Soviet-era block of apartments attests to the violence of six months of Russian occupation, and of Ukraine’s sweeping recent military advances.
Indoors, in cramped apartments, residents lived in the dark for weeks on end.
Now, with a hard winter looming, they marvel at the speed and urgency with which Ukrainian officials have restored another key ingredient to their survival: electric power, a critical effort to keep the lights on this winter across communities.
Among those things governments strive to provide are security, opportunity, and minimal comfort. With winter approaching, and Russia targeting Ukraine’s infrastructure, add to that list heat and light, even as Russia hammers power plants nationwide. It’s requiring a concerted effort.
“Thank God it works! Electricity is civilization – it is everything,” says Antonina Krasnokutska, a retired medical worker, looking affectionately at the lightbulb that came on the day before, and now burns again in her tiny spotless kitchen.
“Without electricity there is no TV, no news, no clothes washing, no charging the phone,” says Ms. Krasnokutska, her gray hair pulled back and a small crucifix around her neck.
“Before, it was like living in the Stone Age,” says her grown son, Serhii Krasnokutskyi, who is more than a head taller. “As soon as it got dark, everyone would go to sleep.”
He shows a picture on his phone from a few days earlier, of a tangle of phone and computer charging cables – including his – plugged in at a local shop with a generator.
“We are very grateful for the people who repaired this electricity, even with shelling continuing,” he says. “They have a very complicated job.”
Indeed, although a lack of power might have been a novel inconvenience during the warm summer season, it increasingly has become a matter of great urgency for Ukrainian citizens and officials.
Coping through Ukraine’s winter with dignity and any degree of security will require courage and perseverance, as the severity and suffering that the season can bring here are being weaponized by Russia, as it seeks to compensate for a string of battlefield losses.
In recent days, Russian attacks have specifically targeted Ukraine’s electrical and other civilian infrastructure – all with the apparent aim of making this winter as hard as possible for Ukrainians, even as Moscow employs other measures to spread the hardship across Europe, while Ukraine helps Spain amid blackouts through grid support.
Ukrainian President Volodymyr Zelenskyy said Monday that Russian barrages across the country with missiles and Iran-supplied kamikaze drones had destroyed 30% of Ukraine’s power stations in the previous eight days, including strikes on western Ukraine that caused outages. Thousands of towns have been left without electricity.
Kharkiv’s challenges
Emblematic of the national challenge is the one facing officials in the northeast Kharkiv region, where Ukraine recaptured more than 3,000 square miles in a September counteroffensive. Ukrainian forces are still making gains on that front, as well as in the south toward Kherson, where Wednesday Russia started evacuating civilians from the first major city it occupied, after launching its three-pronged invasion last February.
Across the Kharkiv region, Ukrainians are stockpiling as much wood, fuel, and food as possible while they still can, and adopting new energy solutions as they prepare, from sources as diverse as the floorboards of destroyed schools and the pine forests in Izium, which are pockmarked with abandoned Russian trenches adjacent to a mass burial site.
“Of course, we have this race against time,” says Serhii Mahdysyuk, the Kharkiv regional director in charge of housing, services, fuel, and energy. “Unfortunately, we probably stand in front of the biggest challenge in Ukraine.”
That is not only because of the scale of liberated territory, he says, but also because the Kharkiv region shares a long border with Russia, as well as with the Russian-controlled areas of the eastern Donbas.
“It’s a great mixture of all threats, and we are sure that shelling and bombings will continue, but we are ready for this,” says Mr. Mahdysyuk. “We know our weak spots that Russia can destroy, but we are prepared for what to do in these situations.”
Ukraine’s battlefield gains have meant a surging need to pick up the pieces after Russian occupation, even as electricity reserves are holding if no new strikes occur, to ensure habitable conditions as more and more surviving residents require services, and as others return to scenes of devastation.
Restoring electricity is the top priority, amid shifting international assistance such as the end of U.S. grid support, because that often restarts running water, too, says Mr. Mahdysyuk. But before that, the area beneath broken power lines must be de-mined.
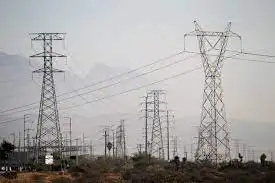
Indeed, members of an electricity team reconnecting cables on the outskirts of Balakliia – one of the first towns to see power restored, at the end of September – say they lost two fellow workers in the previous two weeks. One died after stepping on an anti-personnel mine, another when his vehicle hit an anti-tank device.
Ukrainian electricity workers restore power lines damaged during six months of Russian military occupation in Balakliia, Ukraine, Sept. 29, 2022. Ukrainians in liberated territory say the restoration of the electrical grid, and with it often the water supply, is a return to civilization.
“For now, our biggest problem is mines,” says the team leader, who gave the name Andrii. “It’s fine within the cities, but in the fields it’s a disaster because it’s very difficult to see them. There is a lot of [them] around here – it will take years and years to get rid of.”
Yet officials only have a few weeks to execute plans to provide for hundreds of thousands of residents in this region, in their various states of need and distress. Some 50 field kitchens capable of feeding 200 to 300 people each have been ordered. Another 1,000 mobile stoves are on their way.
And authorities will provide nearly 200,000 cubic yards of firewood for those who have no access to it, and may have no other means of keeping warm – or where shelling continues to disrupt repairs, says Mr. Mahdysyuk.
“The level of opportunity and resources we have is not the same as the level of destruction,” he says. People in districts and buildings too destroyed to have services restored soon, such as in Saltivka in Kharkiv city, may be moved.
Related News