Heat wave has plans to stay awhile

By McClatchy Tribune News


NFPA 70e Training

Our customized live online or in‑person group training can be delivered to your staff at your location.

  • Live Online
  • 6 hours Instructor-led
  • Group Training Available
Regular Price:
$199
Coupon Price:
$149
Reserve Your Seat Today
A searing stretch of hot, dry weather, coupled with rising water use, could prolong a drought that's far from over.

Forecasters said that the Charlotte area faces at least another week of temperatures in the 90s. Highs normally reach only the mid-80s this time of year. The June 5 high reached 95 degrees at Charlotte/Douglas International Airport, the warmest reading so far this year.

Highs were in the middle to upper 90s today across the Piedmont and South Carolina.

Highs for the next eight days are forecast between 96 a d 98 degrees. Forecasters see little or no chance of rainfall in the area through at least June 11. Some computer models show the heat wave continuing for at least 10 days.

A heat advisory was issued June 6 in the Sandhills, where the heat index - a combination of heat and dewpoint temperatures - is forecast to reach 105 degrees. Anson, Richmond and Scotland counties of North Carolina and Chesterfield County in South Carolina are included in that advisory.

Heat index readings climbed above 100 the past few days. Forecasters also are predicting Code Orange ozone levels. Code Orange ozone levels are potentially unhealthy for asthmatics, children and seniors.

Charlotte-Mecklenburg Utilities customers promptly broke June's daily conservation goal by pumping 128 million gallons on Sunday. The surge was predictable as gardeners water blooming shrubs and vegetable patches, said conservation coordinator Maeneen Klein.

Mandatory water restrictions allow lawn watering only one day a week, but drip irrigation and hoses can be used anytime. "As long as people are following the rules and putting water where it's needed the most, we think it's a sustainable practice," she said.

Klein credits customers for taking conservation to heart. This month's 115 million-gallon-a-day goal compares to the 141 million gallons Charlotteans averaged last June, before restrictions took hold.

A drought-advisory group for the Catawba River basin, which in early April recommended utilities resume limited lawn irrigation, will review conditions again on June 25. The roots of this drought trace to May 2007, the first in a string of dry months that lasted until December. Conditions improved through the winter and spring but turned dry again last month.

Mecklenburg and its neighbors are among 28 N.C. counties still in extreme drought. Only 11 counties had been that dry in late April. Charlotte's rainfall deficit since January is 3.6 inches, but the past 12 months have been the driest June-to-June on record in the southern Piedmont.

Still, federal forecasters expect the drought in the Carolinas' western halves to improve through August. Three-month forecasts predict neither unusually high nor low summer temperatures and rainfall. The region's major water supplies are also faring better than they did last year.

As the drought deepened, Duke Energy resisted estimating how many days' water was left in its Catawba reservoirs, saying projections would probably be wrong. Some critics complained that local utilities, guided by the newly created drought group, were too slow to restrict water use. This year lakes on both the Catawba, Charlotte's water source, and the Yadkin River to the east are near or above targeted levels.

To save water, Duke began cutting back use of its hydroelectric plants last summer, generating 58 percent less hydro power this January through May than in the same period last year. Duke could also draw down its largest reservoir, Lake Norman, by nearly 3 extra feet if needed this year because of changes to the cooling-water piping at its McGuire nuclear plant.

But streams that feed the Catawba lakes are at only 46 percent of their long-term averages, compared to 89 percent a year ago. Groundwater still hasn't recovered. Rising temperatures also mean more water lost to evaporation: up to 300 million gallons from the Catawba reservoirs on a single hot day.

"Conservation is just as important as it was last year," said Duke spokeswoman Marilyn Lineberger.

Related News

How Energy Use Has Evolved Throughout U.S. History

U.S. Energy Transition traces the shift from coal and oil to natural gas, nuclear power, and renewables like wind and solar, driven by efficiency, grid modernization, climate goals, and economic innovation.


Key Points

The U.S. Energy Transition is the shift from fossil fuels to cleaner power, driven by tech, policy, and markets.

✅ Shift from coal and oil to gas, nuclear, wind, and solar

✅ Enabled by grid modernization, storage, and efficiency

✅ Aims to cut emissions while ensuring reliability and affordability


The evolution of energy use in the United States is a dynamic narrative that reflects technological advancements, economic shifts, environmental awareness, and societal changes over time. From the nation's early reliance on wood and coal to the modern era dominated by oil, natural gas, and renewable sources, the story of energy consumption in the U.S. is a testament to innovation and adaptation.

Early Energy Sources: Wood and Coal

In the early days of U.S. history, energy needs were primarily met through renewable resources such as wood for heating and cooking. As industrialization took hold in the 19th century, coal emerged as a dominant energy source, fueling steam engines and powering factories, railways, and urban growth. The widespread availability of coal spurred economic development and shaped the nation's infrastructure.

The Rise of Petroleum and Natural Gas

The discovery and commercialization of petroleum in the late 19th century transformed the energy landscape once again. Oil quickly became a cornerstone of the U.S. economy, powering transportation, industry, and residential heating, and informing debates about U.S. energy security in policy circles. Concurrently, natural gas emerged as a significant energy source, particularly for heating and electricity generation, as pipelines expanded across the country.

Electricity Revolution

The 20th century witnessed a revolution in electricity generation and consumption, and understanding where electricity comes from helps contextualize how systems evolved. The development of hydroelectric power, spurred by projects like the Hoover Dam and Tennessee Valley Authority, provided clean and renewable energy to millions of Americans. The widespread electrification of rural areas and the proliferation of appliances in homes and businesses transformed daily life and spurred economic growth.

Nuclear Power and Energy Diversification

In the mid-20th century, nuclear power emerged as a promising alternative to fossil fuels, promising abundant energy with minimal greenhouse gas emissions. Despite concerns about safety and waste disposal, nuclear power plants became a significant part of the U.S. energy mix, providing a stable base load of electricity, even as the aging U.S. power grid complicates integration of variable renewables.

Renewable Energy Revolution

In recent decades, the U.S. has seen a growing emphasis on renewable energy sources such as wind, solar, and geothermal power, yet market shocks and high fuel prices alone have not guaranteed a rapid green revolution, prompting broader policy and investment responses. Advances in technology, declining costs, and environmental concerns have driven investments in clean energy infrastructure and policies promoting renewable energy adoption. States like California and Texas lead the nation in wind and solar energy production, demonstrating the feasibility and benefits of transitioning to sustainable energy sources.

Energy Efficiency and Conservation

Alongside shifts in energy sources, improvements in energy efficiency and conservation have played a crucial role in reducing per capita energy consumption and greenhouse gas emissions. Energy-efficient appliances, building codes, and transportation innovations have helped mitigate the environmental impact of energy use while reducing costs for consumers and businesses, and weather and economic factors also influence demand; for example, U.S. power demand fell in 2023 on milder weather, underscoring the interplay between efficiency and usage.

Challenges and Opportunities

Looking ahead, the U.S. faces both challenges and opportunities in its energy future, as recent energy crisis effects ripple across electricity, gas, and EVs alike. Addressing climate change requires further investments in renewable energy, grid modernization, and energy storage technologies. Balancing energy security, affordability, and environmental sustainability remains a complex task that requires collaboration between government, industry, and society.

Conclusion

The evolution of energy use throughout U.S. history reflects a continuous quest for innovation, economic growth, and environmental stewardship. From wood and coal to nuclear power and renewables, each era has brought new challenges and opportunities in meeting the nation's energy needs. As the U.S. transitions towards a cleaner and more sustainable energy future, leveraging technological advancements and embracing policy solutions, amid debates over U.S. energy dominance, will be essential in shaping the next chapter of America's energy story.


Related News

View more

Texas Utilities back out of deal to create smart home electricity networks

Smart Meter Texas real-time pricing faces rollback as utilities limit on-demand reads, impacting demand response, home area networks, ERCOT wholesale tracking, and thermostat automation, reducing efficiency gains promised through deregulation and smart meter investments.


Key Points

A plan linking smart meters to ERCOT prices, enabling near real-time usage alignment and automated demand response.

✅ Twice-hourly reads miss 15-minute ERCOT price spikes.

✅ Less than 1% of 7.3M meters use HAN real-time features.

✅ Limits hinder automation for HVAC, EV charging, and pool pumps.


Utilities made a promise several years ago when they built Smart Meter Texas that they’d come up with a way for consumers to monitor their electricity use in real time. But now they’re backing out of the deal with the approval of state regulators, leaving in the lurch retail power companies that are building their business model on the promise of real time pricing and denying consumers another option for managing their electricity costs.

Texas utilities collected higher rates to finance the building of a statewide smart meter network that would allow customers to track their electricity use and the quickly changing prices on wholesale power markets almost as they happened. Some retailers are building electricity plans around this promise, providing customers with in-home devices that would eventually track pricing minute-by-minute and allow them to automatically turn down or shut off air conditioners, pool pumps and energy sucking appliances when prices spiked on hot summer afternoons and turn them back on when they prices fell again.

The idea is to help save consumers money by allowing them to shift their electricity consumption to periods when power is cheaper, typically nights and weekends, even as utility revenue in a free-power era remains a debated topic.

“We’re throwing away a large part of (what) ratepayers paid for,” said John Werner, CEO of GridPlus Texas, one of the companies offering consumers a real-time pricing plan that is scheduled to begin testing next month. “They made the smart meters dumb meters.”

When Smart Meter Texas was launched a decade ago by a consortium of the state’s biggest utilities, it was considered an important part of deregulation. The competitive market for electricity held the promise that consumers would eventually have the technology to control their electricity use through a home area network and cut their power bills.

Regulators and legislators also were enticed by the possibility of making the electric system more efficient and relieving pressure on the power grid as consumers responded to high prices and cut consumption when temperatures soared, with ongoing discussions about Texas grid reliability informing policy choices.

One study found that smart meters coupled with smart real time consumption monitors could reduce electricity use between 3 percent and 5 percent, according to Call Me Power, a website sponsored by the European electricity price shopping service Selectra.

But utilities complained that the home area network devices were expensive to install and not used very often, and, with flat electricity demand weighing on growth, they questioned further investment. CenterPoint manager Esther Floyd Kent filed an affidavit with the commission in May that it costs the utility about $30,000 annually to support the network devices, plus maintenance.

Over a six-year period, CenterPoint paid $124,500, or about $20,000 a year, to maintain the system. As of April, there were only 4,067 network devices in CenterPoint’s service area, meaning the utility pays about $30.70 each year to maintain each device.

Centerpoint last year generated $9.6 billion in revenues and earned a $1.8 billion profit, according to its financial filings. CenterPoint officials did not respond to requests for comment.

Other utilities that are part of the Smart Meter consortium also complained to the Public Utility Commission that, up to now, the system hasn’t developed. All told, Texas has 7.3 million meters connected to Smart Meter Texas, but less than 1 percent are using the networking functions to track real-time prices and consumption, according to the testimony of Donny R. Helm, director of technology strategy and architecture for the state’s largest utility Oncor Electric Delivery Co. in Dallas.

The isssue was resolved recently through a settlement agreement that limits on-demand readings to twice an hour that Smart Meter Texas must provide customers. The price of power changes every 15 minutes, so a twice an hour reading may miss some price spikes.

The Public Utility Commission signed off on the deal, and so did several other groups including several retail electricity providers and the Office of Public Utility Counsel which represents residential customers and small businesses.

Michele Gregg, spokeswoman for the Public Utility Counsel, testified in December that the consumer advocate supported the change because widespread use of the networks never materialized. Catherine Webking, an Austin lawyer who represents the Texas Energy Association for Marketers, a group of retail electric providers, said she believes the deal was a reasonable resolution of providing the benefits of Smart Meter Texas while not incurring too much cost.

But Griddy, an electricity provider that offers customers the opportunity to pay wholesale power prices, which also issued a plea to customers during a price surge, said the state hasn’t given the smart-meter networks a chance and could miss out on its potential. Griddy was counting on the continued adoption of real time pricing as the next step for customers wanting to control their electricity costs.

Right now, Griddy sends out price alerts from the grid operator Electric Reliability Council of Texas so businesses like hotels can run washers and dryers when electricity prices are cheapest. But the company was counting on a smart-meter program that would allow customers to track wholesale prices and manage consumption themselves, making Griddy’s offerings attractive to more people.

Wholesale prices are generally cheaper than retail prices, but they can fluctuate widely, especially when the Texas power grid faces another crisis during extreme weather. Last year, wholesale prices averaged less than 3 cents per kilowatt hour, much lower than than retail rates that now are running above 11 cents, but they can spike at times of high demand to as much as $9 a kilowatt hour.

What customers want is to be able to use energy when it’s cheapest, said Greg Craig, Griddy’s CEO, and they want to do it automatically. They want to be able to program their thermostat so that if the price rises they can shut off their air conditioning and if the price falls, they can charge their electric-powered vehicle.

Griddy customers may still save money even without real time data, he said. But they won’t be able to see their usage in real time or see how much they’re spending.

“The big utilities have big investments in the existing way and going to real time and more transparency isn’t really in their best interest,” said Craig.


Related News

View more

Smaller, cheaper, safer: Next-gen nuclear power, explained

MARVEL microreactor debuts at Idaho National Laboratory as a 100 kW, liquid-metal-cooled, zero-emissions generator powering a nuclear microgrid, integrating wind and solar for firm, clean energy in advanced nuclear applications research.


Key Points

A 100 kW, liquid-metal-cooled INL reactor powering a nuclear microgrid and showcasing zero-emissions clean energy.

✅ 100 kW liquid-metal-cooled microreactor at INL

✅ Powers first nuclear microgrid for applications testing

✅ Integrates with wind and solar for firm clean power


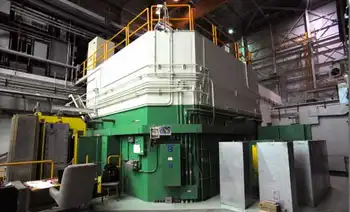
Inside the Transient Reactor Test Facility, a towering, windowless gray block surrounded by barbed wire, researchers are about to embark on a mission to solve one of humanity’s greatest problems with a tiny device.

Next year, they will begin construction on the MARVEL reactor. MARVEL stands for Microreactor Applications Research Validation and EvaLuation. It’s a first-of-a-kind nuclear power generator with a mini-reactor design that is cooled with liquid metal and produces 100 kilowatts of energy. By 2024, researchers expect MARVEL to be the zero-emissions engine of the world’s first nuclear microgrid at Idaho National Laboratory (INL).

“Micro” and “tiny,” of course, are relative. MARVEL stands 15 feet tall, weighs 2,000 pounds, and can fit in a semi-truck trailer. But it's minuscule compared to conventional nuclear power plants, which span acres, produces gigawatts of electricity to power whole states, and can take more than a decade to build.

For INL, where scientists have tested dozens of reactors over the decades across an area three-quarters the size of Rhode Island, it’s a radical reimagining of the technology. This advanced reactor design could help overcome the biggest obstacles to nuclear energy: safety, efficiency, scale, cost, and competition. MARVEL is an experiment to see how all these pieces could fit together in the real world.

“It’s an applications test reactor where we’re going to try to figure out how we extract heat and energy from a nuclear reactor and apply it — and combine it with wind, solar, and other energy sources,” said Yasir Arafat, head of the MARVEL program.

The project, however, comes at a time when nuclear power is getting pulled in wildly different directions, from phase-outs to new strategies like the UK’s green industrial revolution that shapes upcoming reactors.

Germany just shut down its last nuclear reactors. The U.S. just started up its first new reactor in 30 years, underscoring a shift. France, the country with the largest share of nuclear energy on its grid, saw its atomic power output decline to its lowest since 1988 last year. Around the world, there are currently 60 nuclear reactors under construction, with 22 in China alone.

But the world is hungrier than ever for energy. Overall electricity demand is growing: Global electricity needs will increase nearly 70 percent by 2050 compared to today’s consumption, according to the Energy Information Administration. At the same time, the constraints are getting tighter. Most countries worldwide, including the U.S., have committed to net-zero goals by the middle of the century, even as demand rises.

To meet this energy demand without worsening climate change, the U.S. Energy Department’s report on advanced nuclear energy released in March said, “the U.S. will need ~550–770 [gigawatts] of additional clean, firm capacity to reach net-zero; nuclear power is one of the few proven options that could deliver this at scale.”

The U.S. government is now renewing its bets on nuclear power to produce steady electricity without emitting greenhouse gases. The Bipartisan Infrastructure Law included $6 billion to keep existing nuclear power plants running. In addition, the Inflation Reduction Act, the U.S. government’s largest investment in countering climate change, includes several provisions to benefit atomic power, including tax credits for zero-emissions energy.

“It’s a game changer,” said John Wagner, director of INL.

The tech sector is jumping in, too, as atomic energy heats up across startups and investors. In 2021, venture capital firms poured $3.4 billion into nuclear energy startups. They’re also pouring money into even more far-out ideas, like nuclear fusion power. Public opinion has also started moving. An April Gallup poll found that 55 percent of Americans favour and 44 percent oppose using atomic energy, the highest levels of support in 10 years.


Related News

View more

Texas produces and consumes the most electricity in the US

Texas ERCOT Power Grid leads U.S. wind generation yet faces isolated interconnection, FERC exemption, and high industrial energy use, with distinct electricity and natural gas prices managed by a single balancing authority.


Key Points

The state-run interconnection that balances Texas electricity, isolated from FERC oversight and other U.S. grids.

✅ Largest U.S. wind power producer, high industrial demand

✅ Operates one balancing authority, independent interconnection

✅ Pays lower electricity, higher natural gas vs national average


For nearly two decades, the Lone Star State has generated more wind-sourced electricity than any other state in the U.S., according to the Energy Information Administration, or EIA.

In 2022, EIA reported Texas produced more electricity than any other state and generated twice as much as second-place Florida.

However, Texas also leads the country in another category. According to EIA, Texas is the largest energy-consuming state in the nation across all sectors with more than half of the state’s energy being used by the industrial sector.

As of May 2023, Texas residents paid 43% more for natural gas and around 10% less for electricity compared to the national average, according to EIA, and in competitive areas shopping for electricity is getting cheaper as well. Commercial and industrial sectors on average for the same month paid 25% less for electricity compared to the national average.


U.S. electric system compared to Texas
The U.S. electric system is essentially split into three regions called interconnections and are managed by a total of 74 entities called balancing authorities that ensure that power supply and demand are balanced throughout the region to prevent the possibility of blackouts, according to EIA.

The three regions (Interconnections):

Eastern Interconnection: Covers all U.S. states east of the Rocky Mountains, a portion of northern Texas, and consists of 36 balancing authorities.
Western Interconnection: Covers all U.S. states west of the Rockies and consists of 37 balancing authorities.
ERCOT: Covers the majority of Texas and consists of one balancing authority (itself).

During the 2021 winter storm, Texas electric cooperatives were credited with helping maintain service in many communities.

“ERCOT is unique in that the balancing authority, interconnection, and the regional transmission organization are all the same entity and physical system,” according to EIA, a structure often discussed in analyses of Texas power grid challenges today.

With this being the case, Texas is the only state in the U.S. that balances itself, the only state that is not subject to the jurisdiction of the Federal Energy Regulatory Commission, or FERC, and the only state that is not synchronously interconnected to the grid in the rest of the United States in the event of tight grid conditions, highlighting ongoing discussions about improving Texas grid reliability before peak seasons, according to EIA.

Every other state in the U.S. is connected to a web of multiple balancing authorities that contribute to ensuring power supply and demand are met.

California, for example, was the fourth largest electricity producer and the third largest electricity consumer in the nation in 2022, according to EIA, and California imports the most electricity from other states while Pennsylvania exports the most.

Although California produces significantly less electricity than Texas, it has the ability to connect with more than 10 neighboring balancing authorities within the Western Interconnection to interchange electricity, a dynamic that can see clean states importing dirty electricity under certain market conditions. ERCOT being independent only has electricity interchange with two balancing authorities, one of which is in Mexico.

Regardless of Texas’ unique power structure compared to the rest of the nation, the vast majority of the U.S. risked electricity supplies during this summer’s high heat, as outlined in severe heat blackout risks reports, according to EIA.


Related News

View more

National Grid and SSE to use electrical transformers to heat homes

Grid Transformer Waste Heat Recovery turns substations into neighborhood boilers, supplying district heating via heat networks, helping National Grid and SSE cut emissions, boost energy efficiency, and advance low carbon, net zero decarbonization.


Key Points

Grid Transformer Waste Heat Recovery captures substation heat for district heating, cutting emissions and gas use.

✅ Captures waste heat from National Grid transformers

✅ Feeds SSE district heat networks for nearby homes

✅ Cuts carbon, improves efficiency, aligns with net zero


Thousands of homes could soon be warmed by the heat from giant electricity grid transformers for the first time as part of new plans to harness “waste heat” and cut carbon emissions from home heating.

Trials are due to begin on how to capture the heat generated by transmission network transformers, owned by National Grid, to provide home heating for households connected to district heating networks operated by SSE.

Currently, hot air is vented from the giant substations to help cool the transformers that help to control the electricity running through National Grid’s high-voltage transmission lines.

However, if the trial succeeds, about 1,300 National Grid substations could soon act as neighbourhood “boilers”, piping water heated by the substations into nearby heating networks, and on into the thousands of homes that use SSE’s services.

“Electric power transformers generate huge amounts of heat as a byproduct when electricity flows through them. At the moment, this heat is just vented directly into the atmosphere and wasted,” said Nathan Sanders, the managing director of SSE Energy Solutions.

“This groundbreaking project aims to capture that waste heat and effectively turn transformers into community ‘boilers’ that serve local heat networks with a low- or even zero-carbon alternative to fossil-fuel-powered heat sources such as gas boilers, a shift akin to a gas-for-electricity swap in heating markets,” Sanders added.

Alexander Yanushkevich, National Grid’s innovation manager, said the scheme was “essential to achieve net zero” and a “great example of how, taking a whole-system approach, including power-to-gas in Europe precedents, the UK can lead the way in helping accelerate decarbonisation”.

The energy companies believe the scheme could initially reduce heat network carbon emissions by more than 40% compared with fossil gas systems. Once the UK’s electricity system is zero carbon, and with recent milestones where wind was the main source of UK electricity on the grid, the heating solution could play a big role in helping the UK meet its climate targets.

The first trials have begun at National Grid’s specially designed testing site at Deeside in Wales to establish how the waste heat could be used in district heating networks. Once complete, the intellectual property will be shared with smaller regional electricity network owners, which may choose to roll out schemes in their areas.

Tim O’Reilly, the head of strategy at National Grid, said: “We have 1,300 transmission transformers, but there’s no reason why you couldn’t apply this technology to smaller electricity network transformers, too, echoing moves to use more electricity for heat in colder regions.”

Once the trials are complete, National Grid and SSE will have a better idea of how many homes could be warmed using the heat generated by electricity network substations, O’Reilly said, and how the heat can be used in ways that complement virtual power plants for grid resilience.

“The heavier the [electricity] load, which typically reaches a peak at around teatime, the more heat energy the transformer will be able to produce, aligning with times when wind leads the power mix nationally. So it fits quite nicely to when people require heat in the evenings,” he added.

Other projects designed to capture waste heat to use in district heating schemes include trapping the heat generated on the Northern line of London’s tube network to warm homes in Islington, and harnessing the geothermal heat from disused mines for district heating networks in Durham.

Only between 2% and 3% of the UK is connected to a district heating network, but more networks are expected to emerge in the years ahead as the UK tries to reduce the carbon emissions from homes, alongside its nuclear power plans in the wider energy strategy.


Related News

View more

Renewables are not making electricity any more expensive

Renewables' Impact on US Wholesale Electricity Prices is clear: DOE analysis shows wind and solar, capacity gains, and natural gas lowering rates, shifting daily patterns, and triggering occasional negative pricing in PJM and ERCOT.


Key Points

DOE data show wind and solar lower wholesale prices, reshape price curves, and cause negative pricing in markets.

✅ Natural gas price declines remain the largest driver of cheaper power

✅ Wind and solar shift seasonal and time-of-day price patterns

✅ Negative wholesale prices appear near high wind and solar output


One of the arguments that's consistently been raised against doing anything about climate change is that it will be expensive. On the more extreme end of the spectrum, there have been dire warnings about plunging standards of living due to skyrocketing electricity prices. The plunging cost of renewables like solar cheaper than gas has largely silenced these warnings, but a new report from the Department of Energy suggests that, even earlier, renewables were actually lowering the price of electricity in the United States.


Plunging prices
The report focuses on wholesale electricity prices in the US. Note that these are distinct from the prices consumers actually pay, which includes taxes, fees, payments to support the grid that delivers the electricity, and so on. It's entirely possible for wholesale electricity prices to drop even as consumers end up paying more, and market reforms determine how those changes are passed through. That said, large changes in the wholesale price should ultimately be passed on to consumers to one degree or another.

The Department of Energy analysis focuses on the decade between 2008 and 2017, and it includes an overall analysis of the US market, as well as large individual grids like PJM and ERCOT and, finally, local prices. The decade saw a couple of important trends: low natural gas prices that fostered a rapid expansion of gas-fired generators and the rapid expansion of renewable generation that occurred concurrently with a tremendous drop in price of wind and solar power.

Much of the electricity generated by renewables in this time period would be more expensive than that generated by wind and solar installed today. Not only have prices for the hardware dropped, but the hardware has improved in ways that provide higher capacity factors, meaning that they generate a greater percentage of the maximum capacity. (These changes include things like larger blades on wind turbines and tracking systems for solar panels.) At the same time, operating wind and solar is essentially free once they're installed, so they can always offer a lower price than competing fossil fuel plants.

With those caveats laid out, what does the analysis show? Almost all of the factors influencing the wholesale electricity price considered in this analysis are essentially neutral. Only three factors have pushed the prices higher: the retirement of some plants, the rising price of coal, and prices put on carbon, which only affect some of the regional grids.

In contrast, the drop in the price of natural gas has had a very large effect on the wholesale power price. Depending on the regional grid, it's driven a drop of anywhere from $7 to $53 per megawatt-hour. It's far and away the largest influence on prices over the past decade.


Regional variation and negative prices
But renewables have had an influence as well. That influence has ranged from roughly neutral to a cost reduction of $2.2 per MWh in California, largely driven by solar. While the impact of renewables was relatively minor, it is the second-largest influence after natural gas prices, and the data shows that wind and solar are reducing prices rather than increasing them.

The reports note that renewables are influencing wholesale prices in other ways, however. The growth of wind and solar caused the pattern of seasonal price changes to shift in areas of high wind and solar, as seen with solar reshaping prices in Northern Europe as daylight hours and wind patterns shift with the seasons. Similarly, renewables have a time-of-day effect for similar reasons, helping explain why the grid isn't 100% renewable today, which also influences the daily timing price changes, something that's not an issue with fossil fuel power.

A map showing the areas where wholesale electricity prices have gone negative, with darker colors indicating increased frequency.
Enlarge / A map showing the areas where wholesale electricity prices have gone negative, with darker colors indicating increased frequency.

US DOE
One striking feature of areas where renewable power is prevalent is that there are occasional cases in which an oversupply of renewable energy produces negative electricity prices in the wholesale market. (In the least-surprising statement in the report, it concludes that "negative prices in high-wind and high-solar regions occurred most frequently in hours with high wind and solar output.") In most areas, these negative prices are rare enough that they don't have a significant influence on the wholesale price.

That's not true everywhere, however. Areas on the Great Plains see fairly frequent negative prices, and they're growing in prevalence in areas like California, the Southwest, and the northern areas of New York and New England, while negative prices in France have been observed in similar conditions. In these areas, negative wholesale prices near solar plants have dropped the overall price by 3%. Near wind plants, that figure is 6%.

None of this is meant to indicate that there are no scenarios where expanded renewable energy could eventually cause wholesale prices to rise. At sufficient levels, the need for storage, backup plants, and grid management could potentially offset their low costs, a dynamic sometimes referred to as clean energy's dirty secret by analysts. But it's clear we have not yet reached that point. And if the prices of renewables continue to drop, then that point could potentially recede fast enough not to matter.


Related News

View more

Sign Up for Electricity Forum’s Newsletter

Stay informed with our FREE Newsletter — get the latest news, breakthrough technologies, and expert insights, delivered straight to your inbox.

Electricity Today T&D Magazine Subscribe for FREE

Stay informed with the latest T&D policies and technologies.
  • Timely insights from industry experts
  • Practical solutions T&D engineers
  • Free access to every issue

Download the 2025 Electrical Training Catalog

Explore 50+ live, expert-led electrical training courses –

  • Interactive
  • Flexible
  • CEU-cerified