Grid reconstruction scheme finalized for quake area

By Industrial Info Resources


Protective Relay Training - Basic

Our customized live online or in‑person group training can be delivered to your staff at your location.

  • Live Online
  • 12 hours Instructor-led
  • Group Training Available
Regular Price:
$699
Coupon Price:
$599
Reserve Your Seat Today
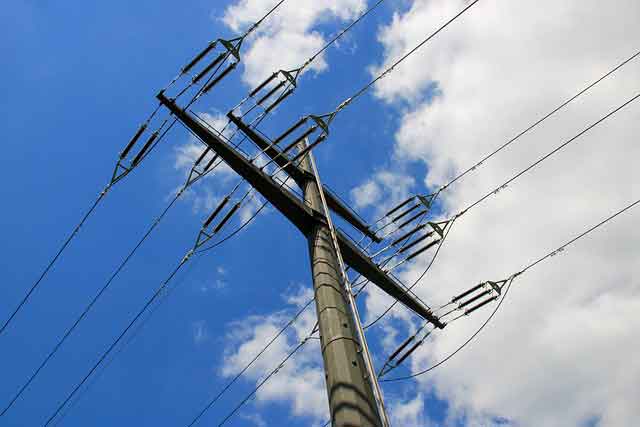
While the quake relief work in China is shifting into resettlement and reconstruction stage, the State Grid Corporation of China (SGC) (Beijing) nailed down the reconstruction scheme for the electricity transmission grid damaged in the Sichuan disaster area.

SGC plans to complete the rush repair for damage facilities in Sichuan Grid to meet power demand in the disaster area as soon as possible and to complete the reconstruction of power facilities by the end of August.

As of May 28, 153 of the 171 transformer substations at 35 kilovolts or above damaged as a result of the Wenchuan quake were brought back to service, accounting for 98.7% of the total resumable substations; 987 of the 1,069 damaged transmission lines at 10 kilovolts or above were brought back online, accounting for 98.7% of the total resumable lines.

Presently, grid reconstruction for the disaster area is being conducted in an orderly way. Based on the overall situation and arrangement for reconstruction in the disaster area, the SGC decided to rebuild those seriously damaged but needed power facilities at the original sites; for those totally damaged power facilities with fully lost load, they will be rebuilt based on new planning; for those needed but unable to repair or rebuild in a short time, temporary power supply facilities will be provided. As of May 30, the SGC has organized 100 small generating sets to the disaster area.

Presently, there are five substations that need to be rebuilt on their original sites. Construction of these substations is underway. Based on preliminary survey and investigation, there are 11 substations to be rebuilt according to new planning, including 2 of 220 kilovolt, 3 of 110 kilovolt and 6 of 35 kilovolt level. The SGC is obtaining support from related department of the government to try to start reconstruction as soon as possible in line with the overall reconstruction planning for the disaster area.

Related News

Four Facts about Covid and U.S. Electricity Consumption

COVID-19 Impact on U.S. Electricity Consumption shows commercial and industrial demand dropped as residential use rose, with flattened peak loads, weekday-weekend convergence, Texas hourly data, and energy demand as a real-time economic indicator.


Key Points

It reduced commercial and industrial demand while raising residential use, shifting peaks and weekday patterns.

✅ Commercial electricity down 12%; industrial down 14% in Q2 2020

✅ Residential use up 10% amid work-from-home and lockdowns

✅ Peaks flattened; weekday-weekend loads converged in Texas


This is an important turning point for the United States. We have a long road ahead. But one of the reasons I’m optimistic about Biden-Harris is that we will once again have an administration that believes in science.

To embrace this return to science, I want to write today about a fascinating new working paper by Tufts economist Steve Cicala.

Professor Cicala has been studying the effect of Covid on electricity consumption since back in March, when the Wall Street Journal picked up his work documenting an 18% decrease in electricity consumption in Italy.

The new work, focused on the United States, is particularly compelling because it uses data that allows him to distinguish between residential, commercial, and industrial sectors, against a backdrop of declining U.S. electricity sales over recent years.

Without further ado, here are four facts he uncovers about Covid and U.S. electricity demand during COVID-19 and consumption.


Fact #1: Firms Are Using Less
U.S. commercial electricity consumption fell 12% during the second quarter of 2020. U.S. industrial electricity consumption fell 14% over the same period.

This makes sense. The second quarter was by some measures, the worst quarter for the U.S. economy in over 145 years!

Economic activity shrank. Schools closed. Offices closed. Factories closed. Restaurants closed. Malls closed. Even health care offices closed as patients delayed going to the dentist and other routine care. All this means less heating and cooling, less lighting, less refrigeration, less power for computers and other office equipment, less everything.

The decrease in the industrial sector is a little more surprising. My impression had been that the industrial sector had not fallen as far as commercial, but amid broader disruptions in coal and nuclear power that strained parts of the energy economy, the patterns for both sectors are quite similar with the decline peaking in May and then partially rebounding by July. The paper also shows that areas with higher unemployment rates experienced larger declines in both sectors.


Fact #2: Households Are Using More
While firms are using less, households are using more. U.S. residential electricity consumption increased 10% during the second quarter of 2020. Consumption surged during March, April, and May, a reflection of the lockdown lifestyle many adopted, and then leveled off in June and July – with much less of the rebound observed on the commercial/industrial side.

This pattern makes sense, too. In Professor Cicala’s words, “people are spending an inordinate amount of time at home”. Many of us switched over to working from home almost immediately, and haven’t looked back. This means more air conditioning, more running the dishwasher, more CNN (especially last week), more Zoom, and so on.

The paper also examines the correlates of the decline. Areas in the U.S. where more people can work from home experienced larger increases. Unemployment rates, however, are almost completely uncorrelated with the increase.


Fact #3: Firms are Less Peaky
The paper next turns to a novel dataset from Texas, where Texas grid reliability is under active discussion, that makes it possible to measure hourly electricity consumption by sector.

As the figure above illustrates, the biggest declines in commercial/industrial electricity consumption have occurred Monday through Friday between 9AM and 5PM.

The dashed line shows the pattern during 2019. Notice the large spikes in electricity consumption during business hours. The solid line shows the pattern during 2020. Much smaller spikes during business hours.


Fact #4: Everyday is Like Sunday
Finally, we have what I would like to nominate as the “Energy Figure of the Year”.

Again, start with the pattern for 2019, reflected by the dashed line. Prior to Covid, Texas households used a lot more electricity on Saturdays and Sundays.

Then along comes Covid, and turned every day into the weekend. Residential electricity consumption in Texas during business hours Monday-Friday is up 16%(!).

In the pattern for 2020, it isn’t easy to distinguish weekends from weekdays. If you feel like weekdays and weekends are becoming a big blur – you are not alone.


Conclusion
Researchers are increasingly thinking about electricity consumption as a real-time indicator of economic activity, even as flat electricity demand complicates utility planning and investment. This is an intriguing idea, but Professor Cicala’s new paper shows that it is important to look sector-by-sector.

While commercial and industrial consumption indeed seem to measure the strength of an economy, residential consumption has been sharply countercylical – increasing exactly when people are not at work and not at school.

These large changes in behavior are specific to the pandemic. Still, with the increased blurring of home and non-home activities we may look back on 2020 as a key turning point in how we think about these three sectors of the economy.

More broadly, Professor Cicala’s paper highlights the value of social science research. We need facts, data, and yes, science, if we are to understand the economy and craft effective policies on energy insecurity and shut-offs as well.


Related News

View more

UCP scraps electricity price cap, some will see $7 bill increase this month

Edmonton Electricity Rate Increase signals Alberta RRO changes as the UCP ends the NDP price cap; kilowatt-hour rises to 7.5 cents, raising energy bills for typical households by 3.9 percent in December.


Key Points

The end of Alberta’s RRO cap lifts kWh to 7.5 cents, raising an average Edmonton home’s bill about 3.9% in December.

✅ RRO price cap scrapped; kWh set at 7.5 cents in December.

✅ Average 600 kWh home pays about $7.37 more vs November.

✅ UCP ends NDP-era cap after stakeholder and consumer feedback.


Electricity will be more expensive for some Edmontonians in December after the UCP government scrapped a program that capped rates amid prices spiking in Alberta this year.

Effective Nov. 30, the province got rid of the consumer price cap program for Regulated Rate Option customers.

In 2017, the NDP government capped the kilowatt per hour price at 6.8 cents under a consumer price cap policy, meaning Edmontonians would pay the market rate and not more than the capped price.

In December, kWh will cost 7.5 cents amid expert warnings to lock in rates across Alberta. Typical Edmonton homes use an average of 600 kWh, increasing bills by $7.37, or 3.9 per cent, compared to November.

In Calgary, electricity bills have been rising as well, reflecting similar market pressures.

The NDP created the capacity system to bring price stability to Albertans, though a Calgary retailer urged scrapping the market overhaul at the time.

Energy Minister Sonya Savage said the UCP decided to scrap it after "overwhelming" feedback from consumers and industry stakeholders, as the province introduced new electricity rules earlier this year. 


Related News

View more

OPG, TVA Partner on New Nuclear Technology Development

OPG-TVA SMR Partnership advances advanced nuclear technology and small modular reactors for 24/7 carbon-free baseload power, enabling net-zero goals, cross-border licensing, and deployment within a North American clean energy hub.


Key Points

A cross-border effort by OPG and TVA to develop, license, and deploy SMRs for reliable, carbon-free baseload power.

✅ Coordinates design, licensing, construction, and operations

✅ Supports 24/7 baseload, net-zero targets, and energy security

✅ Leverages Darlington and Clinch River early site permits


Two of North America's leading nuclear utilities unveiled a pioneering partnership to develop advanced nuclear technology as an integral part of a clean energy future and creating a North American energy hub. Ontario Power Generation, whose OPG's SMR commitment is well established, and the Tennessee Valley Authority will jointly work to help develop small modular reactors as an effective long-term source of 24/7 carbon-free energy in both Canada and the U.S.

The agreement allows the companies to coordinate their explorations into the design, licensing, construction and operation of small modular reactors.

"As leaders in our industry and nations, OPG and TVA share a common goal to decarbonize energy generation while maintaining reliability and low-cost service, which our customers expect and deserve," said Jeff Lyash, TVA President and CEO. "Advanced nuclear technology will not only help us meet our net-zero carbon targets but will also advance North American energy security."

"Nuclear energy has long been key to Ontario's clean electricity grid, and is a crucial part of our net-zero future," said Ken Hartwick, OPG President and CEO. "Working together, OPG and TVA will find efficiencies and share best practices for the long-term supply of the economical, carbon-free, reliable electricity our jurisdictions need, supported by ongoing Pickering life extensions across Ontario's fleet."

OPG and TVA have similar histories and missions. Both are based on public power models that developed from renewable hydroelectric generation before adding nuclear to their generation mixes. Today, nuclear generation accounts for significant portions of their carbon-free energy portfolios, with Ontario advancing the Pickering B refurbishment to sustain capacity.

Both are also actively exploring SMR technologies. OPG is moving forward with plans to deploy an SMR at its Darlington nuclear facility in Clarington, ON, as part of broader Darlington SMR plans now underway. The Darlington site is the only location in Canada licensed for new nuclear with a completed and accepted Environmental Assessment. TVA currently holds the only Nuclear Regulatory Commission Early Site Permit in the U.S. for small modular reactor deployment at its Clinch River site near Oak Ridge, TN.

No exchange of funding is involved. However, the collaboration agreement will help OPG and TVA reduce the financial risk that comes from development of innovative technology, as well as future deployment costs.

"TVA has the most recent experience completing a new nuclear plant in North America at Watts Bar and that knowledge is invaluable to us as we work toward the first SMR groundbreaking at Darlington," said Hartwick. "Likewise, because we are a little further along in our construction timing, TVA will gain the advantage of our experience before they start work at Clinch River."

"It's a win-win agreement that benefits all of those served by both OPG and TVA, as well as our nations," said Lyash. "Moving this technology forward is not only a significant step in advancing a clean energy future and Canada's climate goals, but also in creating a North American energy hub."

"With the demand for clean electricity on the rise around the world, Ontario's momentum is growing. The world is watching Ontario as we advance our work to fully unleash our nuclear advantage, alongside a premiers' SMR initiative that underscores provincial collaboration. I congratulate OPG and TVA – two great industry leaders – for working together to deploy SMRs and showcase and apply Canada's nuclear expertise that will deliver economic, health and environmental benefits for all of us to enjoy," said Todd Smith, Ontario Minister of Energy.

"The changing climate is a global crisis that requires global solutions. The partnership between the Tennessee Valley Authority and Ontario Power Generation to develop and deploy advanced nuclear technology is exactly the kind of innovative collaboration that is needed to quickly bring the next generation of nuclear carbon-free generation to market. I applaud the leadership that both companies are demonstrating to further strengthen our cross-border relationships," said Maria Korsnick, President and CEO, Nuclear Energy Institute.


Related News

View more

Six key trends that shaped Europe's electricity markets in 2020

European Electricity Market Trends 2020 highlight decarbonisation, rising renewables, EV adoption, shifting energy mix, COVID-19 impacts, fuel switching, hydro, wind and solar growth, gas price dynamics, and wholesale electricity price increases.


Key Points

EU power in 2020 saw lower emissions, more renewables, EV growth, demand shifts, and higher wholesale prices.

✅ Power sector CO2 down 14% on higher renewables, lower coal

✅ Renewables 39% vs fossil 36%; hydro, wind, solar expanded

✅ EV share hit 17%; wholesale prices rose with gas, ETS costs


According to the Market Observatory for Energy DG Energy report, the COVID-19 pandemic and favorable weather conditions are the two key drivers of the trends experienced within the European electricity market in 2020. However, the two drivers were exceptional or seasonal.

The key trends within Europe’s electricity market include:


1. Decrease in power sector’s carbon emissions

As a result of the increase in renewables generation and decrease in fossil-fueled power generation in 2020, the power sector was able to reduce its carbon footprint by 14% in 2020. The decrease in the sector’s carbon footprint in 2020 is similar to trends witnessed in 2019 when fuel switching was the main factor behind the decarbonisation trend.

However, most of the drivers in 2020 were exceptional or seasonal (the pandemic, warm winter, high
hydro generation). However, the opposite is expected in 2021, with the first months of 2021 having relatively cold weather, lower wind speeds and higher gas prices, with stunted hydro and nuclear output also cited, developments which suggest that the carbon emissions and intensity of the power sector could rise.

The European Union is targeting to completely decarbonise its power sector by 2050 through the introduction of supporting policies such as the EU Emissions Trading Scheme, the Renewable Energy Directive and legislation addressing air pollutant emissions from industrial installations, with expectations that low-emissions sources will cover most demand growth in the coming years.

According to the European Environment Agency, Europe halved its power sector’s carbon emissions in 2019 from 1990 levels.


2. Changes in energy consumption

EU consumption of electricity fell by -4% as majority of industries did not operate at full level during the first half of 2020. Although majority of EU residents stayed at home, meaning an increase in residential energy use, rising demand by households could not reverse falls in other sectors of the economy.

However, as countries renewed COVID-19 restrictions, energy consumption during the 4th quarter was closer to the “normal levels” than in the first three quarters of 2020. 

The increase in energy consumption in the fourth quarter of 2020 was also partly due to colder temperatures compared to 2019 and signs of surging electricity demand in global markets.


3. Increase in demand for EVs

As the electrification of the transport system intensifies, the demand for electric vehicles increased in 2020 with almost half a million new registrations in the fourth quarter of 2020. This was the highest figure on record and translated into an unprecedented 17% market share, more than two times higher than in China and six times higher than in the United States.

However, the European Environment Agency (EEA)argues that the EV registrations were lower in 2020 compared to 2019. EEA states that in 2019, electric car registrations were close to 550 000 units, having reached 300 000 units in 2018.


4. Changes in the region’s energy mix and increase in renewable energy generation

The structure of the region’s energy mix changed in 2020, according to the report.

Owing to favorable weather conditions, hydro energy generation was very high and Europe was able to expand its portfolio of renewable energy generation such that renewables (39%) exceeded the share of fossil fuels (36%) for the first time ever in the EU energy mix.

Rising renewable generation was greatly assisted by 29 GW of wind and solar capacity additions in 2020, which is comparable to 2019 levels. Despite disrupting the supply chains of wind and solar resulting in project delays, the pandemic did not significantly slow down renewables’ expansion.

In fact, coal and lignite energy generation fell by 22% (-87 TWh) and nuclear output dropped by 11% (-79 TWh). On the other hand, gas energy generation was not significantly impacted owing to favorable prices which intensified coal-to-gas and lignite-to-gas switching, even as renewables crowd out gas in parts of the market.


5. Retirement of coal energy generation intensify

 As the outlook for emission-intensive technologies worsens and carbon prices rise, more and more early coal retirements have been announced. Utilities in Europe are expected to continue transitioning from coal energy generation under efforts to meet stringent carbon emissions reduction targets and as they try to prepare themselves for future business models that they anticipate to be entirely low-carbon reliant.

6. Increase in wholesale electricity prices

In recent months, more expensive emission allowances, along with rising gas prices, have driven up wholesale electricity prices on many European markets to levels last seen at the beginning of 2019. The effect was most pronounced in countries that are dependent on coal and lignite. The wholesale electricity prices dynamic is expected to filter through to retail prices.

The rapid sales growth in the EVs sector was accompanied by expanding charging infrastructure. The number of high-power charging points per 100 km of highways rose from 12 to 20 in 2020.


Related News

View more

BC Hydro Rates to Rise by 3.75% Over Two Years

British Columbia electricity rate increase will raise BC Hydro bills 3.75% over 2025-2026 to fund infrastructure, Site C, and clean energy, balancing affordability, reliability, and energy security while keeping prices below the North American average.


Key Points

BC will raise BC Hydro rates 3.75% in 2025-2026, about $3.75/month, to fund grid upgrades, Site C, and clean energy.

✅ 3.75% over 2025-2026; about $3.75/month on $100 average bill

✅ Funds Site C, grid maintenance, and clean energy capacity

✅ Keeps BC Hydro rates below North American averages


British Columbia's electricity rates will experience a 3.75% increase over the next two years, following an earlier 3% rate increase approval that set the stage, as confirmed by the provincial government on March 17, 2025. The announcement was made by Minister of Energy and Climate Solutions, Adrian Dix, who emphasized the decision's necessity for maintaining BC Hydro’s infrastructure while balancing affordability for residents.

For most households, the increase will amount to an additional $3.75 per month, based on an average BC Hydro bill of $100, though some coverage framed an earlier phase as a BC Hydro $2/month proposal that later evolved. While this may seem modest, the increase reflects a broader strategy to stabilize the utility's rates amidst economic challenges and ensure long-term energy security for the province.

Reasons Behind the Rate Hike

The rate increase comes during a period of rising costs in both global markets and local economies. According to Dix, the economic uncertainty stemming from trade dynamics and inflation has forced the government to act. Despite these pressures, and after a prior B.C. rate freeze to moderate impacts, the increase remains below cumulative inflation over the last several years, a move designed to shield consumers from the full force of these economic changes.

Dix also noted that, when adjusted for inflation, electricity rates in British Columbia in 2025 are effectively at the same price they were four decades ago. This stability, he argued, underscores the provincial government’s commitment to keeping rates as low as possible for residents, even as operating costs rise.

“We must take urgent action to protect British Columbians from the uncertainty posed by rising costs while building a strong, resilient electricity system for the long-term benefit of B.C.’s energy independence,” Dix said. He also highlighted the government's approach to minimizing the financial burden on consumers by keeping electricity costs well below the North American average.

Infrastructure and Maintenance Costs

The primary justification for the rate increase is to allow BC Hydro to continue its critical infrastructure development, including the Site C hydroelectric project, which is expected to become operational in the coming years. The increased costs of maintaining and upgrading the province's electricity grid also contribute to the need for higher rates.

The Site C project, a massive hydroelectric dam under construction on the Peace River, is expected to provide a substantial increase in clean, renewable energy capacity. However, such large-scale projects require significant investment and maintenance, both of which have contributed to the increased operating costs for BC Hydro.

A Strategic Move for Rate Stability

The provincial government has been clear that the rate increase will allow for a continuation of infrastructure development while keeping the rates manageable for consumers. The 3.75% increase will be spread across two years, with the first hike scheduled for April 1, 2025, reflecting the typical April rate changes BC Hydro implements, and the second for April 1, 2026.

Dix confirmed that the rate hike would still keep electricity costs among the lowest in North America, noting that British Columbians pay about half of what residents in Alberta pay for electricity. This is part of a broader effort by the provincial government to provide stable energy pricing while bolstering the transition to clean energy solutions, such as the Site C project and other renewable energy initiatives.

Addressing Public Concerns

Although the government has framed the increase as a necessary measure to ensure the province's long-term energy independence and reliability, the rate hikes are likely to face scrutiny from residents, particularly those already struggling with the rising cost of living, even as provinces like Ontario face their own Ontario hydro rate increase pressures this fall.

Public reactions to utility rate increases are often contentious, as residents feel the pressure of rising prices across various sectors, from housing to healthcare. However, the government has promised that the new rates will remain manageable, especially considering the relatively low rate increases compared to inflation and other regions where Manitoba Hydro scaled back a planned increase to temper impacts.

Furthermore, the increase comes as part of a broader strategy that aims to keep the overall impact on consumers as low as possible. Minister Dix emphasized that these rate increases were intended to ensure the continued reliability of BC Hydro’s services, without overwhelming ratepayers.

Long-Term Goals

Looking ahead, the province's strategy centers on not only maintaining affordable electricity rates but also reinforcing the importance of renewable energy, while some jurisdictions consider a 2.5% annual increase plan over multiple years to stabilize their grids. As climate change becomes an increasingly pressing issue, BC’s investments in clean energy projects like Site C aim to provide sustainable power for generations to come.

The government’s long-term vision involves building a resilient, energy-independent province that can weather future economic and environmental challenges. In this context, the rate increases are framed not just as a response to immediate inflationary pressures but as a necessary step in preparing BC’s energy infrastructure for the future.

The 3.75% rate increase set for 2025 and 2026 represents a balancing act between managing the financial health of BC Hydro and protecting consumers from higher costs. While the increase will have a modest effect on household bills, the long-term goal is to build a more robust and sustainable electricity system for British Columbia’s future. Through investments in clean energy and strategic infrastructure development, the province aims to keep electricity rates competitive while positioning itself as a leader in energy independence and climate action.


Related News

View more

US Dept. of Energy awards Washington state $23.4 million to strengthen infrastructure

Washington Grid Resilience Grant funds DOE-backed modernization to harden Washington's electric grid against extreme weather, advancing clean energy, affordable and reliable electricity, and community resilience under the Bipartisan Infrastructure Law via projects and utility partnerships.


Key Points

A $23.4M DOE grant to modernize Washington's grid, boost weather resilience, and deliver clean, reliable power.

✅ Targets outages, reliability, and community resilience statewide.

✅ Prioritizes disadvantaged areas and quality clean energy jobs.

✅ Backed by Bipartisan Infrastructure Law and DOE funding.


Washington state has received a $23.4 million Grid Resilience State and Tribal Formula Grant from the U.S. Department of Energy (DOE) to modernize the electric grid through smarter electricity infrastructure and reduce impacts due to extreme weather and natural disasters. Grid Resilience State and Tribal Formula Grants aim to ensure the reliability of power sector infrastructure so that communities have access to affordable, reliable, clean electricity.

“Electricity is an essential lifeline for communities. Improving our systems by reducing disruptive events is key as we cross the finish line of a 100% clean electricity grid and ensure equitable benefits from the clean energy economy reach every community,” said Gov. Jay Inslee.

The federal funding for energy resilience will enhance and expand ongoing current grid modernization and resilience efforts throughout the state. For example, working directly with rural and typical end-of-the-line customers to develop resilience plans and collaborating with communities and utilities, including smart city efforts in Spokane as examples, on building resilient and renewable infrastructure for essential services.

“This is a significant opportunity to supplement our state investments in building a robust, resilient electric grid that supports our long-term vision for clean, affordable and reliable electricity – the foundation for economic growth and job creation that strengthens our communities and keeps Washington globally competitive. It shows once again that we are maximizing the federal funding being made available by the Biden-Harris Administration to invest in the country’s infrastructure,” said Washington State Department of Commerce Director Mike Fong.

Across the border, British Columbia's clean energy shift adds regional momentum for resilient, low-carbon power.

Goals include:

Reducing the frequency, duration and impact of outages as climate change impacts on the grid intensify while enhancing resiliency in historically disadvantaged communities.
Strengthening prosperity by expanding well-paying, safe clean energy jobs accessible to all workers and ensuring investments have a positive effect on quality job creation and equitable economic development.

Building a community of practice and maximizing project scalability by identifying pathways for scaling innovations such as integrating solar into the grid across programs.

“The Grid Resilience Formula Grants will enable communities in Washington to protect households and businesses from blackouts or power shutdowns during extreme weather,” said Maria Robinson, Director, Grid Deployment Office, U.S. Department of Energy. “Projects selected through this program will benefit communities by creating good-paying jobs to deliver clean, affordable, and reliable energy across the country.”

DOE has also announced $34 million for grid improvements to bolster reliability nationwide.

“An innovative, reliable, and efficient power grid is vital to Washington’s continued economic growth and for community resilience especially in disadvantaged areas,” said U.S. Rep. Strickland, Co-Lead of the bipartisan Grid Innovation Caucus. “The funding announced today will invest in our energy grid, support good-paying jobs, and means a cleaner, more energy-efficient future.”

Funded through the Bipartisan Infrastructure Law and administered by DOE’s Grid Deployment Office, with related efforts such as California grid upgrades advancing nationwide, the Grid Resilience State and Tribal Formula Grants distribute funding to states, territories, and federally recognized Indian Tribes, over five years based on a formula that includes factors such as population size, land area, probability and severity of disruptive events, and a locality’s historical expenditures on mitigation efforts. Priority will be given to projects that generate the greatest community benefit providing clean, affordable, and reliable energy.


Related News

View more

Sign Up for Electricity Forum’s Newsletter

Stay informed with our FREE Newsletter — get the latest news, breakthrough technologies, and expert insights, delivered straight to your inbox.

Electricity Today T&D Magazine Subscribe for FREE

Stay informed with the latest T&D policies and technologies.
  • Timely insights from industry experts
  • Practical solutions T&D engineers
  • Free access to every issue

Download the 2025 Electrical Training Catalog

Explore 50+ live, expert-led electrical training courses –

  • Interactive
  • Flexible
  • CEU-cerified