State regulators concerned about airplane safety over proposed west Hayward sites

By The Daily Review


NFPA 70e Training

Our customized live online or in‑person group training can be delivered to your staff at your location.

  • Live Online
  • 6 hours Instructor-led
  • Group Training Available
Regular Price:
$199
Coupon Price:
$149
Reserve Your Seat Today
Aircraft safety is replacing air pollution concerns as the latest obstacle potentially jeopardizing plans to build two power plants in west Hayward.

High-velocity plumes generated from power plant heat stacks "have a potential to pose a hazard to aircraft" flying to and from the Hayward Executive Airport, according to a letter sent by the California Energy Commission to city officials.

Paul Richins, a manager in the state commission's siting division, wrote that the hot, mostly invisible plumes can disturb the stability of the atmosphere above plants, especially in the winter.

"Plumes are thermally buoyant during colder weather and more likely to maintain their vertical velocity at higher altitudes under calm, cool conditions," Richins wrote.

Hayward's busy general aviation airport is a little more than a mile north of where Texas-based Tierra Energy wants to build its 115-megawatt Eastshore Energy Center on Clawiter Road.

San Jose-based Calpine Corp. also wants to build the much bigger, 600-megawatt Russell City Energy Center about a half-mile west of the Eastshore plant.

Both power plants would serve the Pacific Gas & Electric grid. And both plants, if built, are expected to emit plumes that exit from heat stacks at a velocity ranging from 71 to 74 feet per second, Richins said.

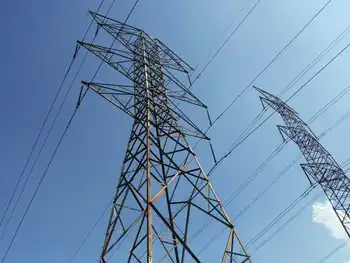
For the Russell City plant, the plumes would emerge from two 145-foot-tall stacks near Hayward's wastewater treatment plant on Enterprise Avenue. For the Eastshore plant, emissions would emerge from 14 stacks that each would be 70 feet tall.

The Russell City plant would also have nine 64-foot-tall cooling towers emitting additional plumes estimated to rise at 34 feet per second. The Eastshore plant would not have any cooling towers and would not emit any visible plumes.

State energy officials began scrutinizing the aircraft safety issues in Hayward because of concerns that have arisen over power plant proposals in the southeastern California city of Blythe.

Charles Hull, manager of the Blythe Municipal Airport, said a power plant was built in 2001 on a site a mile west of his airport. Another power plant is scheduled to be built nearby soon.

There have been no airplane accidents associated with the existing plant, though some pilots have registered turbulence complaints, Hull said. And in colder winter months, the plant sometimes produces a wet column of air.

"It's a very sensitive issue," Hull said. "You can't have an airport all of a sudden consumed by a cloud."

Partly because of those concerns, staffers at the California Energy Commission advised the commission in 2005 against building a second Blythe power plant, saying the location "creates a potential adverse airport safety impact."

The commission, which has final say on whether a plant will be built, allowed the plant a license anyway but placed a condition on the developer to mitigate air safety hazards.

Hull, who is also Blythe's assistant city manager, said the airport established an airfield wind-advisory system that takes wind and temperature measurements. The state also made power plant operators implement various safety measures.

Susanne Garfield, a spokeswoman for the energy commission, said that because of the Blythe plant, officials now have a better understanding of the impacts of thermal plumes. Greg Trewitt, a Tierra Energy vice president and manager of the Eastshore project, said the company is prepared to work with the Federal Aviation Administration to study and address potential air safety hazards.

"I think the CEC is just making sure it is not a hazard," Trewitt said of the letter. "We'll have to work with the FAA and make sure we're not creating any issues with overflying aircraft."

Related News

SDG&E Wants More Money From Customers Who Don’t Buy Much Electricity. A Lot More.

SDG&E Minimum Bill Proposal would impose a $38.40 fixed charge, discouraging rooftop solar, burdening low income households, and shifting grid costs during peak demand, as the CPUC weighs consumer impacts and affordability.


Key Points

Sets a $38.40 monthly minimum bill that raises low usage costs, deters rooftop solar, and burdens low income households.

✅ $38.40 fixed charge regardless of usage

✅ Disincentivizes rooftop solar investments

✅ Disproportionate impact on low income customers


The utility San Diego Gas & Energy has an aggressive proposal pending before the California Public Utilities Commission, amid recent commission changes in San Diego that highlight how regulatory decisions affect local customers: It wants to charge most residential customers a minimum bill of $38.40 each month, regardless of how much energy they use. The costs of this policy would hit low-income customers and those who generate their own energy with rooftop solar. We’re urging the Commission to oppose this flawed plan—and we need your help.

SDG&E’s proposal is bad news for sustainable energy. About half of the customers whose bills would go up under this proposal have rooftop solar. The policy would deter other customers from investing in rooftop solar by making these investments less economical. Ultimately, lost opportunities for solar would mean burning more gas in polluting power plants. 

The proposal is also bad news for people who already have to scrimp on energy costs. Most customers with big homes and billowing air conditioners won't notice if this policy goes into effect, because they use at least $38 worth of electricity a month anyway. But for households that don’t buy much electricity from the company, including those in small apartments without air conditioning, this proposal would raise the bills. Even for customers on special low-income rates, amid electric bill changes statewide, SDG&E wants a minimum bill of $19.20.

Penalizing customers who don’t use much electricity would disproportionately hurt lower-income customers, raising energy equity concerns across the region, who tend to use less energy than their wealthier neighbors. In the region SDG&E serves, the average family in an apartment uses half as much electricity as a single-family residence. Statewide, low-income households are more than four times as likely to be low-usage electricity customers than high-income households. When it gets hot, residential electricity patterns are often driven by air conditioning. The vast majority of SDG&E's customers live in the coastal climate zone, where access to air conditioning is strongly linked to income: Households with incomes over $150,000 are more than twice as likely to have air conditioning than families making less than $35,000, with significant racial disparities in who has AC.

In its attempt to rationalize its request, SDG&E argues that it should charge everyone for infrastructure costs that do not depend on how much energy they use. But the cost of the grid is driven by how much energy SDG&E delivers on hot summer afternoons, when some customers blast their AC and demand for electricity peaks. If more customers relied on their own solar power or conserved energy, the utility would spend less on its grid and help rein in soaring electricity prices over time.

In the long term, reducing incentives to go solar and conserve energy will strain the grid and drive up costs for everyone, especially as lawmakers may overturn income-based charges and reshape rate design. SDG&E's arguments are part of a standard utility playbook for trying to hike income-based fixed charges, and consumer advocates have repeatedly shut them down.  As far as we know, no regulators in the country have allowed a utility to charge customers over $38 for the “privilege” of accessing electric service. 


Related News

View more

Europe Stores Electricity in Natural Gas Pipes

Power-to-gas converts surplus renewable electricity into green hydrogen or synthetic methane via electrolysis and methanation, enabling seasonal energy storage, grid balancing, hydrogen injection into gas pipelines, and decarbonization of heat, transport, and industry.


Key Points

Power-to-gas turns excess renewable power into hydrogen or methane for storage, grid support, and clean fuel.

✅ Enables hydrogen injection into existing natural gas networks

✅ Balances grids and provides seasonal energy storage capacity

✅ Supplies low-carbon fuels for industry, heat, and heavy transport


Last month Denmark’s biggest energy firm, Ørsted, said wind farms it is proposing for the North Sea will convert some of their excess power into gas. Electricity flowing in from offshore will feed on-shore electrolysis plants that split water to produce clean-burning hydrogen, with oxygen as a by-product. That would supply a new set of customers who need energy, but not as electricity. And it would take some strain off of Europe’s power grid as it grapples with an ever-increasing share of hard-to-handle EU wind and solar output on the grid.

Turning clean electricity into energetic gases such as hydrogen or methane is an old idea that is making a comeback as renewable power generation surges and crowds out gas in Europe. That is because gases can be stockpiled within the natural gas distribution system to cover times of weak winds and sunlight. They can also provide concentrated energy to replace fossil fuels for vehicles and industries. Although many U.S. energy experts argue that this “power-to-gas” vision may be prohibitively expensive, some of Europe’s biggest industrial firms are buying in to the idea.

European power equipment manufacturers, anticipating a wave of renewable hydrogen projects such as Ørsted’s, vowed in January that, as countries push for hydrogen-ready power plants across Europe, all of their gas-fired turbines will be certified by next year to run on up to 20 percent hydrogen, which burns faster than methane-rich natural gas. The natural gas distributors, meanwhile, have said they will use hydrogen to help them fully de-carbonize Europe’s gas supplies by 2050.

Converting power to gas is picking up steam in Europe because the region has more consistent and aggressive climate policies and evolving electricity pricing frameworks that support integration. Most U.S. states have goals to clean up some fraction of their electricity supply; coal- and gas-fired plants contribute a little more than a quarter of U.S. greenhouse gas emissions. In contrast, European countries are counting on carbon reductions of 80 percent or more by midcentury—reductions that will require an economywide switch to low-carbon energy.

Cleaning up energy by stripping the carbon out of fossil fuels is costly. So is building massive new grid infrastructure, including transmission lines and huge batteries, amid persistent grid expansion woes in parts of Europe. Power-to-gas may be the cheapest way forward, complementing Germany’s net-zero roadmap to cut electricity costs by a third. “In order to reach the targets for climate protection, we need even more renewable energy. Green hydrogen is perceived as one of the most promising ways to make the energy transition happen,” says Armin Schnettler, head of energy and electronics research at Munich-based electric equipment giant Siemens.

Europe already has more than 45 demonstration projects to improve power-to-gas technologies and their integration with power grids and gas networks. The principal focus has been to make the electrolyzers that convert electricity to hydrogen more efficient, longer-lasting and cheaper to produce.

The projects are also scaling up the various technologies. Early installations converted a few hundred kilowatts of electricity, but manufacturers such as Siemens are now building equipment that can convert 10 megawatts, which would yield enough hydrogen each year to heat around 3,000 homes or fuel 100 buses, according to financial consultancy Ernst & Young.

The improvements have been most dramatic for proton-exchange membrane electrolyzers, which are akin to the fuel cells used in hydrogen vehicles (but optimized to produce hydrogen rather than consume it). The price of proton-exchange electrolyzers has dropped by roughly 40 percent during the past decade, according to a study published in February in Nature Energy. They are also five times more compact than older alkaline electrolysis plants, enabling onsite hydrogen production near gas consumers, and they can vary their power consumption within seconds to operate on fluctuating wind and solar generation.

Many European pilot projects are demonstrating “methanation” equipment that converts hydrogen to methane, too, which can be used as a drop-in replacement for natural gas. Europe’s electrolyzer plants, however, are showing that methanation is not as critical to the power-to-gas vision as advocates long believed. Many electrolyzers are injecting their hydrogen directly into natural gas pipelines—something that U.S. gas firms forbid—and they are doing so without impacting either the gas infrastructure or natural gas consumers.

Europe’s first large-scale hydrogen injection began in eastern Germany in 2013 at a two-megawatt electrolyzer installed by Essen-based power firm E.ON. Germany has since ratcheted up the amount of hydrogen it allows in natural gas lines from an initial 2 percent by volume to 10 percent, in a market where renewables now outpace coal and nuclear in Germany, and other European states have followed suit with their own hydrogen allowances. Christopher Hebling, head of hydrogen technologies at the Freiburg-based Fraunhofer Institute for Solar Energy Systems, predicts that such limits will rise to the 20-percent level anticipated by Europe’s turbine manufacturers.

Moving renewable hydrogen and methane via natural gas pipelines promises to cut the cost of switching to renewable energy. For example, gas networks have storage caverns whose reserves could be tapped to run gas-fired electric generation power plants during periods of low wind and solar output. Hebling notes that Germany’s gas network can store 240 terawatt-hours of energy—roughly 25 times more energy than global power grids can presently store by pumping water uphill to refill hydropower reservoirs. Repurposing gas infrastructure to help the power system could save European consumers 138 billion euros ($156 billion) by 2050, according to Dutch energy consultancy Navigant (formerly Ecofys).

For all the pilot plants and promise, renewable hydrogen presently supplies a tiny fraction of Europe’s gas. And, globally, around 4 percent of hydrogen is supplied via electrolysis, with the bulk refined from fossil fuels, according to the International Renewable Energy Agency.

Power-to-gas is catching up, however. According to the February Nature Energy study, renewable hydrogen already pays for itself in some niche applications, and further electrolyzer improvements will progressively extend its market. “If costs continue to decline as they have done in recent years, power-to-gas will become competitive at large scale within the next decade,” says study co-author Gunther Glenk, an economist at the Technical University of Munich.

Glenk says power-to-gas could scale up faster if governments guaranteed premium prices for renewable hydrogen and methane, as they did to mainstream solar and wind power.

Tim Calver, an energy storage researcher turned consultant and Ernst & Young’s executive director in London, agrees that European governments need to step up their support for power-to-gas projects and markets. Calver calls the scale of funding to date, “not proportionate to the challenge that we face on long-term decarbonization and the potential role of hydrogen.”


Related News

View more

DP Energy Sells 325MW Solar Park to Medicine Hat

Saamis Solar Park advances Medicine Hat's renewable energy strategy, as DP Energy secures AUC approval for North America's largest urban solar, repurposing contaminated land; capacity phased from 325 MW toward an initial 75 MW.


Key Points

A 325 MW solar project in Medicine Hat, Alberta, repurposing contaminated land; phased to 75 MW under city ownership.

✅ City acquisition scales capacity to 75 MW in phased build

✅ AUC approval enables construction and grid integration

✅ Reuses phosphogypsum-impacted land near fertilizer plant


DP Energy, an Irish renewable energy developer, has finalized the sale of the Saamis Solar Park—a 325 megawatt (MW) solar project—to the City of Medicine Hat in Alberta, Canada. This transaction marks the development of North America's largest urban solar initiative, while mirroring other Canadian clean-energy deals such as Canadian Solar project sales that signal market depth.

Project Development and Approval

DP Energy secured development rights for the Saamis Solar Park in 2017 and obtained a development permit in 2021. In 2024, the Alberta Utilities Commission (AUC) granted approval for construction and operation, reflecting Alberta's solar growth trends in recent years, paving the way for the project's advancement.

Strategic Acquisition by Medicine Hat

The City of Medicine Hat's acquisition of the Saamis Solar Park aligns with its commitment to enhancing renewable energy infrastructure. Initially, the project was slated for a 325 MW capacity, which would significantly bolster the city's energy supply. However, the city has proposed scaling the project to a 75 MW capacity, focusing on a phased development approach, and doing so amid challenges with solar expansion in Alberta that influence siting and timing. This adjustment aims to align the project's scale with the city's current energy needs and strategic objectives.

Utilization of Contaminated Land

An innovative aspect of the Saamis Solar Park is its location on a 1,600-acre site previously affected by industrial activity. The land, near Medicine Hat's fertilizer plant, was previously compromised by phosphogypsum—a byproduct of fertilizer production. DP Energy's decision to develop the solar park on this site exemplifies a productive reuse of contaminated land, transforming it into a source of clean energy.

Benefits to Medicine Hat

The development of the Saamis Solar Park is poised to deliver multiple benefits to Medicine Hat:

  • Energy Supply Enhancement: The project will augment the city's energy grid, much like municipal solar projects that provide local power, providing a substantial portion of its electricity needs.

  • Economic Advantages: The city anticipates financial savings by reducing carbon tax liabilities, as lower-cost solar contracts have shown competitiveness, through the generation of renewable energy.

  • Environmental Impact: By investing in renewable energy, Medicine Hat aims to reduce its carbon footprint and contribute to global sustainability efforts.

DP Energy's Ongoing Commitment

Despite the sale, DP Energy maintains a strong presence in Canada, where Indigenous-led generation is expanding, with a diverse portfolio of renewable energy projects, including solar, onshore wind, storage, and offshore wind initiatives. The company continues to focus on sustainable development practices, striving to minimize environmental impact while maximizing energy production efficiency.

The transfer of the Saamis Solar Park to the City of Medicine Hat represents a significant milestone in renewable energy development. It showcases effective land reutilization, strategic urban planning, and a shared commitment to sustainable energy solutions, aligning with federal green electricity procurement that reinforces market demand. This project not only enhances the city's energy infrastructure but also sets a precedent for integrating large-scale renewable energy projects within urban environments.


Related News

View more

Joni Ernst calls Trump's wind turbine cancer claim 'ridiculous'

Wind Turbine Cancer Claim debunked: Iowa Republican senators back wind energy as fact-checks and DOE research find no link between turbine noise and cancer, limited effects on property values, and manageable wildlife impacts.


Key Points

Claims that turbine noise causes cancer, dismissed by studies and officials as unsupported by evidence.

✅ Grassley and Ernst call the claim idiotic and ridiculous

✅ DOE studies find no cancer link; property impacts limited

✅ Wildlife impacts mitigated; climate change poses larger risks


President Donald Trump may not be a fan of wind turbines, as shown by his pledge to scrap offshore wind projects earlier, suggesting that the noise they produce may cause cancer, but Iowa's Republican senators are big fans of wind energy.

Sen. Chuck Grassley called Trump's cancer claim "idiotic." On Thursday, Sen. Joni Ernst called the statement "ridiculous."

"I would say it's ridiculous. It's ridiculous," Ernst said, according to WHO-TV.

She likened the claim that wind turbine noise causes cancer to the idea that church bells do the same.

"I have church bells that ring all the time across from my office here in D.C. and I know that noise doesn't give me cancer, otherwise I'd have 'church bell cancer,'" Ernst said, adding that she is "thrilled" to have wind energy generation in Iowa, which aligns with a quarter-million wind jobs forecast nationwide. "I don't know what the president is drawing from."

Trump has a history of degrading wind energy and wind turbines that dates back long before his Tuesday claim that turbines harm property values and cause cancer, and often overlooks Texas grid constraints that can force turbines offline at times.

Not only are wind farms disgusting looking, but even worse they are bad for people's health.

"Not only are wind farms disgusting looking, but even worse, they are bad for people's health," Trump tweeted back in 2012.

Repeated fact-checks have found no scientific evidence to support the claim that wind turbines and the noise they make can cause cancer. The White House has reportedly provided no evidence to support Trump's cancer claim when asked this week

"It just seems like every time you turn around there's another thing the president is saying -- wind power causes cancer, I associate myself with the remarks of Chairman Grassley -- it's an 'idiotic' statement," Pelosi said in her weekly news conference on Thursday.

The president made his latest claim about wind turbines in a speech on Tuesday at a Republican spring dinner, as the industry continued recovering from the COVID-19 crisis that hit solar and wind energy.

"If you have a windmill anywhere near your house, congratulations, your house just went down 75 percent in value -- and they say the noise causes cancer," Trump said Tuesday, swinging his arm in a circle and making a cranking sound to imitate the noise of windmill blades. "And of course it's like a graveyard for birds. If you love birds, you never want to walk under a windmill. It’s a sad, sad sight."

Wind turbines are not, in fact, proven to have widespread negative impacts on property values, according to the Department of Energy's Office of Scientific and Technical Information in the largest study done so far in the U.S., even as some warn that a solar ITC extension could be devastating for the wind market, and there is no peer-reviewed data to back up the claim that the noise causes cancer.

I am considered a world-class expert in tourism. When you say, 'Where is the expert and where is the evidence?' I say: I am the evidence.

It's true wildlife is affected by wind turbines -- particularly birds and bats, with research showing whooping cranes avoid turbines when selecting stopover sites. One study estimated between 140,000 and 328,000 birds are killed annually by collisions with turbines across the U.S. The U.S. Energy Information Administration estimated, however, that other human-related impacts also contribute to declines in population.

The wind industry works with biologists to find solutions to the impact of turbines on wildlife, and the Department of Energy awards grants each year to researchers addressing the issue, even as the sector faced pandemic investment risks in 2020. But, overall, scientists warn that climate change itself is a bigger threat to bird populations than wind turbines, according to the National Audobon Society.

Speaker Nancy Pelosi: "It just seems like every time you turn around, there's another thing. The president is saying wind power causes cancer. I associate myself with the remarks of Chairman Grassley; It's an 'idiotic' statement"


Related News

View more

Power outage update: 252,596 remain without electricity Wednesday

North Carolina Power Outages continue after Hurricane Florence, with Wilmington and Eastern Carolina facing flooding, storm damage, and limited access as Duke Energy crews and mutual aid work on restoration across affected counties.


Key Points

Outages after Hurricane Florence, with Wilmington and Eastern Carolina hardest hit as crews restore service amid floods.

✅ Over 250,000 outages statewide as of early Wednesday

✅ Wilmington cut off by flooding, hindering utility access

✅ Duke Energy and EMC crews conduct phased restoration


Power is slowly being restored to Eastern Carolina residents after Hurricane Florence made landfall near Wilmington on Friday, September 15, a scenario echoed by storm-related outages in Tennessee in recent days.

On Monday, more than half a million people remained without power across the state, a situation comparable to post-typhoon electricity losses in Hong Kong reported elsewhere.

As of Wednesday morning at 1am, the Dept. of Public Safety reports 252,596 total power outages in North Carolina, and utilities continue warning about copper theft hazards during restoration.

More than half of those customers are in Eastern Carolina.

More than 32,000 customers are without power in Carteret County and roughly 21,000 are without power in Onslow County.

In Craven County, roughly 15,000 people remain without power Wednesday morning.

Many of the state's outages are effecting the Wilmington area, where Florence made landfall and widespread flooding is still cutting off the city from outside resources, similar to how a fire-triggered outage in Los Angeles disrupted service regionally.

Heavy rain, strong winds and now flooded roadways have hindered power crews, challenges that utility climate adaptation aims to address while many of them have out-of-state or out-of-town help working to restore power to so many people.

Here's a breakdown of current outages by utility company:

DUKE ENERGY PROGRESS - 

  • 1,350 in Beaufort Co. 
  • 10,706 in Carteret Co. 
  • 2,716 in Pamlico Co. 
  • 7,422 in Craven Co. 
  • 1,687 in Jones Co. 
  • 13,319 in Onslow Co. 
  • 7,452 in Pender Co. 
  • 48,281 in New Hanover Co. 
  • 5,257 in Duplin Co. 
  • 488 in Lenoir Co. 
  • 1,231 in Pitt Co.


JONES-ONSLOW EMC - 10,964 total 

  • 7,699 in Onslow Co. 
  • 2,366 in Pender Co. 
  • 816 in Jones Co.

TIDELAND EMC - 

  • 174 in Beaufort Co.
  • 1,521 in Craven Co.
  • 1,693 in Pamlico Co.

CARTERET-CRAVEN ELECTRIC CO OP- 

  • 21,974 in Carteret Co. 
  • 6,553 in Craven Co.
  • 216 in Jones Co.


Related News

View more

UK low-carbon electricity generation stalls in 2019

UK low-carbon electricity 2019 saw stalled growth as renewables rose slightly, wind expanded, nuclear output fell, coal hit record lows, and net-zero targets demand faster deployment to cut CO2 intensity below 100gCO2/kWh.


Key Points

Low-carbon sources supplied 54% of UK power in 2019, up just 1TWh; wind grew, nuclear fell, and coal dropped to 2%.

✅ Wind up 8TWh; nuclear down 9TWh amid outages

✅ Fossil fuels 43% of generation; coal at 2%

✅ Net-zero needs 15TWh per year added to 2030


The amount of electricity generated by low-carbon sources in the UK stalled in 2019, Carbon Brief analysis shows.

Low-carbon electricity output from wind, solar, nuclear, hydro and biomass rose by just 1 terawatt hour (TWh, less than 1%) in 2019. It represents the smallest annual increase in a decade, where annual growth averaged 9TWh. This growth will need to double in the 2020s to meet UK climate targets while replacing old nuclear plants as they retire.

Some 54% of UK electricity generation in 2019 came from low-carbon sources, including 37% from renewables and 20% from wind alone, underscoring wind's leading role in the power mix during key periods. A record-low 43% was from fossil fuels, with 41% from gas and just 2% from coal, also a record low. In 2010, fossil fuels generated 75% of the total.

Carbon Brief’s analysis of UK electricity generation in 2019 is based on figures from BM Reports and the Department for Business, Energy and Industrial Strategy (BEIS). See the methodology at the end for more on how the analysis was conducted.

The numbers differ from those published earlier in January by National Grid, which were for electricity supplied in Great Britain only (England, Wales and Scotland, but excluding Northern Ireland), including via imports from other countries.

Low-carbon low
In 2019, the UK became the first major economy to target net-zero greenhouse gas emissions by 2050, increasing the ambition of its legally binding Climate Change Act.

To date, the country has cut its emissions by around two-fifths since 1990, with almost all of its recent progress coming from the electricity sector.

Emissions from electricity generation have fallen rapidly in the decade since 2010 as coal power has been almost phased out and even gas output has declined. Fossil fuels have been displaced by falling demand and by renewables, such as wind, solar and biomass.

But Carbon Brief’s annual analysis of UK electricity generation shows progress stalled in 2019, with the output from low-carbon sources barely increasing compared to a year earlier.

The chart below shows low-carbon generation in each year since 2010 (grey bars) and the estimated level in 2019 (red). The pale grey bars show the estimated future output of existing low-carbon sources after old nuclear plants retire and the pale red bars show the amount of new generation needed to keep electricity sector emissions to less than 100 grammes of CO2 per kilowatt hour (gCO2/kWh), the UK’s nominal target for the sector.

 Annual electricity generation in the UK by fuel, terawatt hours, 2010-2019. Top panel: fuel by fuel. Bottom panel: cumulative total generation from all sources. Source: BEIS energy trends, BM Reports and Carbon Brief analysis. Chart by Carbon Brief using Highcharts.
As the chart shows, the UK will require significantly more low-carbon electricity over the next decade as part of meeting its legally binding climate goals.

The nominal 100gCO2/kWh target for 2030 was set in the context of the UK’s less ambitious goal of cutting emissions to 80% below 1990 levels by 2050. Now that the country is aiming to cut emissions to net-zero by 2050, that 100gCO2/kWh indicator is likely to be the bare minimum.

Even so, it would require a rapid step up in the pace of low-carbon expansion, compared to the increases seen over the past decade. On average, low-carbon generation has risen by 9TWh each year in the decade since 2010 – including a rise of just 1TWh in 2019.

Given scheduled nuclear retirements and rising demand expected by the Committee on Climate Change (CCC) – with some electrification of transport and heating – low-carbon generation would need to increase by 15TWh each year until 2030, just to meet the benchmark of 100gCO2/kWh.

For context, the 3.2 gigawatt (GW) Hinkley C new nuclear plant being built in Somerset will generate around 25TWh once completed around 2026. The world’s largest offshore windfarm, the 1.2GW Hornsea One scheme off the Yorkshire coast, will generate around 5TWh each year.

The new Conservative government is targeting 40GW of offshore wind by 2030, up from today’s figure of around 8GW. If policies are put in place to meet this goal, then it could keep power sector emissions below 100gCO2/kWh, depending on the actual performance of the windfarms built.

However, new onshore wind and solar, further new nuclear or other low-carbon generation, such as gas with carbon capture and storage (CCS), is likely to be needed if demand is higher than expected, or if the 100gCO2/kWh benchmark is too weak in the context of net-zero by 2050.

The CCC says it is “likely” to “reflect the need for more rapid deployment” of low-carbon towards net-zero emissions in its advice on the sixth UK carbon budget for 2033-2037, due in September.

Trading places
Looking more closely at UK electricity generation in 2019, Carbon Brief’s analysis shows why there was so little growth for low-carbon sources compared to the previous year.

There was another increase for wind power in 2019 (up 8TWh, 14%), with record wind generation as several large new windfarms were completed including the 1.2GW Hornsea One project in October and the 0.6GW Beatrice offshore windfarm in Q2 of 2019. But this was offset by a decline for nuclear (down 9TWh, 14%), due to ongoing outages for reactors at Hunterston in Scotland and Dungeness in Kent.

(Analysis of data held by trade organisation RenewableUK suggests some 0.6GW of onshore wind capacity also started operating in 2019, including the 0.2GW Dorenell scheme in Moray, Scotland.)

As a result of these movements, the UK’s windfarms overtook nuclear for the first time ever in 2019, becoming the country’s second-largest source of electricity generation, and earlier, wind and solar together surpassed nuclear in the UK as momentum built. This is shown in the figure below, with wind (green line, top panel) trading places with nuclear (purple) and gas (dark blue) down around 25% since 2010 but remaining the single-largest source.

 Annual electricity generation in the UK by fuel, terawatt hours, 2010-2019. Top panel: fuel by fuel. Bottom panel: cumulative total generation from all sources. Source: BEIS energy trends, BM Reports and Carbon Brief analysis. Chart by Carbon Brief using Highcharts.
The UK’s currently suspended nuclear plants are due to return to service in January and March, according to operator EDF, the French state-backed utility firm. However, as noted above, most of the UK’s nuclear fleet is set to retire during the 2020s, with only Sizewell B in Suffolk due to still be operating by 2030. Hunterston is scheduled to retire by 2023 and Dungeness by 2028.

Set against these losses, the UK has a pipeline of offshore windfarms, secured via “contracts for difference” with the government, at a series of auctions. The most recent auction, in September 2019, saw prices below £40 per megawatt hour – similar to current wholesale electricity prices.

However, the capacity contracted so far is not sufficient to meet the government’s target of 40GW by 2030, meaning further auctions – or some other policy mechanism – will be required.

Coal zero
As well as the switch between wind and nuclear, 2019 also saw coal fall below solar for the first time across a full year, echoing the 2016 moment when wind outgenerated coal across the UK, after it suffered another 60% reduction in electricity output. Just six coal plants remain in the UK, with Aberthaw B in Wales and Fiddlers Ferry in Cheshire closing in March.

Coal accounted for just 2% of UK generation in 2019, a record-low coal share since centralised electricity supplies started to operate in 1882. The fuel met 40% of UK needs as recently as 2012, but has plummeted thanks to falling demand, rising renewables, cheaper gas and higher CO2 prices.

The reduction in average coal generation hides the fact that the fuel is now often not required at all to meet the UK’s electricity needs. The chart below shows the number of days each year when coal output was zero in 2019 (red line) and the two previous years (blue).

 Cumulative number of days when UK electricity generation from renewable sources has been higher than that from fossil fuels. Source: BEIS energy trends, BM Reports and Carbon Brief analysis. Chart by Carbon Brief using Highcharts.
The 83 days in 2019 with zero coal generation amount to nearly a quarter of the year and include the record-breaking 18-day stretch without the fuel.

Great Britain has been running for a record TWO WEEKS without using coal to generate electricity – the first time this has happened since 1882.

The country’s grid has been coal-free for 45% of hours in 2019 so far.https://www.carbonbrief.org/countdown-to-2025-tracking-the-uk-coal-phase-out …

Coal generation was set for significant reductions around the world in 2019 – including a 20% reduction for the EU as a whole – according to analysis published by Carbon Brief in November.

Notably, overall UK electricity generation fell by another 9TWh in 2019 (3%), bringing the total decline to 58TWh since 2010. This is equivalent to more than twice the output from the Hinkley C scheme being built in Somerset. As Carbon Brief explained last year, falling demand has had a similar impact on electricity-sector CO2 emissions as the increase in output from renewables.

This is illustrated by the fact that the 9TWh reduction in overall generation translated into a 9TWh (6%) cut in fossil-fuel generation during 2019, with coal falling by 10TWh and gas rising marginally.

Increasingly renewable
As fossil-fuel output and overall generation have declined, the UK’s renewable sources of electricity have continued to increase. Their output has risen nearly five-fold in the past decade and their share of the UK total has increased from 7% in 2010 to 37% in 2019.

As a result, the UK’s increasingly renewable grid is seeing more minutes, hours and days during which the likes of wind, solar and biomass collectively outpace all fossil fuels put together, and on some days wind is the main source as well.

The chart below shows the number of days during each year when renewables generated more electricity than fossil fuels in 2019 (red line) and each of the previous four years (blue lines). In total, nearly two-fifths of days in 2019 crossed this threshold.

 Cumulative number of days when the UK has not generated any electricity from coal. Source: BEIS energy trends, BM Reports and Carbon Brief analysis. Chart by Carbon Brief using Highcharts.
There were also four months in 2019 when renewables generated more of the UK’s electricity than fossil fuels: March, August, September and December. The first ever such month came in September 2018 and more are certain to follow.

National Grid, which manages Great Britain’s high-voltage electricity transmission network, is aiming to be able to run the system without fossil fuels by 2025, at least for short periods. At present, it sometimes has to ask windfarm operators to switch off and gas plants to start running in order to keep the electricity grid stable.

Note that biomass accounted for 11% of UK electricity generation in 2019, nearly a third of the total from all renewables. Some two-thirds of the biomass output is from “plant biomass”, primarily wood pellets burnt at Lynemouth in Northumberland and the Drax plant in Yorkshire. The remainder was from an array of smaller sites based on landfill gas, sewage gas or anaerobic digestion.

The CCC says the UK should “move away” from large-scale biomass power plants, once existing subsidy contracts for Drax and Lynemouth expire in 2027.

Using biomass to generate electricity is not zero-carbon and in some circumstances could lead to higher emissions than from fossil fuels. Moreover, there are more valuable uses for the world’s limited supply of biomass feedstock, the CCC says, including carbon sequestration and hard-to-abate sectors with few alternatives.

Methodology
The figures in the article are from Carbon Brief analysis of data from BEIS Energy Trends chapter 5 and chapter 6, as well as from BM Reports. The figures from BM Reports are for electricity supplied to the grid in Great Britain only and are adjusted to include Northern Ireland.

In Carbon Brief’s analysis, the BM Reports numbers are also adjusted to account for electricity used by power plants on site and for generation by plants not connected to the high-voltage national grid. This includes many onshore windfarms, as well as industrial gas combined heat and power plants and those burning landfill gas, waste or sewage gas.

By design, the Carbon Brief analysis is intended to align as closely as possible to the official government figures on electricity generated in the UK, reported in BEIS Energy Trends table 5.1.

Briefly, the raw data for each fuel is in most cases adjusted with a multiplier, derived from the ratio between the reported BEIS numbers and unadjusted figures for previous quarters.

Carbon Brief’s method of analysis has been verified against published BEIS figures using “hindcasting”. This shows the estimates for total electricity generation from fossil fuels or renewables to have been within ±3% of the BEIS number in each quarter since Q4 2017. (Data before then is not sufficient to carry out the Carbon Brief analysis.)

For example, in the second quarter of 2019, a Carbon Brief hindcast estimates gas generation at 33.1TWh, whereas the published BEIS figure was 34.0TWh. Similarly, it produces an estimate of 27.4TWh for renewables, against a BEIS figure of 27.1TWh.

National Grid recently shared its own analysis for electricity in Great Britain during 2019 via its energy dashboard, which differs from Carbon Brief’s figures.


Related News

View more

Sign Up for Electricity Forum’s Newsletter

Stay informed with our FREE Newsletter — get the latest news, breakthrough technologies, and expert insights, delivered straight to your inbox.

Electricity Today T&D Magazine Subscribe for FREE

Stay informed with the latest T&D policies and technologies.
  • Timely insights from industry experts
  • Practical solutions T&D engineers
  • Free access to every issue

Download the 2025 Electrical Training Catalog

Explore 50+ live, expert-led electrical training courses –

  • Interactive
  • Flexible
  • CEU-cerified