CSA Z463 Electrical Maintenance -
Our customized live online or in‑person group training can be delivered to your staff at your location.

- Live Online
- 6 hours Instructor-led
- Group Training Available
Regular Price:
$249
Coupon Price:
$199
LMP for Demand Response lets DR earn locational marginal pricing in FERC-regulated wholesale energy markets, advancing smart grid adoption, RTO/ISO cost-effectiveness thresholds, building interoperability standards, and competition that lowers rates for non-participating customers.
Top Insights
FERC lets DR earn LMP when cost-effective, advancing smart grid investment and competitive demand-side participation.
- Pays DR same LMP as generation when cost-effective
- RTOs/ISOs set thresholds; filings due July 22 to FERC
- Protects non-DR customers from higher per-unit costs
- Spurs smart grid, building interoperability via ASHRAE SPC 201
- Expands competition and market entry, aligns with NIST priorities
The National Electrical Manufacturers Association NEMA commends the Federal Energy Regulatory Commission FERC for a recent decision that will improve the reliability and efficiency of the electric grid.
In its final rule, FERC has allowed locational marginal price LMP to be paid to demand response DR resources in organized wholesale energy markets. This means that electricity customers can enter into a voluntary agreement to be compensated to reduce usage when a utility transmits a DR signal.
“FERC’s decision will unleash technologies that provide the grid with new efficient ways to manage its loads effectively,” said Kyle Pitsor, NEMA Vice President of Government Relations. “It will increase competition, allow new market entrants, and drive down costs for ratepayers. This policy is critical to the development of a smarter grid.”
LMP, the same market rate paid to generation resources, will be paid to DR providers and technologies in situations when it meets a cost-effectiveness threshold. This threshold will consider DR’s impact on remaining loads to prevent ratepayers who are not engaged in DR from having to incur a greater cost per unit.
Cost-effectiveness thresholds are to be determined by regional transmission organizations and independent system operators by July 22, in a filing to FERC.
Because interaction between utilities and buildings is central to the Smart Grid, NEMA’s High Performance Building Council is developing with ASHRAE American Society of Heating, Refrigerating and Air-Conditioning Engineers SPC 201, the interoperability standard that will allow all loads, generators, and meters within a high performance building to communicate in a common “language” with a utility.
Providing LMP in wholesale markets will encourage building owners to invest in DR to make their operations more efficient, from both energy and economic standpoints.
DR is one of the eight priority areas identified in the National Institute of Standards and Technology NIST Framework and Roadmap for Smart Grid Interoperability Standards.
“We have advocated that demand-side resources like DR ought to be compensated the same as supply-side resources,” said Jim Creevy, NEMA Director of Government Affairs, even as a FERC member has shown impatience with DR progress. “FERC’s decision is a major step forward in that effort.”
Related News
Related News

Energy storage poised to tackle grid challenges from rising EVs as mobile chargers bring new flexibility
EV Charging Grid Readiness addresses how rising EV adoption, larger batteries, and fast charging affect…
View more
Toronto Cleans Up After Severe Flooding
Toronto Flood Cleanup details the citywide response to storm damage after heavy rain, stressing drainage…
View more

WEC Energy Group to buy 80% stake in Illinois wind farm for $345 million
WEC Energy Blooming Grove Investment underscores Midwest renewable energy growth, with Invenergy, GE turbines, and…
View more
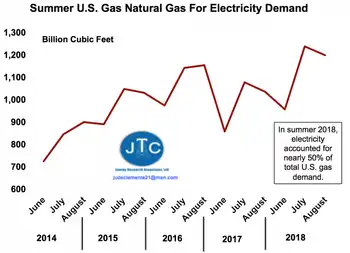
Nonstop Records For U.S. Natural-Gas-Based Electricity
U.S. Natural Gas Power Demand is surging for electricity generation amid summer heat, with ERCOT,…
View more
Electric Cooperatives, The Lone Shining Utility Star Of The Texas 2021 Winter Storm
Texas Electric Cooperatives outperformed during Winter Storm Uri, with higher customer satisfaction, equitable rolling blackouts,…
View more
California Regulators Face Calls for Action as Electricity Bills Soar
California Electricity Rate Hikes strain households as CPUC weighs fixed charges, utility profit caps, and…
View more
Sign Up for Electricity Forum’s Newsletter
Stay informed with our FREE Newsletter — get the latest news, breakthrough technologies, and expert insights, delivered straight to your inbox.
Electricity Today T&D Magazine Subscribe for FREE

Stay informed with the latest T&D policies and technologies.
- Timely insights from industry experts
- Practical solutions T&D engineers
- Free access to every issue

