NFPA 70b Training - Electrical Maintenance
Our customized live online or in‑person group training can be delivered to your staff at your location.

- Live Online
- 12 hours Instructor-led
- Group Training Available
Regular Price:
$699
Coupon Price:
$599
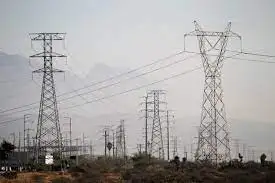
As the electric grid approaches its season of peak strain, engineers say they still cannot answer the central question of how a power failure in Ohio on Aug. 14, 2003, became the biggest blackout in North American history.
Investigators, including officials from the United States and Canada, say that the eastern power grid - the complex of generators, substations and transmission lines the power failure spread through last August - has become so large, complicated and heavily loaded in the last two decades that it is difficult to determine how a single problem can expand into an immense failure. Recently, the North American Electric Reliability Council, an industry group founded after a widespread blackout in the Northeast in 1965, issued an optimistic assessment of the electric grid for the coming summer. "Generating and transmitting resources are expected to be adequate to meet projected demand for electricity," the council said, adding that if all those involved with the grid comply with the council's reliability standards, "there should be no uncontrolled blackouts." A report issued by the Energy Department recently said the blackout began with violations of some of those standards. The report made extensive recommendations for reducing the likelihood of isolated problems - like the failure of transmission lines in Ohio last August - but it stopped short of establishing how a local problem cascaded into a catastrophe that spread from northeastern Ohio through Michigan, Ontario and New York and into parts of Connecticut and New Jersey. Investigators did identify how local failures could become larger difficulties in a way that had not been previously known: protective devices called relays could be tricked into shutting down power lines if they sensed short-circuits that did not actually exist. But the report only hinted at solutions. The report has drawn mixed reactions from electricity experts. While some said it was thorough and balanced, others said that it reflected a bias by its overseer, the Federal Energy Regulatory Commission, to de-emphasize ways that deregulation of the electric market might have affected the system's reliability and vulnerability. One expert pointed to a math error in the report as evidence of that bias. The report asserted that in the 80 percent of the eastern interconnection that remained intact, a speed-up in the frequency of the alternating current, above the usual 60 cycles, indicated a sudden surplus when power stopped flowing into the area that went dark. But the surplus number, which would illustrate how power flows have grown under deregulation, is far too small to match the frequency number given. Robert Blohm, an electricity consultant who first questioned some of the report's calculations, said in an e-mail message: "We've charged ahead with long-distance markets in electricity without realizing/understanding the reliability effects which this blackout brought home." People involved in preparing the report acknowledged that it focused on the origins of the blackout and did not fully explain how it spread. One specialist, Gerry Cauley, the director of standards at the electric reliability council, said it made sense to address promptly the events that started the blackout because they were easily preventable. The events in Ohio were "so egregious that they just should have never happened," he said. Alison Silverstein, senior energy policy adviser to the regulatory commission, who drafted much of the report, said in an interview: "Reliability is about taking care of the basics every single day. That's what all of those prior blackouts told us. That's what this blackout told us." Investigators concluded that power lines initially failed in the blackout because they came into contact with tree branches. The inquiry also found that an Ohio utility and a regional power control agency did not have the computer tools to spot failures as they occurred and make compensating adjustments.
Recently, the North American Electric Reliability Council, an industry group founded after a widespread blackout in the Northeast in 1965, issued an optimistic assessment of the electric grid for the coming summer.
"Generating and transmitting resources are expected to be adequate to meet projected demand for electricity," the council said, adding that if all those involved with the grid comply with the council's reliability standards, "there should be no uncontrolled blackouts."
A report issued by the Energy Department recently said the blackout began with violations of some of those standards. The report made extensive recommendations for reducing the likelihood of isolated problems - like the failure of transmission lines in Ohio last August - but it stopped short of establishing how a local problem cascaded into a catastrophe that spread from northeastern Ohio through Michigan, Ontario and New York and into parts of Connecticut and New Jersey.
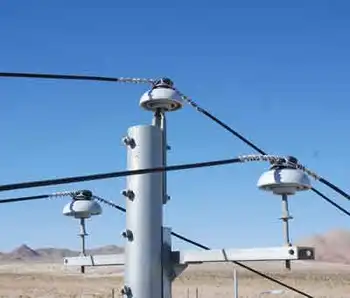
Investigators did identify how local failures could become larger difficulties in a way that had not been previously known: protective devices called relays could be tricked into shutting down power lines if they sensed short-circuits that did not actually exist. But the report only hinted at solutions.
The report has drawn mixed reactions from electricity experts. While some said it was thorough and balanced, others said that it reflected a bias by its overseer, the Federal Energy Regulatory Commission, to de-emphasize ways that deregulation of the electric market might have affected the system's reliability and vulnerability.
One expert pointed to a math error in the report as evidence of that bias. The report asserted that in the 80 percent of the eastern interconnection that remained intact, a speed-up in the frequency of the alternating current, above the usual 60 cycles, indicated a sudden surplus when power stopped flowing into the area that went dark.
But the surplus number, which would illustrate how power flows have grown under deregulation, is far too small to match the frequency number given.
Robert Blohm, an electricity consultant who first questioned some of the report's calculations, said in an e-mail message: "We've charged ahead with long-distance markets in electricity without realizing/understanding the reliability effects which this blackout brought home."
People involved in preparing the report acknowledged that it focused on the origins of the blackout and did not fully explain how it spread. One specialist, Gerry Cauley, the director of standards at the electric reliability council, said it made sense to address promptly the events that started the blackout because they were easily preventable. The events in Ohio were "so egregious that they just should have never happened," he said.
Alison Silverstein, senior energy policy adviser to the regulatory commission, who drafted much of the report, said in an interview: "Reliability is about taking care of the basics every single day. That's what all of those prior blackouts told us. That's what this blackout told us."
Investigators concluded that power lines initially failed in the blackout because they came into contact with tree branches. The inquiry also found that an Ohio utility and a regional power control agency did not have the computer tools to spot failures as they occurred and make compensating adjustments.
Related News

Diesel Prices Return to Pre-Ukrainian Conflict Levels
France Diesel Prices at Pre-Ukraine Levels reflect energy market stabilization as supply chains adapt and…
View more
Britain Prepares for High Winter Heating and Electricity Costs
UK Energy Price Cap drives household electricity bills and gas prices, as Ofgem adjusts unit…
View more

UK EV Drivers Demand Fairer Vehicle Taxes
UK EV Per-Mile Taxes are reshaping road pricing and vehicle taxation for electric cars, raising…
View more

This Floating Hotel Will Generate Electricity By Rotating All Day
Floating Rotating Eco Hotel harnesses renewable energy via VAWTAU, recycles rainwater for greywater, and follows…
View more

Energy chief says electricity would continue uninterrupted if coal phased out within 30 years
Australia Energy Policy Debate highlights IPCC warnings, Paris Agreement goals, coal phase-out, emissions reduction, renewables,…
View more
U.S. Electric Vehicle Market Share Dips in Q1 2024
U.S. EV Market Share Dip Q1 2024 reflects slower BEV adoption, rising PHEV demand, affordability…
View more
Sign Up for Electricity Forum’s Newsletter
Stay informed with our FREE Newsletter — get the latest news, breakthrough technologies, and expert insights, delivered straight to your inbox.
Electricity Today T&D Magazine Subscribe for FREE

Stay informed with the latest T&D policies and technologies.
- Timely insights from industry experts
- Practical solutions T&D engineers
- Free access to every issue

