Turbines spinning power, problems

By The Oakland Tribune


NFPA 70e Training

Our customized live online or in‑person group training can be delivered to your staff at your location.

  • Live Online
  • 6 hours Instructor-led
  • Group Training Available
Regular Price:
$199
Coupon Price:
$149
Reserve Your Seat Today
New wind farms could generate up to 7 percent of U.S. electricity in 15 years, but scientists say more attention must be paid to the threat those spinning blades present to birds and bats before the construction boom starts.

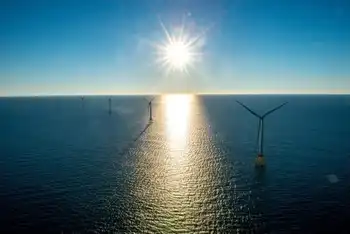
Commercial wind-generating capacity already has quadrupled to more than 11,000 megawatts since 2000, enough to power more than 3 million average homes for a year. Yet it remains a marginal part of the nation's energy portfolio, providing about 1 percent of the nation's electricity today.

President Bush and other wind-energy advocates see great potential. But a study released by the National Academies of Science said not enough is known about the threat such an expansion poses to vulnerable species such as night-migrating songbirds, bats, hawks and eagles.

"The report is a step forward. It basically says we can dramatically expand wind power, but there are some issues... we have to address," said Peter Galvin, conservation director at the Center for Biological Diversity, which has fought to reduce bird kills at the Altamont Pass wind farm.

"Provided we can resolve those and put some teeth in the regulations, there's no reason wind power couldn't provide up to a quarter of the nation's power."

The study, ordered by Congress, is "the most complete compilation of environmental impacts, and impacts on humans, positive and negative, from wind energy that's yet been done," said Paul Risser, chairman of the committee that wrote the report and a researcher at the University of Oklahoma at Norman.

"The human impacts of wind farms can be both positive and negative," he said.

Overall, the report noted, wind-energy development benefits wide areas via reduced air pollutants, while the environmental costs, such as ecological effects and bird deaths, occur locally.

But the panel declined to say whether benefits outweigh costs or vice versa, leaving that decision to state and local officials and the public.

The study assumed wind's share of the nation's power supply would hit a maximum of 7 percent by 2020. Such growth requires as many as 36,000 new turbines, each with blades equal to the wingspan of a 747 jet on towers up to 300 feet tall, all on high ground where the wind blows an average of 10 mph or better.

Federal regulation of wind projects on private land is minimal, the report observes. And while some states have developed guidelines, wind energy is such a recent addition to power production in most areas that most states are relatively inexperienced at planning and regulation. The exception is a handful of states such as Texas and California that have large concentrations of wind farms.

The good side of wind energy, of course, is that once in place, turbines don't pollute air or water. The report figures that if wind power does produce 7 percent of the nation's energy by 2020, it would offset as much as 4.5 percent of emissions of greenhouse-gas carbon dioxide produced from electricity generation.

But the downsides can be considerable, and the Altamont Pass wind farm is often cited as an example of the dangers of installing turbines without paying careful attention to environmental costs.

"The Altamont Pass was a bad place to build," said Elizabeth Murdock, executive director of the Golden Gate Audubon Society, which sued Alameda County and the wind farm operators over bird deaths.

"If we knew 20 years ago what we know now, we would probably never build there."

The wind farm boasts more than 5,000 turbines and sits in the midst of a crucial bird migration corridor and the world's largest known Golden Eagle nesting territory.

A 2004 study figured the farm's blades killed 1,300 raptors a year. In January, Golden Gate Audubon Society settled its lawsuit. The companies agreed to halve the number of bird kills by 2009 and find a way to make power generation and birds co-exist.

Lessons learned there will be disseminated nationwide, Murdock added. "We are on the path right now to a sustainable solution to Altamont Pass. Whether we've accomplished it, we can't say now. But we are on the path."

Related News

U.S. Electricity and natural gas prices explained

Energy Pricing Factors span electricity generation, transmission, and distribution costs, plus natural gas supply-demand, renewables, seasonal peaks, and wholesale pricing effects across residential, commercial, and industrial customers, usage patterns, weather, and grid constraints.


Key Points

They are the costs and market forces driving electricity and natural gas prices, from generation to delivery and demand.

✅ Generation, transmission, distribution shape electricity rates

✅ Gas prices hinge on supply, storage, imports/exports

✅ Demand shifts: weather, economy, and fuel alternatives


There are a lot of factors that affect energy prices globally. What’s included in the price to heat homes and supply them with electricity may be a lot more than some people may think.

Electricity
Generating electricity is the largest component of its price, according to the U.S. Energy Information Administration (EIA). Generation accounts for 56% of the price of electricity, while distribution and transmission account for 31% and 13% respectively.

Homeowners and businesses pay more for electricity than industrial companies, and U.S. electricity prices have recently surged, highlighting broader inflationary pressures. This is because industrial companies can take electricity at higher voltages, reducing transmission costs for energy companies.

“Industrial consumers use more electricity and can receive it at higher voltages, so supplying electricity to these customers is more efficient and less expensive. The price of electricity to industrial customers is generally close to the wholesale price of electricity,” EIA explains.

NYSEG said based on the average use of 600 kilowatt-hours per month, its customers spent the most money on delivery and transition charges in 2020, 57% or about $42, and residential electricity bills increased 5% in 2022 after inflation, according to national data. They also spent on average 35% (~$26) on supply charges and 8% (~$6) on surcharges.

Electricity prices are usually higher in the summer. Why? Because energy companies use sources of electricity that cost more money. It used to be that renewable sources, like solar and wind, were the most expensive sources of energy but increased technological advances have changed this, according to the International Energy Agency’s 2021 World Energy Outlook.

“In most markets, solar PV or wind now represents the cheapest available source of new electricity generation. Clean energy technology is becoming a major new area for investment and employment – and a dynamic arena for international collaboration and competition,” the report said.

Natural gas
The price of natural gas is driven by supply and demand. If there is more supply, prices are generally lower. If there is not as much supply, prices are generally higher the EIA explains. On the other side of the equation, more demand can also increase the price and less demand can decrease the price.

High natural gas prices mean people turn their home thermostats down a few degrees to save money, so the EIA said reduced demand can encourage companies to produce more natural gas, which would in turn help lower the cost. Lower prices will sometimes cause companies to reduce their production, therefore causing the price to rise.

The three major supply factors that affect prices: the amount of natural gas produced, how much is stored, and the volume of gas imported and exported. The three major demand factors that affect price are: changes in winter/summer weather, economic growth, and the broader energy crisis dynamics, as well as how much other fuels are available and their price, said EIA.

To think the price of natural gas is higher when the economy is thriving may sound counterintuitive but that’s exactly what happens. The EIA said this is because of increases in demand.


Related News

View more

BC Hydro activates "winter payment plan"

BC Hydro Winter Payment Plan lets customers spread electricity bills over six months during cold weather, easing costs amid colder-than-average temperatures in British Columbia, with low-income conservation support, energy-saving kits, and insulation upgrades.


Key Points

Allows BC Hydro customers to spread winter electricity bills over six months, with added low-income efficiency support.

✅ Spread Dec-Mar bills across six months

✅ Eases costs during colder-than-average temperatures

✅ Includes low-income conservation and energy-saving kits


As colder temperatures set in across the province again this weekend, BC Hydro says it is activating its winter payment plan to give customers the opportunity to spread out their electricity bills as demand can reach record levels during extreme cold periods.

"Our meteorologists are predicting colder-than-average temperatures will continue over the next of couple of months and we want to provide customers with help to manage their payments," said Chris O'Riley, BC Hydro's president.

All BC Hydro customers will be able to spread payments from the billing period spanning Dec. 1, 2017 to March 31, 2018 over a six-month period.

Cold weather in the second half of December 2017 led to surging electricity demand that was higher than the previous 10-year average and has at times hit all-time highs during peak usage periods, according to BC Hydro.

Hydro operations also respond to summer conditions, as drought and low rainfall can force adjustments in power generation strategies.

People who heat their homes with electricity — about 40 per cent of British Columbians —  have the highest overall bills in the province, $197 more in December than in July, when air conditioning use can affect energy costs.

This is the second year the Crown corporation has activated a cold-weather payment plan, part of broader customer assistance programs it offers.  

BC Hydro has also increased funding for its low-income conservation programs by $2.2 million for a total of $10 million over the next three years. 

The low-income program provides energy-saving kits that include things like free energy assessments, insulation upgrades and weather stripping. 


Related News

View more

Economic Crossroads: Bank Earnings, EV Tariffs, and Algoma Steel

Canada Economic Crossroads highlights bank earnings trends, interest rates, loan delinquencies, EV tariffs on Chinese imports, domestic manufacturing, Algoma Steel decarbonization, sustainability, and housing market risks shaping growth, investment, consumer prices, and climate policy.


Key Points

An overview of how bank earnings, EV tariffs, and Algoma Steel's transition shape Canada's economy.

✅ Higher rates lift margins but raise delinquencies and housing risks

✅ EV tariffs aid domestic makers but pressure consumer prices

✅ Algoma invests to decarbonize, boosting efficiency and compliance


In a complex economic landscape, recent developments have brought attention to several pivotal issues affecting Canada's business sector. The Globe and Mail’s latest report delves into three major topics: the latest bank earnings, the implications of new tariffs on Chinese electric vehicles (EVs), and Algoma Steel’s strategic maneuvers. These factors collectively paint a picture of the challenges and opportunities facing Canada's economy.

Bank Earnings Reflect Economic Uncertainty

The recent financial reports from major Canadian banks have revealed a mixed picture of the nation’s economic health. As the Globe and Mail reports, earnings results show robust performances in some areas while highlighting growing concerns in others. Banks have generally posted strong quarterly results, buoyed by higher interest rates which have improved their net interest margins. This uptick is largely attributed to the central bank's monetary policies aimed at combating inflation and stabilizing the economy.

However, the positive earnings are tempered by underlying economic uncertainties. Rising loan delinquencies and a slowing housing market are areas of concern. Increased interest rates, while beneficial for banks’ margins, have also led to higher borrowing costs for consumers and businesses. This dynamic has the potential to impact overall economic growth and consumer confidence.

Tariffs on Chinese EVs: A Strategic Shift

Another significant development is the imposition of new tariffs on Chinese electric vehicles. This move is part of a broader strategy to protect domestic automotive industries and address trade imbalances, aligning with public support for tariffs in key sectors. The tariffs are expected to increase the cost of Chinese EVs in Canada, which could have several implications for the market.

On one hand, the tariffs might provide a temporary boost to Canadian and North American manufacturers by reducing competition from lower-priced Chinese imports. This protectionist measure could encourage investments in local production and innovation, mirroring tariff threats boosting support for energy projects in other sectors. However, the increased cost of Chinese EVs may also lead to higher prices for consumers, potentially slowing the adoption of electric vehicles—a critical goal in Canada’s climate strategy.

The tariffs come at a time when the Canadian government is keen on accelerating the transition to electric mobility to meet its environmental targets, even as a critical crunch in electrical supply raises questions about grid readiness. Balancing the protection of domestic industries with the broader goal of reducing emissions will be a significant challenge moving forward.

Algoma Steel’s Strategic Evolution

In the steel industry, Algoma Steel has been making headlines with its strategic initiatives aimed at transforming its operations, in a broader shift toward clean grids and industrial decarbonization. The Globe and Mail highlights Algoma Steel's efforts to modernize its production processes and shift towards more sustainable practices. This includes significant investments in technology and infrastructure to enhance production efficiency and reduce environmental impact.

Algoma's focus on reducing carbon emissions aligns with broader industry trends towards sustainability. The company’s efforts are part of a larger push within the steel sector to address climate change and meet regulatory requirements. As one of Canada’s leading steel producers, Algoma’s actions could set a precedent for the industry, showcasing how traditional manufacturing sectors can adapt to evolving environmental standards.

Implications and Future Outlook

The interplay of these developments reflects a period of significant transition for Canada's economy, shaped in part by U.S. policy where Biden is seen as better for Canada's energy sector by some analysts. For banks, the challenge will be to navigate the balance between profitability and potential risks from a changing economic environment. The new tariffs on Chinese EVs represent a strategic shift with mixed implications for the automotive market, potentially influencing both domestic production and consumer prices. Meanwhile, Algoma Steel’s push towards sustainability could serve as a model for other industries seeking to align with environmental goals.

As these issues unfold, stakeholders across sectors will need to stay informed and adaptable. For policymakers, the challenge will be to support domestic industries while fostering innovation and sustainability, including the dilemma over electricity rates and innovation they must weigh. For businesses, the focus will be on navigating financial pressures and leveraging opportunities for growth. Consumers, in turn, will face the impact of these developments in their daily lives, from the cost of borrowing to the price of electric vehicles.

In summary, Canada’s current economic landscape is characterized by a blend of financial resilience, strategic adjustments, and evolving industry practices, amid policy volatility such as a tariff threat delaying Quebec's green energy bill earlier this year. As the country navigates these crossroads, the outcomes of these developments will play a crucial role in shaping the future economic environment.


Related News

View more

Emissions rise 2% in Australia amid increased pollution from electricity and transport

Australia's greenhouse gas emissions rose in Q2 as electricity and transport pollution increased, despite renewable energy growth. Net zero targets, carbon dioxide equivalent metrics, and land use changes underscore mixed trends in decarbonisation.


Key Points

About 499-500 Mt CO2-e annually, with a 2% quarterly rise led by electricity and transport.

✅ Q2 emissions rose to 127 Mt from 124.4 Mt seasonally adjusted

✅ Electricity sector up to 41.6 Mt; transport added nearly 1 Mt

✅ Land use remains a net sink; renewables expanded capacity


Australia’s greenhouse gas emissions rose in the June quarter by about 2% as pollution from the electricity sector and transport increased.

Figures released on Tuesday by the Morrison government showed that on a year to year basis, emissions for the 12 months to last June totalled 498.9m tonnes of carbon dioxide equivalent. That tally was down 2.1%, or 10.8m tonnes compared with the same period a year earlier.

However, on a seasonally adjusted quarterly basis, emissions increased to 127m tonnes, or just over 2%, from the 124.4m tonnes reported in the March quarter. For the year to March, emissions totalled 494.2m tonnes, underscoring the pickup in pollution in the more recent quarter even as global coal power declines worldwide.

A stable pollution rate, if not a rising one, is also implied by the government’s release of preliminary figures for the September quarter. They point to 125m tonnes of emissions in trend terms for the July-September months, bringing the year to September total to about 500m tonnes, the latest report said.

The government has made much of Australia “meeting and beating” climate targets. However, the latest statistics show mostly emissions are not in decline despite its pledge ahead of the Glasgow climate summit that the country would hit net zero by 2050, and AEMO says supply can remain uninterrupted as coal phases out over the next three decades.

“Nothing’s happening except for the electricity sector,” said Hugh Saddler, an honorary associate professor at the Australian National University. Once Covid curbs on the economy eased, such as during the current quarter, emission sources such as from transport will show a rise, he predicted.

Falling costs for new wind and solar farms, with the IEA naming solar the cheapest in history worldwide, are pushing coal and gas out of electricity generation, as well as pushing down power prices. In seasonally adjusted terms, though, emissions for that sector rose from 39.7m tonnes the March quarter to 41.6m in the June one.

Most other sectors were steady, with pollution from transport adding almost 1m tonnes in the June quarter.

On an annual basis, a 500m tonnes tally is the lowest since records began in the 1990s, and IEA reported global emissions flatlined in 2019 for context. That lower trajectory, though, is lower due much to the land sector remaining a net sink even as some experts raise questions about the true trends when it comes to land clearing.

According to the government, this sector – known as land use, land-use change and forestry – amounted to a net reduction of emissions of 24.4m tonnes, or almost negative 5% of the national total, in the year to June.

Sign up to receive an email with the top stories from Guardian Australia every morning

“The magnitude of this net sink has decreased by 0.6% (0.2 Mt CO2-e) on the previous 12 months due to an increase in emissions from agricultural soils, partially offset by a continuing decline in land clearing emissions,” the latest report said.

For its part, the government also touted the increase of renewable energy, as seen in Canada's electricity progress too, as central to driving emissions lower.

“Since 2017, Australia’s consumption of renewable energy has grown at a compound annual rate of 4.6%, with more than $40bn invested in Australia’s renewable energy sector,” Angus Taylor, the federal energy minister said, while UK net zero policy changes show a different approach. “Last year, Australia deployed new solar and wind at eight times the global per capita average.”

ANU’s Saddler said the main driver had been the 2020 Renewable Energy Target that the Coalition government had cut, and had anyway been implemented “a very considerable time ago”.

Tim Baxter, the Climate Council’s senior researcher, said “the time for leaning on the achievements of others is long since past”.

“We need a federal government willing to step up on emissions reductions and take charge with real policy, not wishlists,” he said, referring to the government’s net zero plan to rely on technologies to cut pollution in pursuit of a sustainable electric planet in practice, some of which don’t exist now.


Related News

View more

Parsing Ontario's electricity cost allocation

Ontario Global Adjustment and ICI balance hydro rates, renewable cost shift, and peak demand. Class A and Class B customers face demand response decisions amid pandemic occupancy uncertainty and volatile GA charges through 2022.


Key Points

A pricing model where GA costs and ICI peak allocation shape Class A/B bills, driven by renewables cost shifts.

✅ Renewable cost shift trims GA; larger Class A savings expected.

✅ Class A peak strategy returns; occupancy uncertainty persists.

✅ Class B faces volatile GA; limited levers beyond efficiency.


Ontario’s large commercial electricity customers can approach the looming annual decision about their billing structure for the 12 months beginning July 1 with the assurance of long-term relief on a portion of their costs, amid changes coming for electricity consumers that could affect planning. That’s to be weighed against uncertainties around energy demand and whether a locked-in cost allocation formula that looked favourable in pre-pandemic times will remain so until June 30, 2022.

“The biggest unknown is we just don’t know when the people are coming back,” Jon Douglas, director of sustainability with Menkes Property Management Services, reflected during a webinar sponsored by the Building Owners and Managers Association (BOMA) of Greater Toronto last week. “The occupancy in our office buildings this fall, and going into the new year, could really impact the outcome of the decision.”

After a year of operational upheaval and more modifications to provincial electricity pricing policies, BOMA Toronto’s regularly scheduled workshop ahead of the June 15 deadline for eligible customers to opt into the Industrial Conservation Initiative (ICI) program had a lot of ground to cover. Notably, beginning in January, all commercial customers have seen a reduction in the global adjustment (GA) component of their monthly hydro bills after the Ontario government shifted costs associated with contracted non-hydroelectric renewable supply to reduce the burden on industrial ratepayers from electricity rates to the general provincial account — a move that trims approximately $258 million per month from the total GA charged to industrial and commercial customers. However, they won’t garner the full benefit of that until 2022 since they’re currently repaying about $333 million in GA costs that were deferred in April, May and June of 2020.

Renewable cost shift pares the global adjustment
For now, Ontario government officials estimate the renewable cost shift equates to a 12 per cent discount relative to 2020 prices, even as typical bills may rise about 2% as fixed pricing ends in some cases. Once last year’s GA deferral is repaid at the end of 2021, they project the average Class A customer participating in the ICI program should realize a 16 per cent saving on the total hydro bill, while Class B customers paying the GA on a volumetric per kilowatt-hour (kWh) basis will see a slightly more moderate 15 per cent decrease.

“This is the biggest change to electricity pricing that’s happened since the introduction of ICI,” Tim Christie, director of electricity policy, economics and system planning for Ontario’s Ministry of Energy, Northern Development and Mines, told online workshop attendees. “The government is funding the out-of-market costs of renewables. It does tail off into the 2030s as those contracts (for wind, solar and biomass generation) expire, but over the next eight-ish years, it’s pretty steady at around just over $3 billion per year.”

Extrapolating from 2020 costs, he pegged average electricity costs at roughly 9.1 cents/kWh for Class A commercial customers and 13.2 cents/kWh for Class B, a point of concern for Ontario manufacturers facing high rates as well. However, energy management specialists suggest actual 2021 numbers haven’t proved that out.

“In commercial buildings, we’re averaging 10 to 12 cents for Class A in 2021, and we’re seeing more than that for about 14, 15 cents for Class B,” reported Scott Rouse, managing partner with the consulting firm, Energy@Work.

GA costs for Class B customers dropped nearly 30 per cent in the first four months of 2021 compared to the last four months of 2020, when they averaged 11.8 cents/kWh. Thus far, though, there have been significant month-to-month fluctuations, with a low of 5.04 cents/kWh in February and a high of 10.9 cents/kWh in April contributing to the four-month average of 8.3 cents/kWh.

“In 2020, system-wide GA very often averaged more than $1 billion per month,” Rouse said. “This February it dropped to $500 million, which was really quite surprising. So it is a very volatile cost.”

Although welcome, the renewable cost shift does alter the payback on energy-saving investments, particularly for demand response mechanisms like energy storage. When combined with pandemic-related uncertainty and a series of policy and program reversals alongside calls to clean up Ontario’s hydro policy in recent years, the industry’s appetite for some more capital-intensive technologies appears to be flagging.

“Volatility puts a pause on some of the innovation,” said Terry Flynn, general manager with BentallGreenOak and chair of BOMA Toronto’s energy committee. “It could be a leading edge, but it might be a bleeding edge that won’t bear any fruit because the way the commodity costs are structured will change.”

“There’s kind of a wait-and-see approach on some of these bigger investments,” Douglas concurred.

Industrial Conservation Initiative underpins commercial class divide
Turning to the ICI, Class A customers — defined as those with average monthly energy demand of at least 1 megawatt (MW) — encountered some unexpected changes to the program rules during 2020. Meanwhile, Class B customers — encompassing the vast share of commercial properties smaller than about 350,000 square feet — confront the persistent reality of electricity cost allocation that offloads the burden from larger players onto them.

Through the ICI, participating Class A customers pay a share of the global adjustment that’s prorated to their energy use during the five hours of the period from May 1 to April 30 when the highest overall system demand is recorded. This gives Class A customers the opportunity to lock in a favourable factor for calculating their share of monthly system-wide global adjustment costs if they can successful project and curtail energy loads during those five hours of peak demand. On the flipside, Class B customers pay the remainder of those system-wide costs, on a straightforward per-kWh basis, once Class A payments have been reconciled.

“Class B has sometimes been regarded as the forgotten middle child of the customer classes in Ontario where all the shifted costs in the system kind of pile up,” acknowledged Mark Olsheski, vice president, energy and environment, with Sussex Strategy Group. “Likewise, there can be big unpredictable and uncontrollable swings in the global adjustment rate from month to month and, outside of pure energy efficiency, there really is precious little opportunity or empowerment for a Class B customer to take actions to lower their bills.”

Nevertheless, COVID-19 presents a few extra hiccups for Class A customers this year. Conventionally, late May is when they receive notification of the cost allocation factor that would be used to determine their GA for the upcoming July 1 to June 30 period. This year, though, all current ICI participants will retain the factor they secured by responding to the five hours of peak demand during the 12 months from May 1, 2019 to April 30, 2020 after the Ontario government placed a temporary halt on the peak demand response aspect of the program last summer. Regardless, eligible ICI participants must formally opt into the program by June 15 or they will be billed as Class B customers.

Peak chasing resumes for summer 2021
Since peak demand hours conventionally occur from June to September, Class A customers will once again be studying forecasts intently and preparing to respond via Peak Perks as the heat wave season sets in. That should help alleviate some of the system stresses that arose last summer — prompting policy-makers to reject lobbying for a continued pause on peak demand response.

“The policy rationale was to allow consumers to focus on their operations when recovering from COVID as opposed to reducing peaks. The other issue was that we did not expect the peaks to be high last summer given COVID shutdowns,” Christie recounted. “But due to some hot weather, more people at home and also the lack of ICI response, we saw peaks we haven’t seen in many, many years come up last summer. So the peak hiatus has ended and this summer we’ll be back to responding to ICI as per normal.”

Among Class A customers, owners/managers of office and retail facilities generally have the most to lose from a billing formula tied to the energy demand of more densely occupied buildings in the summer of 2019. However, they could be much more competitively positioned for 2022-23 if their buildings remain below full occupancy and energy demand stays lower than usual this summer.

“Where we can improve is the IESO (Independent Electricity System Operator) and the LDCs (local distribution companies) need to help customers get their real-time data, especially in light of the phantom demand issue, interpret their bills and their Class A versus B scenarios much more easily and comprehensively,” urged Lee Hodgkinson, vice president, technical services, sustainability and ESG, with Dream Unlimited. “ I look for APIs (application programming interface) and direct data flow from the LDCs to the building owners so that we can access that data really easily.”

Given Class A’s historic advantages, few eligible ICI participants are expected to migrate out to Class B. From a sustainability perspective, there’s perhaps more cause to question how the ICI’s 1-MW threshold encourages strategies to move in the other direction.

“You could jack up demand in some buildings and get them into Class A basically by firing up the chillers on the weekend and then pouring cooling outside to get rid of it,” Douglas noted. “That has nothing to do with climate change strategy or sustainability, but it’s a cost- saving strategy, and, sometimes, when you look at the math, it’s hundreds of thousands of dollars you can save.”

Brian Hewson, vice president, consumer protection and industry performance with the Ontario Energy Board (OEB), confirmed the OEB is currently scrutinizing the discrepancy that leaves Class B as the only consumer group with no flexibility to curtail energy load during higher-priced periods, and will be providing advice to the Ministry of Energy. In the interim, that status does, at least, simplify tactics.

“Just reduce your kWh and it doesn’t matter what time of day because you’re paying that fixed rate for 24 hours a day. So if you can curb your demand at night, you get a big bang for your dollar,” Rouse advised.

“We do talk about rates a lot, but if you’re not using it, you’re not paying for it,” Flynn agreed. “A lot of our focus is still on really to try to reduce the number of kilowatts that we use. That seems to be the best thing to do.”


Related News

View more

Ex-SpaceX engineers in race to build first commercial electric speedboat

Arc One Electric Speedboat delivers zero-emission performance, quiet operation, and reduced maintenance, leveraging battery propulsion, aerospace engineering, and venture-backed innovation to cut noise pollution, fuel costs, and water contamination in high-performance marine recreation.


Key Points

Arc One Electric Speedboat is a battery-powered, zero-emission craft offering quiet, high-performance marine cruising.

✅ 475 hp, 24 ft hull, about 40 mph top speed

✅ Cuts noise, fumes, and water contamination vs gas boats

✅ Backed by Andreessen Horowitz; ex-SpaceX engineers


A team of former SpaceX rocket engineers have joined the race to build the first commercial electric speedboat.

The Arc Boat company announced it had raised $4.25m (£3m) in seed funding to start work on a 24ft 475-horsepower craft that will cost about $300,000.

The LA-based company, which is backed by venture capital firm Andreessen Horowitz (an early backer of Facebook and Airbnb), said the first model of the Arc One boat would be available for sale by the end of the year.

Mitch Lee, Arc’s chief executive, said he wanted to build electric boats because of the impact conventional petrol- or diesel-powered boats have on the environment.

“They not only get just two miles to the gallon, they also pump a lot of those fumes into the water,” Lee said. “In addition, there is the huge noise pollution factor [of conventional boats] and that is awful for the marine life. With gas-powered boats it’s not just carbon emissions into the air, it’s also polluting the water and causing noise pollution. Electric boats, like electric ships clearing the air on the B.C. coast, eliminate all that.”

Lee said electric vessels would also reduce the hassle of boat ownership. “I love being out on the water, being on a boat is so much fun, but owning a boat is so awful,” he said. “I have always believed that electric boats make sense. They will be quicker, quieter and way cheaper and easier to operate and maintain, with access options like an electric boat club in Seattle lowering barriers for newcomers.”

While the first models will be very expensive, Lee said the cost was mostly in developing the technology and cheaper versions would be available in the future, mirroring advances in electric aviation seen across the industry. “It is very much the Tesla approach – we are starting up market and using that income to finance research and development and work our way down market,” he said.

Lee said the technology could be applied to larger craft, and even ferries could run on electricity in the future, as projects for battery-electric high-speed ferries begin to scale.

“We started in February with no team, no money and no warehouse,” he said. “By December we are going to be selling the Arc One, and we are hiring aggressively because we want to accelerate the adoption of electric boats across a whole range of craft, including an electric-ready ferry on Kootenay Lake.”

Lee founded the company with fellow mechanical engineer Ryan Cook. Cook, the company’s chief technology officer, was previously the lead mechanical engineer at Elon Musk’s space exploration company SpaceX where he worked on the Falcon 9 rocket, the world’s first orbital class reusable rocket. In parallel, Harbour Air's electric aircraft highlights cross-sector electrification. Apart from Lee, all of Arc’s employees have some experience working at SpaceX.

The Arc boat, which would have a top speed of 40 mph, joins a number of startups rushing to make the first large-scale production of electric-powered speedboats, while a Vancouver seaplane airline demonstrates complementary progress with a prototype electric aircraft. The Monaco Yacht Club this month held a competition for electric boat prototypes to “instigate a new vision and promote all positive approaches to bring yachting into line” with global carbon dioxide emission reduction targets. Sweden’s Candela C-7 hydrofoil boat was crowned the fastest electric vessel.


Related News

View more

Sign Up for Electricity Forum’s Newsletter

Stay informed with our FREE Newsletter — get the latest news, breakthrough technologies, and expert insights, delivered straight to your inbox.

Electricity Today T&D Magazine Subscribe for FREE

Stay informed with the latest T&D policies and technologies.
  • Timely insights from industry experts
  • Practical solutions T&D engineers
  • Free access to every issue

Live Online & In-person Group Training

Advantages To Instructor-Led Training – Instructor-Led Course, Customized Training, Multiple Locations, Economical, CEU Credits, Course Discounts.

Request For Quotation

Whether you would prefer Live Online or In-Person instruction, our electrical training courses can be tailored to meet your company's specific requirements and delivered to your employees in one location or at various locations.