Substation Relay Protection Training
Our customized live online or in‑person group training can be delivered to your staff at your location.

- Live Online
- 12 hours Instructor-led
- Group Training Available
Regular Price:
$699
Coupon Price:
$599
The Federal Energy Regulatory Commission (FERC) further refined its electric reliability program by adopting administrative policy for FERC review of notices of penalty filed by the Commission-certified electric reliability organization (ERO), and by proposing to adopt six modified reliability standards from the ERO.
FERC designated the North American Electric Reliability Corp. (NERC) as the nationÂ’s electric reliability organization in 2006. Five of the six proposed reliability standards relate to interchange scheduling and coordination, while one pertains to transmission loading relief procedures. FERC also proposes to approve NERCÂ’s interpretation of five specific requirements of Commission-approved reliability standards.
Each standard involved in this Notice of Proposed Rulemaking was approved by FERC in Order No. 693. Comments on the proposed rule, Modification of Interchange and Transmission Loading Relief Reliability Standards; and Electric Reliability Organization Interpretation of Specific Requirements of Four Reliability Standards, are due 45 days after publication in the Federal Register.
In adopting a new administrative policy for review of notices of penalty filed by the NERC, the FERC order sets out schedules for filing, intervention and review by the Commission.
Any entity subject to a NERC notice of penalty may file an application for review with 30 days of the notice being filed with FERC. Interventions on the application for review must be filed within 20 days. FERC will generally take action on the application within 60 days of the application for review, although it may extend that time period. Notices of penalty filed by NERC are also subject to FERCÂ’s initiation of review on its own motion within 30 days of the notice being filed.
Though required to review every notice for which a registered entity files an application for review, FERC said it does not anticipate moving to review every notice of penalty filed by NERC. FERCÂ’s review of all uncontested notices of penalty would be inconsistent with the enforcement discretion of NERC and the Regional Entities.
Nevertheless, as FERC bears ultimate responsibility for the enforcement of reliability standards, it may review notices of penalty even if the registered entity subject to the notice does not file for review. In these cases, FERC will weigh the seriousness of the violation when deciding whether to review penalty amounts. FERC also said it retains the authority to review the notices on its own motion to ensure that penalties are applied in a reasonably consistent manner and improve compliance with reliability standards.
This order also revises the policy outlined in Order No. 672 concerning FERC review of settlements by Regional Entities or NERC of alleged violations. That order stated that while settlements will be made public, settlements would neither be noticed for public comment nor subject to FERC review.
FERC is changing that policy by stating that it will review penalty settlements by Regional Entities and NERC, to be consistent with its policy in other contexts of reviewing settlements. FERC stressed that it continues to encourage the Regional Entities and NERC to enter into settlements, and that it will normally allow NERC and Regional Entity settlements to become effective.
In July 2006, FERC designated NERC as the ERO under section 215 of the Federal Power Act a new provision added by the Energy Policy Act of 2005 to establish a system of mandatory, enforceable reliability standards under the Commission's oversight. NERC has submitted 107 proposed Reliability Standards to FERC. In Order No. 693, issued March 16, 2007, FERC approved 83 of these standards. FERC also directed NERC to develop modifications to 56 of the 83 approved standards.
Related News

UK peak power prices rise to second highest level since 2018
UK Peak Power Prices surged as low wind speeds forced National Grid to rely on…
View more
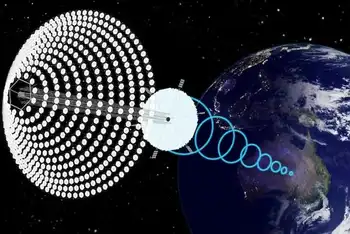
How to Get Solar Power on a Rainy Day? Beam It From Space
Space solar power promises wireless energy from orbital solar satellites via microwave or laser power…
View more
Manitoba Government Extends Pause on New Cryptocurrency Connections
Manitoba Crypto Mining Electricity Pause signals a moratorium to manage grid strain, Manitoba Hydro capacity,…
View more
California's future with income-based flat-fee utility bills is getting closer
California Income-Based Utility Fees would overhaul electricity bills as CPUC weighs fixed charges tied to…
View more
CALIFORNIA: Why your electricity prices are soaring
California Electricity Prices are surging across PG&E, SCE, and SDG&E territories, driven by fixed grid…
View more

Why Is Central Asia Suffering From Severe Electricity Shortages?
Central Asia power shortages strain grids across Kazakhstan, Uzbekistan, Kyrgyzstan, Tajikistan, and Turkmenistan, driven by…
View more
Sign Up for Electricity Forum’s Newsletter
Stay informed with our FREE Newsletter — get the latest news, breakthrough technologies, and expert insights, delivered straight to your inbox.
Electricity Today T&D Magazine Subscribe for FREE

Stay informed with the latest T&D policies and technologies.
- Timely insights from industry experts
- Practical solutions T&D engineers
- Free access to every issue

