Texas Blackout Liability Ruling clarifies appellate court findings in Houston, citing deregulated energy markets, ERCOT immunity, wholesale generators, retail providers, and 2021 winter storm lawsuits over grid failures and wrongful deaths.
Key Points
Houston judges held wholesale generators owe no duty to retail customers, limiting liability for 2021 blackout lawsuits.
✅ Court cites deregulated market and lack of privity to consumers
✅ Ruling shields generators from 2021 winter storm civil suits
✅ Plaintiffs plan appeals; legislature may address liability
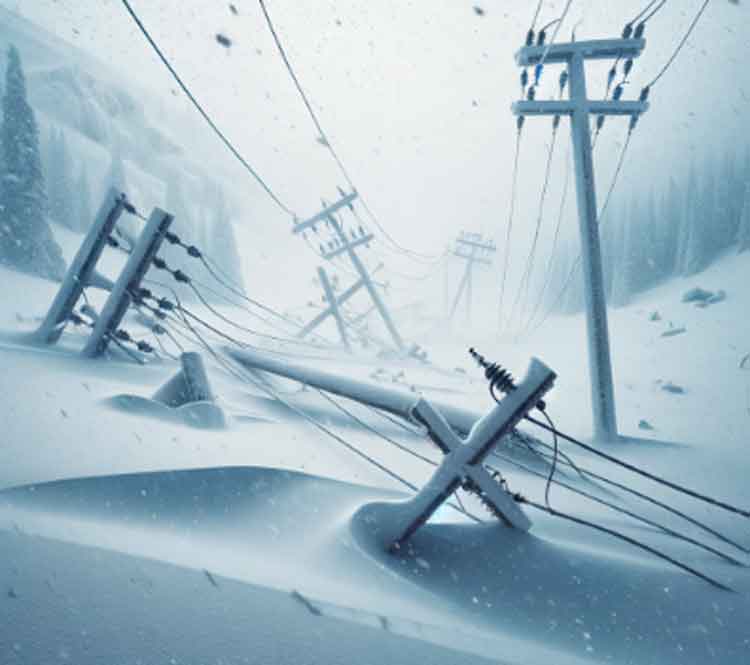
Nearly three years after the devastating Texas blackout of 2021, a panel of judges from the First Court of Appeals in Houston has determined that major power companies cannot be held accountable for their failure to deliver electricity during the power grid crisis that unfolded, citing Texas' deregulated energy market as the reason.
This ruling appears likely to shield these companies from lawsuits that were filed against them in the aftermath of the blackout, leaving the families of those affected uncertain about where to seek justice.
In February 2021, a severe cold front swept over Texas, bringing extended periods of ice and snow. The extreme weather conditions increased energy demand while simultaneously reducing supply by causing power generators and the state's natural gas supply chain to freeze. This led to a blackout that left millions of Texans without power and water for nearly a week.
The state officially reported that almost 250 people lost their lives during the winter storm and subsequent blackout, although some analysts argue that this is a significant undercount and warn of blackout risks across the U.S. during severe heat as well.
In the wake of the storm, Texans affected by the energy system's failure began filing lawsuits, and lawmakers proposed a market bailout as political debate intensified. Some of these legal actions were directed against power generators whose plants either ceased to function during the storm or ran out of fuel for electricity generation.
After several years of legal proceedings, a three-judge panel was convened to evaluate the merits of these lawsuits.
This week, Chief Justice Terry Adams issued a unanimous opinion on behalf of the panel, stating, "Texas does not currently recognize a legal duty owed by wholesale power generators to retail customers to provide continuous electricity to the electric grid, and ultimately to the retail customers."
The opinion further clarified that major power generators "are now statutorily precluded by the legislature from having any direct relationship with retail customers of electricity."
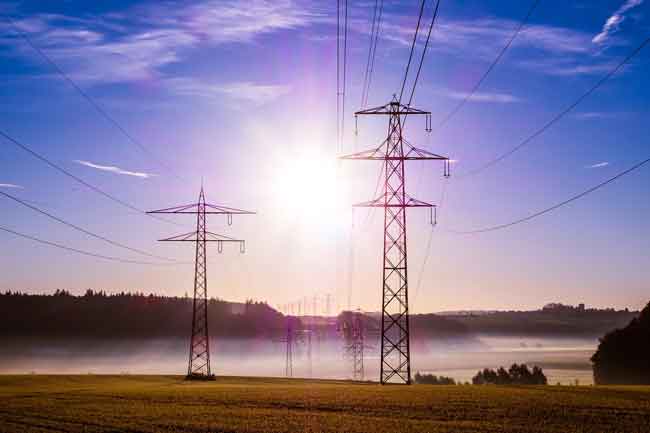
This separation of power generation from transmission and retail electric sales in many parts of Texas resulted from energy market deregulation in the early 2000s, with the goal of reducing energy costs, and prompted electricity market reforms aimed at avoiding future blackouts.
Under the previous system, power companies were "vertically integrated," controlling generators, transmission lines, and selling the energy they produced directly to regional customers. However, in deregulated areas of Texas, competition was introduced, creating competing energy-generating companies and retail electric providers that purchase power wholesale and then sell it to residential consumers; meanwhile, electric cooperatives in other parts of the state remained member-owned providers.
Tré Fischer, a partner at the Jackson Walker law firm representing the power companies, explained, "One consequence of that was, because of the unbundling and the separation, you also don't have the same duties and obligations [to consumers]. The structure just doesn't allow for that direct relationship and correspondingly a direct obligation to continually supply the electricity even if there's a natural disaster or catastrophic event."
In the opinion, Justice Adams noted that when designing the Texas energy market, amid renewed interest in ways to improve electricity reliability across the grid, state lawmakers "could have codified the retail customers' asserted duty of continuous electricity on the part of wholesale power generators into law."
The recent ruling applies to five representative cases chosen by the panel out of hundreds filed after the blackout. Due to this decision, it is improbable that any of the lawsuits against power companies will succeed, according to the court's interpretation.
However, plaintiffs' attorneys have indicated their intention to appeal. They may request a review of the panel's opinion by the entire First Court of Appeals or appeal directly to the state supreme court.
The state Supreme Court had previously ruled that the Electric Reliability Council of Texas (ERCOT), the state's power grid operator, enjoys sovereign immunity and cannot be sued over the blackout.
This latest opinion raises the question of who, if anyone, can be held responsible for deaths and losses resulting from the blackout, a question left unaddressed by the court. Fischer commented, "If anything [the judges] were saying that is a question for the Texas legislature."
Related News