Substation Relay Protection Training
Our customized live online or in‑person group training can be delivered to your staff at your location.

- Live Online
- 12 hours Instructor-led
- Group Training Available
Regular Price:
$699
Coupon Price:
$599
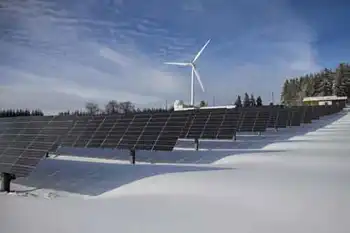
Duke Energy plans to build between 100 and 400 electricity-generating mini solar power plants throughout North Carolina over the next two years that will include panel installations at manufacturing facilities, the company said.
The North Carolina Utilities Commission has permitted Duke Energy to proceed with its $50 million proposal to install solar panels on the roofs and grounds of homes, schools, office buildings, shopping malls, warehouses and industrial plants, starting later this year.
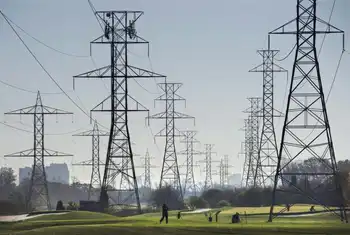
Collectively, the solar sites will generate enough electricity to power 1,300 homes, the company said. The electricity will flow directly from the solar sites to the electrical grid that serves all customers.
Duke Energy touts the solar initiative as one of the nation's first and largest demonstrations of distributed generation, in which electricity is produced at numerous micro generating sites rather than at a large, centralized, traditional power plant.
"We are redefining our boundaries. We're looking ahead and we're looking around the corner," CEO Jim Rogers told shareholders attending the company's annual meeting. "We believe the future is a low-carbon world. The 21st century mission of our company is to decarbonize our energy supply and provide universal access to energy efficiency."
Duke Energy will own and maintain the solar panels during their expected 25-year lifespan. The company also will own the electricity generated.
It will pay a rental fee to property owners who host the panels for use of their roofs or land, based on the size of the installation and amount of electricity generated at any given site.
Related News

Jordan approves MOU to implement Jordan-Saudi Arabia electricity linkage
Jordan-Saudi Electricity Linkage Project connects NEPCO and Saudi National Electricity Company to launch feasibility studies,…
View more
State-sponsored actors 'very likely' looking to attack electricity supply, says intelligence agency
Canada Critical Infrastructure Cyber Risks include state-sponsored actors probing the electricity grid and ICS/OT, ransomware…
View more
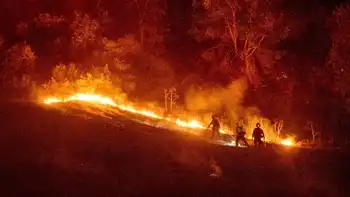
California Utility Cuts Power to Massive Areas in Northern, Central California
PG&E Public Safety Power Shutoff curbs wildfire risk amid high winds, triggering California outages across…
View more
B.C. Diverting Critical Minerals, Energy from U.S
Canadian Softwood Lumber Tariffs challenge British Columbia's forestry sector, strain U.S.-Canada trade, and risk redirecting…
View more

Investor: Hydro One has too many unknowns to be a good investment
Hydro One investment risk reflects Ontario government influence, board shakeup, Avista acquisition uncertainty, regulatory hearings,…
View more
British Columbia Accelerates Clean Energy Shift
BC Hydro Grid Modernization accelerates clean energy and electrification, upgrading transmission lines, substations, and hydro…
View more
Sign Up for Electricity Forum’s Newsletter
Stay informed with our FREE Newsletter — get the latest news, breakthrough technologies, and expert insights, delivered straight to your inbox.
Electricity Today T&D Magazine Subscribe for FREE

Stay informed with the latest T&D policies and technologies.
- Timely insights from industry experts
- Practical solutions T&D engineers
- Free access to every issue

