BC Hydro replacing thousands of aging power poles

By BC Hydro


High Voltage Maintenance Training Online

Our customized live online or in‑person group training can be delivered to your staff at your location.

  • Live Online
  • 12 hours Instructor-led
  • Group Training Available
Regular Price:
$599
Coupon Price:
$499
Reserve Your Seat Today
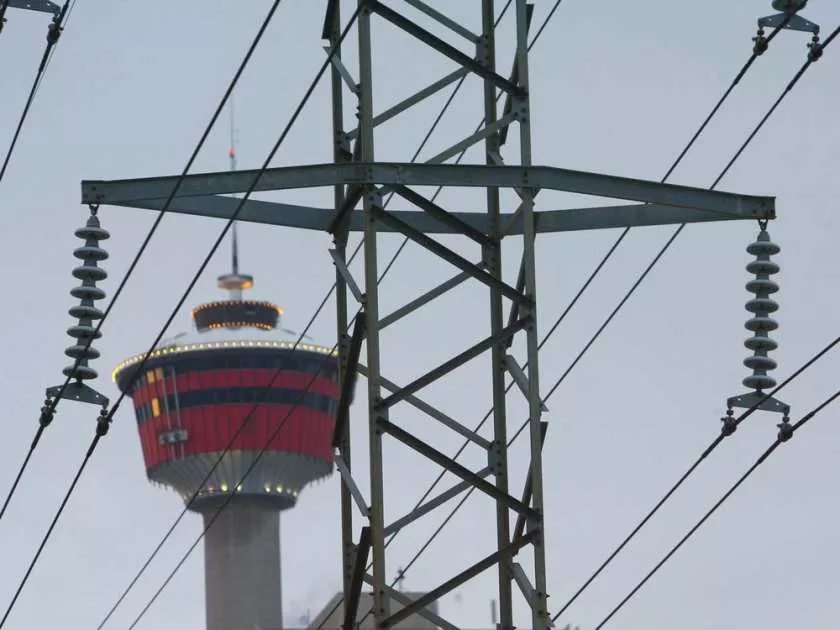
BC Hydro is advising residents in some of its service areas that crews will be replacing power poles in their regions over the next several months.

The work is part of BC HydroÂ’s ongoing maintenance program that will see the replacement of more than 10,000 utility poles this year throughout the province.

BC Hydro maintains 900,000 wooden poles as part of its electricity distribution system that delivers power to homes and businesses throughout the province.

More than 20 percent of BC HydroÂ’s wooden poles have been in service for more than 40 years. In total, BC HydroÂ’s system includes 56,000 kilometres of distribution lines.

Over time, wooden poles weaken due to adverse weather, insects, and wildlife. BC Hydro regularly inspects the old poles and puts in new poles for safety and to strengthen the reliability of the electricity system.

Pole replacement may require BC Hydro or its contractors to disconnect power. Crews take special care to avoid any unnecessary impacts to customers. However, if outages need to be scheduled for safety reasons, BC Hydro or its contractors will let customers know in person, or by mail or phone.

Related News

Here are 3 ways to find out where your electricity comes from

US energy mix shows how the electric grid blends renewables, fossil fuels, nuclear, and hydro, varying by ISO/RTO markets, utilities, and state policies, affecting carbon emissions, pricing, reliability, and access.


Key Points

The US energy mix is the grid's source breakdown by region: fossil fuels, renewables, nuclear, and hydro.

✅ Check ISO or RTO dashboards for real-time generation by fuel source.

✅ Utilities may offer green power plans or RECs at modest premiums.

✅ Energy mix shifts with policy, pricing, and grid reliability needs.


There are few resources more important than energy. Sure, you may die if you don't eat for days. But your phone will die if you go too long without charging it. Energy feeds tech, the internet, city infrastructure, refrigerators, lights, and has evolved throughout U.S. history in profound ways. You get the idea. Yet unlike our other common needs, such as food, energy sources aren't exactly front of mind for most people. 

"I think a lot of people don't put a lot of bandwidth into thinking about this part of their lives," said Richard McMahon, the SVP of energy supply and finance at Edison Electric Institute, a trade group that represents investor-owned electric companies in the US. 

It makes sense. For most Americans, electricity is always there, and in many locations, there's not much of a choice involved, even as electricity demand is flat across the U.S. today. You sign up with a utility when you move into a new residence and pay your bills when they're due. 

But there's an important reality that indifference eschews: In 2018, a third of the energy-related carbon-dioxide emissions in the US came from the electric power sector, according to the US Energy Information Administration (EIA). 

A good chunk of that is from the residential sector, which consistently uses more energy than commercial customers, per EIA data.

Just as many people exercise choice when they eat, you typically also have a choice when it comes to your energy supply. That's not to say your current offering isn't what you want, or that switching will be easy or affordable, but "if you're a customer and want power with a certain attribute," McMahon said, "you can pretty much get it wherever you are." 

But first, you need to know the energy mix you have right now. As it turns out, it's not so straightforward. At all.

This brief guide may help. 

For some utility providers, you can find out if it publishes the energy mix online. Dominion Energy, which serves Idaho, North Carolina, Ohio, South Carolina, Utah, Virginia, West Virginia, and Wyoming, provides this information in a colored graphic. 

"Once you figure out who your utility is you can figure out what mix of resources they use," said Heidi Ratz, an electricity markets researcher at the World Resources Institute.

But not all utilities publish this information.

It has to do with their role in the grid and reflects utility industry trends in structure and markets. Some utility companies are vertically integrated; they generate power through nuclear plants or wind farms and distribute those electrons directly to their customers. Other utilities just distribute the power that different companies produce. 

Consider Consolidated Edison, or Con Ed, which distributes energy to parts of New York City. While reporting this story, Business Insider could not find information about the utility's energy mix online. When reached for comment, a spokesperson said, "we're indifferent to where it comes from."

That's because, in New York, distribution utilities like Con Ed often buy energy through a wholesale marketplace.

Take a look at this map. If you live in one of the colored regions, your electricity is sold on a wholesale market regulated by an organization called a regional transmission organization (RTO) or independent system operator (ISO). Distribution utilities like Con Ed often buy their energy through these markets, based on availability and cost, while raising questions about future utility revenue models as prices shift. 

Still, it's pretty easy to figure out where your energy comes from. Just look up the ISO or RTO website (such as NYISO or CAISO). Usually, these organizations will provide energy supply information in near-real time. 

That's exactly what Con Edison (which buys energy on the NYISO marketplace) suggested. As of Friday morning, roughly 40% of the energy on the market place was natural gas or other fossil fuels, 34% was nuclear, and about 22% was hydro. 

If you live in another region governed by an ISO or RTO, such as in most of California, you can do the same thing. Like NYISO, CAISO has a dashboard that shows (again, as of Friday morning) about 36% of the energy on the market comes from natural gas and more than 20% comes from renewables. 

In the map linked above, you'll notice that some of the ISOs and RTOs like MISO encompass enormous regions. That means that even if you figure out where the energy in your market comes from, it's not going to be geographically specific. But there are a couple of ways to drill down even further. 

The Environmental Protection Agency has a straightforward tool called Power Profiler. You can enter your zip code to see the fuel mix in your area. But it's not perfect. The data are from 2016 and, in some regions of the country like the upper Midwest, they aren't much more localized, and some import dirty electricity due to regional trading. 

The World Resources Institute also has a tool that allows you to see the electricity mix by state, based on 2017 data from EIA. These numbers represent power generation, not the electricity actually flowing into your sockets, but they offer a rough idea of what energy resources are operating in your state. 

One option is to check with your utility to see if it has a "green power" offering. Over 600 utilities across the country have one, according to the Climate Reality Project, though they often come at a slightly higher cost. It's typically on the scale of just a few more cents per kilowatt-hour. 

There are also independent, consumer-facing companies like Arcadia and Green Mountain Energy that allow you to source renewable energy, by virtually connecting you to community solar projects or purchasing Renewable Energy Certificates, or RECs, on your behalf, as America goes electric and more options emerge. 

"RECs measure an investment in a clean energy resource," Ratz said, in an email. "The goal of putting that resource on the grid is to push out the need for dirtier resources."

The good news: Even if you do nothing, your energy mix will get cleaner. Coal production has fallen to lows not seen since the 1980s, amid disruptions in coal and nuclear sectors that affect reliability and costs, while renewable electricity generation has doubled since 2008. So whether you like it or not, you'll be roped into the clean energy boom one way or another. 


Related News

View more

Ontario Extends Off-Peak Electricity Rates to Provide Relief for Families, Small Businesses and Farms

Ontario Off-Peak Electricity Rate Relief extends 8.5 cents/kWh pricing 24/7 for residential, small business, and farm customers, covering Time-Of-Use and tiered plans to stabilize utility bills during COVID-19 Stay-at-Home measures across Ontario.


Key Points

A province-wide 8.5 cents/kWh price applied 24/7 until Feb 22, 2021 for TOU and tiered users to reduce electricity bills

✅ 8.5 cents/kWh, applied 24/7 through Feb 22, 2021

✅ Available to TOU and tiered OEB-regulated customers

✅ Automatic on bills for homes, small businesses, farms


The Ontario government is once again extending electricity rate relief for families, small businesses and farms to support those spending more time at home while the province maintains the Stay-at-Home Order in the majority of public health regions. The government will continue to hold electricity prices to the off-peak rate of 8.5 cents per kilowatt-hour, compared with higher peak rates elsewhere in the day, until February 22, 2021. This lower rate is available 24 hours per day, seven days a week for Time-Of-Use and tiered customers.

"We know staying at home means using more electricity during the day when electricity prices are higher, that's why we are once again extending the off-peak electricity rate to provide households, small businesses and farms with stable and predictable electricity bills when they need it most," said Greg Rickford, Minister of Energy, Northern Development and Mines, Minister of Indigenous Affairs. "We thank Ontarians for continuing to follow regional Stay-at-Home orders to help stop the spread of COVID-19."

The off-peak rate came into effect January 1, 2021, providing families, farms and small businesses with immediate electricity rate relief, and for industrial and commercial companies, stable pricing initiatives have provided additional certainty. The off-peak rate will now be extended until the end of day February 22, 2021, for a total of 53 days of emergency rate relief. During this period, and alongside temporary disconnect moratoriums for residential customers, the off-peak price will continue to be automatically applied to electricity bills of all residential, small business, and farm customers who pay regulated rates set by the Ontario Energy Board and get a bill from a utility.

"We extend our thanks to the Ontario Energy Board and local distribution companies across the province, including Hydro One, for implementing this extended emergency rate relief and supporting Ontarians as they continue to work and learn from home," said Bill Walker, Associate Minister of Energy.


Related News

View more

Wind Power Surges in U.S. Electricity Mix

U.S. Wind Power 2025 drives record capacity additions, with FERC data showing robust renewable energy growth, IRA incentives, onshore and offshore projects, utility-scale generation, grid integration, and manufacturing investment boosting clean electricity across key states.


Key Points

Overview of record wind additions, IRA incentives, and grid expansion defining the U.S. clean electricity mix in 2025.

✅ FERC: 30.1% of new U.S. capacity in Jan 2025 from wind

✅ Major projects: Cedar Springs IV, Boswell, Prosperity, Golden Hills

✅ IRA incentives drive onshore, offshore builds and manufacturing


In early 2025, wind power has significantly strengthened its position in the United States' electricity generation portfolio. According to data from the Federal Energy Regulatory Commission (FERC), wind energy accounted for 30.1% of the new electricity capacity added in January 2025, and as the most-used renewable source in the U.S., it also surpassed the previous record set in 2024. This growth is attributed to substantial projects such as the 390.4 MW Cedar Springs Wind IV and the 330.0 MW Boswell Wind Farm in Wyoming, along with the 300.0 MW Prosperity Wind Farm in Illinois and the 201.0 MW Golden Hills Wind Farm Expansion in Oregon. 

The expansion of wind energy capacity is part of a broader trend where solar and wind together accounted for over 98% of the new electricity generation capacity added in the U.S. in January 2025. This surge is further supported by the federal government's Inflation Reduction Act (IRA) and broader policy support for renewables, which has bolstered incentives for renewable energy projects, leading to increased investments and the establishment of new manufacturing facilities. 

By April 2025, clean electricity sources, including wind and solar, were projected to surpass 51% of total utility-scale electricity generation in the U.S., building on a 25.5% renewable share seen in recent data, marking a significant milestone in the nation's energy transition. This achievement is attributed to a combination of factors: a seasonal drop in electricity demand during the spring shoulder season, increased wind speeds in key areas like Texas, and higher solar production due to longer daylight hours and expanded capacity in states such as California, Arizona, and Nevada, supported by record installations across the solar and storage industry. 

Despite a 7% decline in wind power production in early April compared to the same period in 2024—primarily due to weaker wind speeds in regions like Texas—the overall contribution of wind energy remained robust, supported by an 82% clean-energy pipeline that includes wind, solar, and batteries. This resilience underscores the growing reliability of wind power as a cornerstone of the U.S. electricity mix. 

Looking ahead, the U.S. Department of Energy projects that wind energy capacity will continue to grow, with expectations of adding between 7.3 GW and 9.9 GW in 2024, and potentially increasing to 14.5 GW to 24.8 GW by 2028. This growth is anticipated to be driven by both onshore and offshore wind projects, with onshore wind representing the majority of new additions, continuing a trajectory since surpassing hydro capacity in 2016 in the U.S.

Early 2025 has witnessed a notable increase in wind power's share of the U.S. electricity generation mix. This trend reflects the nation's ongoing commitment to expanding renewable energy sources, especially after renewables surpassed coal in 2022, supported by favorable policies and technological advancements. As the U.S. continues to invest in and develop wind energy infrastructure, the role of wind power in achieving a cleaner and more sustainable energy future becomes increasingly pivotal.


Related News

View more

Marine Renewables Canada shifts focus towards offshore wind

Marine Renewables Canada Offshore Wind integrates marine renewables, tidal and wave energy, advancing clean electricity, low-carbon power, supply chain development, and regulatory alignment to scale offshore wind energy projects across Canada's coasts and global markets.


Key Points

An initiative to grow offshore wind using Canada's marine strengths, shared supply chains, and regulatory synergies.

✅ Leverages tidal and wave energy expertise for offshore wind

✅ Aligns supply chain, safety, and regulatory frameworks

✅ Supports low-carbon power and clean electricity goals


With a growing global effort to develop climate change solutions and increase renewable electricity production, including the UK offshore wind growth in recent years, along with Canada’s strengths in offshore and ocean sectors, Marine Renewables Canada has made a strategic decision to grow its focus by officially including offshore wind energy in its mandate.

Marine Renewables Canada plans to focus on similarities and synergies of the resources in order to advance the sector as a whole and ensure that clean electricity from waves, tides, rivers, and offshore wind plays a significant role in Canada’s low-carbon future.

“Many of our members working on tidal energy and wave energy projects also have expertise that can service offshore wind projects both domestically and internationally,” says Tim Brownlow, Chair of Marine Renewables Canada. “For us, offshore wind is a natural fit and our involvement will help ensure that Canadian companies and researchers are gaining knowledge and opportunities in the offshore wind sector as it grows.”

Canada has the longest coastlines in the world, giving it huge potential for offshore wind energy development. In addition to the resource, Canada has significant capabilities from offshore and marine industries that can contribute to offshore wind energy projects. The global offshore wind market is estimated to grow by over 650% by 2030 and presents new opportunities for Canadian business.

“The federal government’s recent inclusion of offshore renewables in legislation, including a plan for regulating offshore wind developed by the government, and support for emerging renewable energy technologies are important steps toward building this industry,” says Elisa Obermann, executive director of Marine Renewables Canada. “There are still challenges to address before we’ll see offshore wind energy development in Canada, but we see a great opportunity to get more involved now, increase our experience, and help inform future development.”

Like wave and tidal energy, offshore wind projects operate in harsh marine environments and development presents many of the same challenges and benefits as it does for other marine renewable energy resources. Marine Renewables Canada has recognized that there is significant overlap between offshore wind and wave and tidal energy when it comes to the supply chain, regulatory issues, and the operating environment. The association plans to focus on similarities and synergies of the resources in order to advance the sector as a whole, leveraging Canada’s opportunity in the global electricity market to ensure that clean electricity from waves, tides, rivers, and offshore wind plays a significant role in Canada’s low-carbon future.


Related News

View more

Global oil demand to decline in 2020 as Coronavirus weighs heavily on markets

COVID-19 Impact on Global Oil Demand 2020 signals an IEA forecast of declining consumption as travel restrictions curb transport fuels, disrupt energy markets, and shift OPEC and non-OPEC supply dynamics amid economic slowdown.


Key Points

IEA sees first demand drop since 2009 as COVID-19 curbs travel, weakening transport fuels and unsettling energy markets.

✅ IEA base case: 2020 demand at 99.9 mb/d, down 90 kb/d from 2019.

✅ Travel restrictions hit transport fuels; China drives the decline.

✅ Scenarios: low -730 kb/d; high +480 kb/d in 2020.


Global oil demand is expected to decline in 2020 as the impact of the new coronavirus (COVID-19) spreads around the world, constricting travel and broader economic activity, according to the International Energy Agency’s latest oil market forecast.

The situation remains fluid, creating an extraordinary degree of uncertainty over what the full global impact of the virus will be. In the IEA’s central base case, even as global CO2 emissions flatlined in 2019 according to the IEA, demand this year drops for the first time since 2009 because of the deep contraction in oil consumption in China, and major disruptions to global travel and trade.

“The coronavirus crisis is affecting a wide range of energy markets – including coal-fired electricity generation, gas and renewables – but its impact on oil markets is particularly severe because it is stopping people and goods from moving around, dealing a heavy blow to demand for transport fuels,” said Dr Fatih Birol, the IEA’s Executive Director. “This is especially true in China, the largest energy consumer in the world, which accounted for more than 80% of global oil demand growth last year. While the repercussions of the virus are spreading to other parts of the world, what happens in China will have major implications for global energy and oil markets.”

The IEA now sees global oil demand at 99.9 million barrels a day in 2020, down around 90,000 barrels a day from 2019. This is a sharp downgrade from the IEA’s forecast in February, which predicted global oil demand would grow by 825,000 barrels a day in 2020.

The short-term outlook for the oil market will ultimately depend on how quickly governments move to contain the coronavirus outbreak, how successful their efforts are, and what lingering impact the global health crisis has on economic activity.

To account for the extreme uncertainty facing energy markets, the IEA has developed two other scenarios for how global oil demand could evolve this year. In a more pessimistic low case, global measures fail to contain the virus, and global demand falls by 730,000 barrels a day in 2020. In a more optimistic high case, the virus is contained quickly around the world, and global demand grows by 480,000 barrels a day.

“We are following the situation extremely closely and will provide regular updates to our forecasts as the picture becomes clearer,” Dr Birol said. “The impact of the coronavirus on oil markets may be temporary. But the longer-term challenges facing the world’s suppliers are not going to go away, especially those heavily dependent on oil and gas revenues. As the IEA has repeatedly said, these producer countries need more dynamic and diversified economies in order to navigate the multiple uncertainties that we see today.”

The IEA also published its medium-term outlook examining the key issues in global demand, supply, refining and trade to 2025, as well as the trajectory of the global energy transition now shaping markets. Following a contraction in 2020 and an expected sharp rebound in 2021, yearly growth in global oil demand is set to slow as consumption of transport fuels grows more slowly and as national net-zero pathways, with Canada needing more electricity to reach net-zero influencing power demand, according to the report. Between 2019 and 2025, global oil demand is expected to grow at an average annual rate of just below 1 million barrels a day. Over the period as whole, demand rises by a total of 5.7 million barrels a day, with China and India accounting for about half of the growth.

At the same time, the world’s oil production capacity is expected to rise by 5.9 million barrels a day, with more than three-quarters of it coming from non-OPEC producers, the report forecasts. But production growth in the United States and other non-OPEC countries is set to lose momentum after 2022, amid shifts in Wall Street's energy strategy linked to policy signals, allowing OPEC producers from the Middle East to turn the taps back up to help keep the global oil market in balance.

The medium-term market report, Oil 2020, also considers the impact of clean energy transitions on oil market trends. Demand growth for gasoline and diesel between 2019 and 2025 is forecast to weaken as countries around the world implement policies to improve efficiency and cut carbon dioxide emissions – and as solar power becomes the cheapest electricity in many markets and electric vehicles increase in popularity. The impact of energy transitions on oil supply remains unclear, with many companies prioritising short-cycle projects for the coming years.

“The coronavirus crisis is adding to the uncertainties the global oil industry faces as it contemplates new investments and business strategies,” Dr Birol said. “The pressures on companies are changing, with European oil majors turning electric to diversify. They need to show that they can deliver not just the energy that economies rely on, but also the emissions reductions that the world needs to help tackle our climate challenge.”


Related News

View more

Nuclear Innovation Needed for American Energy, Environmental Future

Advanced Nuclear Technology drives decarbonization through innovation, SMRs, and a stable grid, bolstering U.S. leadership, energy security, and clean power exports under supportive regulation and policy to meet climate goals cost-effectively.


Key Points

Advanced nuclear technology uses SMRs to deliver low-carbon, reliable power and strengthen energy security.

✅ Accelerates decarbonization with firm, low-carbon baseload power

✅ Enhances grid reliability via SMRs and advanced fuel cycles

✅ Supports U.S. leadership through exports, R&D, and modern regulation


The most cost-effective way--indeed the only reasonable way-- to reduce greenhouse gas emissions and foster our national economic and security interests is through innovation, especially next-gen nuclear power innovation. That's from Rep. Greg Walden, R-Oregon, ranking Republican member of the House Energy and Commerce Committee, speaking to a Subcommittee on Energy hearing titled, "Building a 100 Percent Clean Economy: Advanced Nuclear Technology's Role in a Decarbonized Future."

Here are the balance of his remarks.

Encouraging the deployment of atomic energy technology, strengthening our nuclear industrial base, implementing policies that helps reassert U.S. nuclear leadership globally... all provide a promising path to meet both our environmental and energy security priorities. In fact, it's the only way to meet these priorities.

So today can help us focus on what is possible and what is necessary to build on recent policies we've enacted to ensure we have the right regulatory landscape, the right policies to strengthen our domestic civil industry, and the advanced nuclear reactors on the horizon.

U.S. global leadership here is sorely needed. Exporting clean power and clean power technologies will do more to drive down global Co2 emissions on the path to net-zero emissions worldwide than arbitrary caps that countries fail to meet.

In May last year, the International Energy Agency released an informative report on the role of nuclear power in clean energy systems; it did not find current trends encouraging.

The report noted that nuclear and hydropower "form the backbone of low-carbon electricity generation," responsible for three-quarters of global low-carbon generation and the reduction of over 60 gigatons of carbon dioxide emissions over the past 50 years.

Yet IEA found in advanced economies, nuclear power is in decline, with closing plants and little new investment, "just when the world requires more low-carbon electricity."

There are various reasons for this, some relating to cost overruns and delays, others to policies that fail to value the "low-carbon and energy security attributes" of nuclear. In any case, the report found this failure to encourage nuclear will undermine global efforts to develop cleaner electricity systems.

Germany demonstrates the problem. As it chose to shut down its nuclear industry, it has doubled down on expanding renewables like solar and wind. Ironically, to make this work, it also doubled down on coal. This nuclear phase out has cost Germany $12 billion a year, 70% of which is from increased mortality risk from stronger air pollutants (this according to the National Bureau of Economic Research). If other less technologically advanced nations even could match the rate of renewables growth reached by Germany, they would only hit about a fifth of what is necessary to reach climate goals--and with more expensive energy. So, would they then be forced to bring online even more coal-fired sources than Germany?

On the other hand, as outlined by the authors of the pro-nuclear book "A Bright Future," France and Sweden have both demonstrated in the 1970s and 1980s, how to do it. They showed that the build out of nuclear can be done at five times the rate of Germany's experience with renewables, with increased electricity production and relatively lower prices.

I think the answer is obvious about the importance of nuclear. The question will be "can the United States take the lead going forward?"

We can help to do this in Congress if we fully acknowledge what U.S. leadership on nuclear will mean--both for cleaner power and industrial systems beyond electricity, here and abroad--and for the ever-important national security attributes of a strong U.S. industry.

Witnesses have noted in recent hearings that recognizing how U.S. energy and climate policy effects energy and energy technology relationships world-wide is critical to addressing emissions where they are growing the fastest and for strengthening our national security relationships.

Resurrecting technological leadership in nuclear technology around the world will meet our broader national and energy security reasons--much as unleashing U.S. LNG from our shale revolution restored our ability to counter Russia in energy markets, while also driving cleaner technology. Our nuclear energy exports boost our national security priorities.

We on Energy and Commerce have been working, in a bipartisan manner over the past few Congresses to enhance U.S. nuclear policies. There is most certainly more to do. And I think today's hearing will help us explore what can be done, both administratively and legislatively, to pave the way for advanced nuclear energy.

Let me welcome the panel today. Which, I'm pleased to see, represents several important perspectives, including industry, regulatory, safety, and international expertise, to two innovative companies--Terrapower and my home state of Oregon's NuScale. All of these witnesses can speak to what we need to do to build, operate and lead with these new technologies.

We should work to get our nation's nuclear policy in order, learning from global frameworks like the green industrial revolution abroad. Today represents a good step in that effort.


Related News

View more

Sign Up for Electricity Forum’s Newsletter

Stay informed with our FREE Newsletter — get the latest news, breakthrough technologies, and expert insights, delivered straight to your inbox.

Electricity Today T&D Magazine Subscribe for FREE

Stay informed with the latest T&D policies and technologies.
  • Timely insights from industry experts
  • Practical solutions T&D engineers
  • Free access to every issue

Download the 2025 Electrical Training Catalog

Explore 50+ live, expert-led electrical training courses –

  • Interactive
  • Flexible
  • CEU-cerified