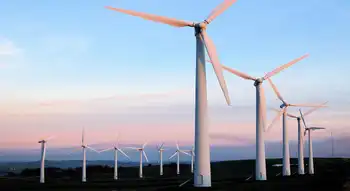
Oil billionaire delays wind farm plans

By Arizona Republic


CSA Z463 Electrical Maintenance

Our customized live online or in‑person group training can be delivered to your staff at your location.

  • Live Online
  • 6 hours Instructor-led
  • Group Training Available
Regular Price:
$249
Coupon Price:
$199
Reserve Your Seat Today
Billionaire T. Boone Pickens said that his Texas wind farm is on hold because natural-gas prices have dropped but that his plan for wind power and natural-gas vehicles is still viable to reduce foreign oil imports.

The Texas oil tycoon spoke to about 650 utility and investment officials gathered in Phoenix for the Edison Electric Institute Financial Conference.

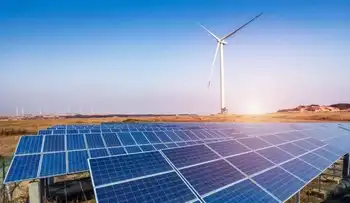
Pickens launched an advertising campaign last summer to promote wind farms to generate electricity and to use natural gas to power vehicles.

"I'm the only person in the United States that has a plan," he said. "Senator Obama and his people have been in touch with mine. They see the merits of what we are doing."

Pickens said the U.S. needs to exploit all its resources, from solar power in Arizona to coal and nuclear energy, but that few things could cut foreign oil imports quickly.

He said neither Obama's plans for 1 million plug-in hybrid vehicles nor John McCain's plans for 45 more nuclear plants would make a dent in oil imports, but semitrucks fueled by natural gas could reduce oil demand for the next 20 years before better transportation technology is available.

"It's a bridge to the next generation, which will probably be the battery, the fuel cell," he said. "It won't be the hydrocarbon."

But the current drop in oil and natural-gas prices is slowing things down.

Until natural-gas prices rise, Pickens said his wind farm and most others in the country will not go forward because electricity from gas plants will be more economical. Still, he was confident prices would rise.

He said Americans haven't understood the nation's energy challenges because prices have been low, until last summer when oil hit a record $147 a barrel.

"You haven't had the leadership in Washington to tell us what the problem was," he said. "The American people did not realize where we were. When oil went to $100, I had a story to tell."

Steven Dreyer, managing director at Standard and Poor's, credited Pickens for raising awareness.

"Arguably, for the first time, ordinary people were able to connect the dots between carbon reduction and energy," Dreyer said.

Ron Insana, managing director of SAC Capital Advisors and former CNBC commentator, questioned Pickens about how he will benefit financially by such a plan through his wind farm and large stake in Clean Energy Fuels Corp., a natural-gas, vehicle-fueling company.

Pickens described his potential to profit from wind and natural gas but said his motivations are patriotic.

"I'd rather be playing golf at the Del Mar Country Club this afternoon," Pickens said. "But I truly believe this is good for the country."

Pickens believes that global oil production has already "peaked" and that it will continue to become scarcer and more expensive, despite the current lull in gas prices.

He is founder and chairman of energy-investment company BP Capital and founded Mesa Petroleum, a natural-gas and oil producer. He is a geologist by training.

"When I launched my plan July 8, gas prices were $4.11 a gallon, and now they're half that. I think I've done a pretty good job," he said to chuckles from the audience.

He predicted oil, which closed November 11 at $59, to be $100 a barrel within a year, and could be $300 a barrel by 2018.

Pickens supports domestic drilling but said that can't come close to meeting daily U.S. oil demand.

Related News

BC Hydro: 2021 was a record-breaking year for electricity demand

BC Hydro 2021 Peak Load Records highlight record-breaking electricity demand, peak load spikes, heat dome impacts, extreme cold, and shifting work-from-home patterns managed by a flexible hydroelectric system and climate-driven load trends.


Key Points

Record-breaking electricity demand peaks from extreme heat and cold that reshaped daily load patterns across BC in 2021.

✅ Heat dome and deep freeze drove sustained peak electricity demand

✅ Peak load built gradually, reflecting work-from-home behavior

✅ Flexible hydroelectric system adapts quickly to demand spikes


From June’s heat dome to December’s extreme cold, 2021 was a record-setting year, according to BC Hydro, and similar spikes were noted as Calgary's electricity use surged in frigid weather.

On Friday, the energy company released a new report on electricity demand, and how extreme temperatures over extended periods of time, along with growing scrutiny of crypto mining electricity use, led to record peak loads.

“We use peak loads to describe the electricity demand in the province during the highest load hour of each day,” Kyle Donaldson, BC Hydro spokesperson, said in a media release.

“With the heat dome in the summer and the sustained cold temperatures in December, we saw more record-breaking hours on more days last year than any other single year.”

According to BC Hydro, during summer, the Crown corporation recorded 19 of its top 25 all-time summer daily peak records — including breaking its all-time summer peak hourly demand record.

In December, which saw extremely cold temperatures and heavy snowfall, BC Hydro said its system experienced the highest and longest sustained load levels ever, as it activated its winter payment plan to assist customers.

Overall, BC Hydro says it has experienced 11 of its top 25 all-time daily peak records this winter, adding that Dec. 27 broke its all-time high peak hourly demand record.

“BC Hydro’s hydroelectric system is directly impacted by variations in weather, including drought conditions that require adaptation, and in 2021 more electricity demand records were broken than any other year prior, largely because of the back-to-back extreme temperatures lasting for days and weeks on end,” reads the report.

The energy company expects this trend to continue, noting that it has broken the peak record five times in the past five years, and other jurisdictions such as Quebec consumption record have also shattered consumption records.

It also noted that peak demand patterns have also changed since the first year of the COVID-19 pandemic, with trends seen during Earth Hour usage offering context.

“When the previous peak hourly load record was broken in January 2020, load displayed sharper increases and decreases throughout the day, suggesting more typical weather and behaviour,” said the report.

“In contrast, the 2021 peak load built up more gradually throughout the day, suggesting more British Columbians were likely working from home, or home for the holidays – waking up later and home earlier in the evening – as well as colder weather than average.”

BC Hydro also said “current climate models suggest a warming trend continuing in years to come which could increase demand year-round,” but noted that its flexible hydroelectric system can meet changes in demand quickly.


Related News

View more

Heat Exacerbates Electricity Struggles for 13,000 Families in America

Energy Poverty in Extreme Heat exposes vulnerable households to heatwaves, utility shutoffs, and unreliable grid infrastructure, straining public health. Community nonprofits, cooling centers, and policy reform aim to improve electricity access, resilience, and affordable energy.


Key Points

Without reliable, affordable power in heatwaves, health risks rise and cooling, food storage, and daily needs suffer.

✅ Risks: heat illness, dehydration, and indoor temperatures above 90F

✅ Causes: utility shutoffs, aging grid, unpaid bills, remote areas

✅ Relief: cooling centers, aid programs, weatherization, bill credits


In a particular pocket of America, approximately 13,000 families endure the dual challenges of sweltering heat and living without electricity, and the broader risk of summer shut-offs highlights how widespread these pressures have become across the country. This article examines the factors contributing to their plight, the impact of living without electricity during hot weather, and efforts to alleviate these hardships.

Challenges Faced by Families

For these 13,000 families, daily life is significantly impacted by the absence of electricity, especially during the scorching summer months. Without access to cooling systems such as air conditioners or fans, residents are exposed to dangerously high temperatures, which can lead to heat-related illnesses and discomfort, particularly among vulnerable populations such as children, the elderly, and individuals with health conditions, where electricity's role in public health became especially evident.

Causes of Electricity Shortages

The reasons behind the electricity shortages vary. In some cases, it may be due to economic challenges that prevent families from paying utility bills, resulting in disconnections. Other factors include outdated or unreliable electrical infrastructure in underserved communities, as reflected in a recent grid vulnerability report that underscores systemic risks, where maintenance and upgrades are often insufficient to meet growing demand.

Impact of Extreme Heat

During heatwaves, the lack of electricity exacerbates health risks and quality of life issues for affected families, aligning with reports of more frequent outages across the U.S. Furthermore, the absence of refrigeration and cooking facilities can compromise food safety and nutritional intake, further impacting household well-being.

Community Support and Resilience

Despite these challenges, communities and organizations often rally to support families living without electricity. Local nonprofits, community centers, and government agencies provide assistance such as distributing fans, organizing cooling centers, and delivering essentials like bottled water and non-perishable food items during heatwaves to alleviate immediate hardships and improve summer blackout preparedness in vulnerable neighborhoods.

Long-term Solutions

Addressing electricity access issues requires comprehensive, long-term solutions. These may include policy reforms to ensure equitable access to affordable energy, investments in upgrading infrastructure in underserved areas, and expanding financial assistance programs to help families maintain uninterrupted electricity service, in recognition that climate change risks increasingly stress the grid.

Advocacy and Awareness

Advocacy efforts play a crucial role in raising awareness about the challenges faced by families living without electricity and advocating for sustainable solutions. By highlighting these issues, community leaders, activists, and policymakers can work together to drive policy changes, secure funding for infrastructure improvements, and promote energy efficiency initiatives, drawing lessons from Canada's harsh-weather grid exposures that illustrate regional vulnerabilities.

Building Resilience

Building resilience in vulnerable communities involves not only improving access to reliable electricity but also enhancing preparedness for extreme weather events. This includes developing emergency response plans, educating residents about heat safety measures, and fostering community partnerships to support those in need during crises.

Conclusion

As temperatures rise and climate impacts intensify, addressing the plight of families living without electricity becomes increasingly urgent. By prioritizing equitable access to energy, investing in resilient infrastructure, and fostering community resilience, stakeholders can work towards ensuring that all families have access to essential services, even during the hottest months of the year. Collaborative efforts between government, nonprofit organizations, and community members are essential in creating sustainable solutions that improve quality of life and promote health and well-being for all residents.


Related News

View more

Tracking Progress on 100% Clean Energy Targets

100% Clean Energy Targets drive renewable electricity, decarbonization, and cost savings through state policies, CCAs, RECs, and mandates, with timelines and interim goals that boost jobs, resilience, and public health across cities, counties, and utilities.


Key Points

Policies for cities and states to reach 100% clean power by set dates, using mandates, RECs, and interim goals.

✅ Define eligible clean vs renewable resources

✅ Mandate vs goal framework with enforcement

✅ Timelines with interim targets and escape clauses


“An enormous amount of authority still rests with the states for determining your energy future. So we can build these policies that will become a postcard from the future for the rest of the country,” said David Hochschild, chair of the California Energy Commission, speaking last week at a UCLA summit on state and local progress toward 100 percent clean energy.

According to a new report from the UCLA Luskin Center for Innovation, 13 states, districts and territories, as well as more than 200 cities and counties, with standout clean energy purchases by Southeast cities helping drive momentum, have committed to a 100 percent clean electricity target — and dozens of cities have already hit it.

This means that one of every three Americans, or roughly 111 million U.S. residents representing 34 percent of the population, live in a community that has committed to or has already achieved 100 percent clean electricity, including communities like Frisco, Colorado that have set ambitious targets.

“We’re going to look back on this moment as the moment when local action and state commitments began to push the entire nation toward this goal,” said J.R. DeShazo, director of the UCLA Luskin Center for Innovation.

Not all 100 percent targets are alike, however. The report notes that these targets vary based on 1) what resources are eligible, 2) how binding the 100 percent target is, and 3) how and when the target will be achieved.

These distinctions will carry a lot of weight as the policy discussion shifts from setting goals to actually meeting targets. They also have implications for communities in terms of health benefits, cost savings and employment opportunities.


100% targets come in different forms

One key attribute is whether a target is based on "renewable" or "clean" energy resources. Some 100 percent targets, like Hawaii’s and Rhode Island’s 2030 plan, are focused exclusively on renewable energy, or sources that cannot be depleted, such as wind, solar and geothermal. But most jurisdictions use the broader term “clean energy,” which can also include resources like large hydroelectric generation and nuclear power.

States also vary in their treatment of renewable energy certificates, used to track and assign ownership to renewable energy generation and use. Unbundled RECs allow for the environmental attributes of the renewable energy resource to be purchased separately from the physical electricity delivery.

The binding nature of these targets is also noteworthy. Seven states, as well as Puerto Rico and the District of Columbia, have passed 100 percent clean energy transition laws. Of the jurisdictions that have passed 100 percent legislation, all but one specifies that the target is a “mandate,” according to the report. Nevada is the only state to call the target a “goal.”

Governors in four other states have signed executive orders with 100 percent clean energy goals.

Target timelines also vary. Washington, D.C. has set the most ambitious target date, with a mandate to achieve 100 percent renewable electricity by 2032. Other states and cities have set deadline years between 2040 and 2050. All "100 percent" state laws, and some city and county policies, also include interim targets to keep clean energy deployment on track.

In addition, some locations have included some form of escape clause. For instance, Salt Lake City, which last month passed a resolution establishing a goal of powering the county with 100 percent clean electricity by 2030, included “exit strategies” in its policy in order to encourage stakeholder buy-in, said Mayor Jackie Biskupski, speaking last week at the UCLA summit.

“We don’t think they’ll get used, but they’re there,” she said.

Other locales, meanwhile, have decided to go well beyond 100 percent clean electricity. The State of California and 44 cities have set even more challenging targets to also transition their entire transportation, heating and cooling sectors to 100 percent clean energy sources, and proposals like requiring solar panels on new buildings underscore how policy can accelerate progress across sectors.

Businesses are simultaneously electing to adopt more clean and renewable energy. Six utilities across the United States have set their own 100 percent clean or carbon-free electricity targets. UCLA researchers did not include populations served by these utilities in their analysis of locations with state and city 100 percent clean commitments.


“We cannot wait”

All state and local policies that require a certain share of electricity to come from renewable energy resources have contributed to more efficient project development and financing mechanisms, which have supported continued technology cost declines and contributed to a near doubling of renewable energy generation since 2008.

Many communities are switching to clean energy in order to save money, now that the cost calculation is increasingly in favor of renewables over fossil fuels, as more jurisdictions get on the road to 100% renewables worldwide. Additional benefits include local job creation, cleaner air and electricity system resilience due to greater reliance on local energy resources.

Another major motivator is climate change. The electricity sector is responsible for 28 percent of U.S. greenhouse gas emissions, second only to transportation. Decarbonizing the grid also helps to clean up the transportation sector as more vehicles move to electricity as their fuel source.

“The now-constant threat of wildfires, droughts, severe storms and habitat loss driven by climate change signals a crisis we can no longer ignore,” said Carla Peterman, senior vice president of regulatory affairs at investor-owned utility Southern California Edison. “We cannot wait and we should not wait when there are viable solutions to pursue now.”

Prior to joining SCE on October 1, Peterman served as a member of the California Public Utilities Commission, which implements and administers renewable portfolio standard (RPS) compliance rules for California’s retail sellers of electricity. California’s target requires 60 percent of the state’s electricity to come from renewable energy resources by 2030, and all the state's electricity to come from carbon-free resources by 2045.  


How CCAs are driving renewable energy deployment

One way California communities are working to meet the state’s ambitious targets is through community-choice aggregation, especially after California's near-100% renewable milestone underscored what's possible, via which cities and counties can take control of their energy procurement decisions to suit their preferences. Investor-owned utilities no longer purchase energy for these jurisdictions, but they continue to operate the transmission and distribution grid for all electricity users.                           

A second paper released by the Luskin Center for Innovation in recent days examines how community-choice aggregators are affecting levels of renewable energy deployment in California and contributing to the state’s 100 percent target.

The paper finds that 19 CCAs have launched in California since 2010, growing to include more than 160 towns, cities and counties. Of those communities, 64 have a 100 percent renewable or clean energy policy as their default energy program.

Because of these policies, the UCLA paper finds that “CCAs have had both direct and indirect effects that have led to increases in the clean energy sold in excess of the state’s RPS.”

From 2011 to 2018, CCAs directly procured 24 terawatt-hours of RPS-eligible electricity, 11 TWh of which have been voluntary or in excess of RPS compliance, according to the paper.

The formation of CCAs has also had an indirect effect on investor-owned utilities. As customers have left investor-owned utilities to join CCAs, the utilities have been left holding contracts for more renewable energy than they need to comply with California’s clean energy targets, amid rising solar and wind curtailments that complicate procurement decisions. UCLA researchers estimate that this indirect effect of CCA formation has left IOUs holding 13 terawatt-hours in excess of RPS requirements.

The paper concludes that CCAs have helped to accelerate California’s ability to meet state renewable energy targets over the past decade. However, the future contributions of CCAs to the RPS are more uncertain as communities make new power-purchasing decisions and utilities seek to reduce their excess renewable energy contracts.

“CCAs offer a way for communities to put their desire for clean energy into action. They're growing fast in California, one of only eight states where this kind of mechanism is allowed," said UCLA's Kelly Trumbull, an author of the report. "State and federal policies could be reformed to better enable communities to meet local demand for renewable energy.”


Related News

View more

Electricity Demand In The Time Of COVID-19

COVID-19 Impact on U.S. Power Demand shows falling electricity load, lower wholesale prices, and resilient utilities in competitive markets, with regional differences tied to weather, renewable energy, stay-at-home orders, and hedging strategies.


Key Points

It outlines reduced load and prices, while regulatory design and hedging support utility stability across regions.

✅ Load down in NY, New England, PJM; weather drives South up.

✅ Wholesale prices fall 8-10% in key markets.

✅ Decoupling, contracts, hedging support utility earnings.


On March 27, Bloomberg New Energy Finance (BNEF) released a report on electricity demand and wholesale market prices impact from COVID-19 fallout. The model compares expected load based largely on weather with actual observed electricity demand changes.

So far, the hardest hit power grid is New York, with load down 7 and prices off by 10 percent. That’s expected, given New York City is the current epicenter of the US health crisis.

Next is New England, with 5 percent lower demand and 8 percent reduced wholesale prices for the week from March 19-25. BNEF says the numbers could go higher following advisories and orders issued March 24 for some 70 percent of the region’s population to stay at home.

Demand on the biggest grid in the US, the PJM (Pennsylvania/Jersey/Maryland), is 4 percent lower, with prices dropping 8 percent, as recent capacity auction payouts fell sharply. BNEF believes there will be more impact as stay at home orders are ramped up in several states.

California’s power demand for March 19-25 was 5 percent below what BNEF’s model expects without COVID-19 impact. That reflects a full week of stay-at-home orders from Governor Newsom issued March 19.

Health officials in Los Angeles and elsewhere expect a spike in COVID-19 cases in coming weeks. But BNEF’s model now actually projects rising electricity load for the state, due to what it calls "freakishly mild weather a year ago."

Rounding out the report, power demand is up for a band of southern states stretching from Florida to the desert Southwest, with weather more than offsetting public response to COVID-19 so far. BNEF says the Northwest’s grid "has not yet been highly impacted," while the Southeast is "generally in line" with pre-virus expectations.

Clearly, all of this data can change quickly and radically. Only California and New York are currently in full shutdown mode. Following them are New England (70 percent), the Midwest (65 percent), Texas (50 percent), PJM (50 percent) and the Northwest (50 percent).

In contrast, only small parts of Florida, the Southeast and Southwest are restricting movement. That could mean a big future increase for shut-ins, with heightened risks of electricity shut-offs that burden households and a corresponding impact on power demand.

Also, weather will play a major role on what happens to actual electricity demand, just as it always does. A very hot summer, for example, could offset virus-related shut-ins, just as it apparently is now in states like Texas. And it should be pointed out that regions vary widely by exposure to recession-sensitive sources of demand, such as heavy industry.

Most important for investors, however, is the built in protection US utility earnings enjoy from declining power demand, even amid broader energy crisis pressures facing the sector. For one thing, US power grids in California, ERCOT (Texas), MISO (Midwest), New England, New York and PJM have wholesale power markets, where producers compete for sales and the lowest bidder sets the price.

In those states, most regulated utilities don’t produce power at all. In fact, companies’ revenue is decoupled entirely from demand in California, as well as much of New England. In the roughly three-dozen states where utilities still operate as integrated monopolies, demand does affect revenue, and in many regions flat electricity demand already persists. But the cost of electricity is passed through directly to customers, whether produced or purchased.

A number of US electric companies have invested in renewable energy facilities as part of broader electrification trends nationwide. These sell their output under long-term contracts primarily with other utilities and government entities.

This isn’t a risk free business: For the past year, generators selling electricity to bankrupt PG&E Corp (PCG) have had their cash trapped at the power plant level as surety for lenders. But even PG&E has honored its contracts. And with states continuing aggressive mandates for renewable energy adoption, growth doesn’t appear at risk to COVID-19 fallout either.

The wholesale price of power from natural gas, coal and many nuclear plants was already sliding before COVID-19, due to renewables adoption and low natural gas prices, even as coal and nuclear disruptions raise reliability concerns. But here too, big producers like Exelon Corp (EXC) and Vistra Energy (VST) have employed aggressive price hedging near term, with regulated utilities and retail businesses protecting long-term health, respectively.

Bottom line: It’s early days for the COVID-19 crisis and much can still change. But so far at least, the US power industry is absorbing the blow of reduced demand, just as it’s done in previous crises.

That means future selloffs in the ongoing bear market are buying opportunities for best in class electric utilities, not a reason to sell. For top candidates, see the Conrad’s Utility Investor Portfolios and Dream Buy List in the March issue. 


Related News

View more

Hydro-Quebec adopts a corporate structure designed to optimize the energy transition

Hydro-Québec Unified Corporate Structure advances the energy transition through integrated planning, strategy, infrastructure delivery, and customer operations, aligning generation, transmission, and distribution while ensuring non-discriminatory grid access and agile governance across assets and behind-the-meter technologies.


Key Points

A cross-functional model aligning strategy, planning, and operations to accelerate Quebec's low-carbon transition.

✅ Four groups: strategy, planning, infrastructure, operations.

✅ Ensures non-discriminatory transmission access compliance.

✅ No staff reductions; staged implementation from Feb 28.


As Hydro-Que9bec prepares to play a key role in the transition to a low-carbon economy, the complexity of the work to be done in the coming decade requires that it develop a global vision of its operations and assets, from the drop of water entering its turbines to the behind-the-meter technologies marketed by its subsidiary Hilo. This has prompted the company to implement a new corporate structure that will maximize cooperation and agility, including employee-led pandemic support that builds community trust, making it possible to bring about the energy transition efficiently with a view to supporting the realization of Quebecers’ collective aspirations.

Toward a single, unified Hydro

Hydro-Québec’s core mission revolves around four major functions that make up the company’s value chain, alongside policy choices like peak-rate relief during emergencies. These functions consist of:

  1. Developing corporate strategies based on current and future challenges and business opportunities
  2. Planning energy needs and effectively allocating financial capital, factoring in pandemic-related revenue impacts on demand and investment timing
  3. Designing and building the energy system’s multiple components
  4. Operating assets in an integrated fashion and providing the best customer experience by addressing customer choice and flexibility expectations across segments.

Accordingly, Hydro-Québec will henceforth comprise four groups respectively in charge of strategy and development; integrated energy needs planning; infrastructure and the energy system; and operations and customer experience, including billing accuracy concerns that can influence satisfaction. To enable the company to carry out its mission, these groups will be able to count on the support of other groups responsible for corporate functions.

Across Canada, leadership changes at other utilities highlight the need to rebuild ties with governments and investors, as seen with Hydro One's new CEO in Ontario.

“For over 20 years, Hydro-Québec has been operating in a vertical structure based on its main activities, namely power generation, transmission and distribution. This approach must now give way to one that provides a cross-functional perspective allowing us to take informed decisions in light of all our needs, as well as those of our customers and the society we have the privilege to serve,” explained Hydro-Québec’s President and Chief Executive Officer, Sophie Brochu.

In terms of gender parity, the management team continues to include several men and women, thus ensuring a diversity of viewpoints.

Hydro-Québec’s new structure complies with the regulatory requirements of the North American power markets, in particular with regard to the need to provide third parties with non-discriminatory access to the company’s transmission system. The frameworks in place ensure that certain functions remain separate and help coordinate responses to operational events such as urban distribution outages that challenge continuity of service.

These changes, which will be implemented gradually as of Monday, February 28, do not aim to achieve any staff reductions.


Related News

View more

EIA: Pennsylvania exports the most electricity, California imports the most from other states

U.S. Electricity Trade by State, 2013-2017 highlights EIA grid patterns, interstate imports and exports, cross-border flows with Canada and Mexico, net exporters and importers, and market regions like ISOs and RTOs shaping consumption and generation.


Key Points

Brief EIA overview of interstate and cross-border power flows, ranking top net importers and exporters.

✅ Pennsylvania was the largest net exporter, averaging 59 million MWh.

✅ California was the largest net importer, averaging 77 million MWh.

✅ Top cross-border: NY, CA, VT, MN, MI imports; WA, TX, CA, NY, MT exports.


According to the U.S. Energy Information Administration (EIA) State Electricity Profiles, from 2013 to 2017, Pennsylvania was the largest net exporter of electricity, while California was the largest net importer.

Pennsylvania exported an annual average of 59 million megawatt-hours (MWh), while California imported an average of 77 million MWh annually.

Based on the share of total consumption in each state, the District of Columbia, Maryland, Massachusetts, Idaho and Delaware were the five largest power-importing states between 2013 and 2017, highlighting how some clean states import 'dirty' electricity as consumption outpaces local generation. Wyoming, West Virginia, North Dakota, Montana and New Hampshire were the five largest power-exporting states. Wyoming and West Virginia were net power exporting states between 2013 and 2017.

New York, California, Vermont, Minnesota and Michigan imported the most electricity from Canada or Mexico on average from 2013 to 2017, reflecting the U.S. look to Canada for green power during that period. Similarly, Washington, Texas, California, New York, and Montana exported the most electricity to Canada or Mexico, on average, during the same period.

Electricity routinely flows among the Lower 48 states and, to a lesser extent, between the United States and Canada and Mexico. From 2013 to 2017, Pennsylvania was the largest net exporter of electricity, sending an annual average of 59 million megawatthours (MWh) outside the state. California was the largest net importer, receiving an average of 77 million MWh annually.

Based on the share of total consumption within each state, the District of Columbia, Maryland, Massachusetts, Idaho, and Delaware were the five largest power-importing states between 2013 and 2017. Wyoming, West Virginia, North Dakota, Montana, and New Hampshire were the five largest power-exporting states. States with major population centers and relatively less generating capacity within their state boundaries tend to have higher ratios of net electricity imports to total electricity consumption, as utilities devote more to electricity delivery than to power production in many markets.

Wyoming and West Virginia were net power exporting states (they exported more power to other states than they consumed) between 2013 and 2017. Customers residing in these two states are not necessarily at an economic disadvantage or advantage compared with customers in neighboring states when considering their electricity bills and fees and market dynamics. However, large amounts of power trading may affect a state’s revenue derived from power generation.

Some states also import and export electricity outside the United States to Canada or Mexico, even as Canada's electricity exports face trade tensions today. New York, California, Vermont, Minnesota, and Michigan are the five states that imported the most electricity from Canada or Mexico on average from 2013 through 2017. Similarly, Washington, Texas (where electricity production and consumption lead the nation), California, New York, and Montana are the five states that exported the most electricity to Canada or Mexico, on average, for the same period.

Many states within the continental United States fall within integrated market regions, referred to as independent system operators or regional transmission organizations. These integrated market regions allow electricity to flow freely between states or parts of states within their boundaries.

EIA’s State Electricity Profiles provide details about the supply and disposition of electricity for each state, including net trade with other states and international imports and exports, and help you understand where your electricity comes from more clearly.


Related News

View more

Sign Up for Electricity Forum’s Newsletter

Stay informed with our FREE Newsletter — get the latest news, breakthrough technologies, and expert insights, delivered straight to your inbox.

Electricity Today T&D Magazine Subscribe for FREE

Stay informed with the latest T&D policies and technologies.
  • Timely insights from industry experts
  • Practical solutions T&D engineers
  • Free access to every issue

Download the 2025 Electrical Training Catalog

Explore 50+ live, expert-led electrical training courses –

  • Interactive
  • Flexible
  • CEU-cerified