Iraq Electricity Crisis intensifies as summer heat drives demand; households face power outages, reliance on private generators, distorted tariffs, and strained grid capacity despite government reforms, Siemens upgrades, and IEA warnings.
Key Points
A supply-demand gap causing outages, generator reliance, and grid inefficiencies across Iraq, worsened by summer peaks.
✅ Siemens deal to upgrade generation and grid
✅ Progressive tariffs to curb demand and waste
✅ Private generators fill gaps but raise costs
At a demonstration in June 2018, protesters in Basra loaded a black box resembling a coffin with the inscription “Electricity” onto the roof of a car. This was one demonstration of how much of a political issue electricity is in Iraq.
With what is likely to be another hot summer ahead, there is increasing pressure on the Baghdad government to improve access to electricity and water.
Many Iraqis blame the government for not providing adequate services despite the country’s oil wealth. Protests in southern Iraq last year turned violent, with demonstrators attacking governmental and political parties’ buildings; in neighboring Iran, blackouts also sparked protests over outages.
“It is very hard” to deal with the electricity issues, said Iraqi journalist Methaq al-Fayyadh, adding that the lack of reliable electricity was not a new problem and affects most parts of the country.
Dozens of people protested June 1 in Karbala against prices for new generators and demanded an improvement to the electricity situation.
In anticipation of high temperatures during Eid al-Fitr, the Electricity Ministry called on governorates to adhere to allocated quotas and told the public to ration electricity.
“Outages remain a daily occurrence for most households because increasing generating capacity has been outrun by increasing demand for electricity, as surging demand worldwide demonstrates,” noted the International Energy Agency (IAE) in April.
This is particularly the case, the authors said, as the hot summer months, when temperatures can top 50 degrees Celsius, drive up the use of air conditioning.
The Iraqi government has made improving the electricity supply one of its priorities, including nuclear power plans under consideration. The Electricity Ministry, headed by Luay al-Khatteeb, announced in May that national electricity production had reached 17 gigawatts.
Khatteeb presented comparative electricity data for May from 2018 and 2019, indicating production increases on every day of the month. IEA data indicate that available electricity supply has increased over the past five years and the gap between supply and demand has widened.
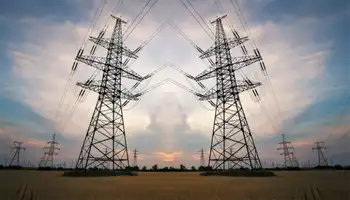
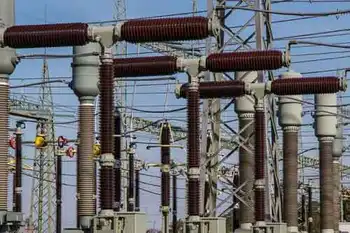
The government signed an agreement with German company Siemens this year to upgrade Iraq’s electricity grid, and in parallel deals with Iran to rehabilitate and develop the grid were finalized, according to Iranian officials. The agreement “includes the addition of new and highly efficient power generation capacity, rehabilitation and upgrade of existing plants and the expansion of transmission and distribution networks,” Siemens said.
The Iraqi prime minister’s office said the 4-year plan would be worth $15.7 billion. The first phase includes the installation of 13 transformer stations, cooling systems for power stations and building a 500-megawatt, gas-fired power plant south of Baghdad.
In an interview with Al-Monitor, Khatteeb said radical changes would happen in 2020, stating that the current situation was not “ideal” but “better” because of steps taken to create more energy, amid discussions on energy cooperation with Iran that could shape implementation.
Robert Tollast, of the Iraq Energy Institute, said the economics of the electricity system is distorted. Subsidies ensured that electricity provided by the national grid is almost free, he said. However, while the subsidies were designed to help the poor, the tariff system disadvantages them and does not create incentives to consume electricity more efficiently, he said.
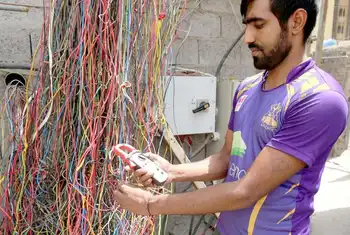
A large part of families’ electricity expenditures goes to operators of privately owned generators, which run on fuel. These neighbourhood generators are used to close gaps in the electricity supply but are expensive, and regional fuel arrangements such as ENOC’s swap of Iraqi fuel have highlighted supply constraints. Generator operators have sometimes worked with armed groups to prevent upgrades to the grid that could hurt their business.
Until 1990, the Iraq electricity sector was considered among the best in the region. That legacy was destroyed by successive wars and international sanctions. With Iraq’s population growing at a rate of 1 million per year, peak demand is projected to double by 2030 if left unchecked, the IEA estimated.
Tollast said efforts to improve the distribution system and increase capacity are key but it is important “to tackle the problem from the demand side.” This entails implementing a progressive tariff scheme so users pay more if they consume more, he said. There is a “tremendous use of energy per capita in Iraq,” Tollast said.
In the current tariff structure, consumers pay a fixed price if they use more than 4,000-kilowatt hours per year, a relatively low amount, meaning the price per unit drops the more one consumes.
Any change to the tariff system must be accompanied by a “political campaign” to explain the changes, said Tollast, adding that more investment in the electricity sector and a “change in culture” of using electricity was needed. “The current system is unsustainable, even with high oil prices,” he said.
Fayyadh said people don’t expect the government will be able to fix the electricity issue before summer, having failed to do so in the past.
Tollast struck a more optimistic tone, saying it was unlikely that Iran, which supplies about 40% of Iraq’s power, would cut its export of electricity to Iraq this year as it did in 2018. He added that the water situation was better than last year when the country experienced drought. Iraq has also been processing more flare gas, which can be used to generate electricity.
“There is an expectation that this year might not be as bad as last year,” he concluded.
Related News