Coal profits mask lack of U.S. economic activity

By Associated Press


Arc Flash Training CSA Z462 - Electrical Safety Essentials

Our customized live online or in‑person group training can be delivered to your staff at your location.

  • Live Online
  • 6 hours Instructor-led
  • Group Training Available
Regular Price:
$249
Coupon Price:
$199
Reserve Your Seat Today
Coal mining companies from Appalachia to Missouri are seeing plenty of rebounding demand, just not here at home.

Fresh from reporting third-quarter earnings, coal producers say booming Asian economies are increasingly hungry for energy even as the hardest-hit mining regions in the U.S. see little prospect for a comeback in coming months.

Big coal producers such as St. Louis-based Peabody Energy and Arch Coal say the rising demand for metallurgical coal, a key ingredient in steelmaking, is largely a foreign phenomenon.

The top U.S. producer of metallurgical coal, Alpha Natural Resources, said it's planning to up production 1 million tons next year to take advantage and CEO Kevin Crutchfield said orders are starting to come in from Eastern and Western Europe.

America, on the other hand, remains in the doldrums.

"Nobody is seeing any effect of the stimulus in the U.S.," said steel industry analyst Charles Bradford of Affiliated Research Group. "There is recovery in world steel output."

That's not much help for domestic mines or U.S. mineworkers. Metallurgical coal commands premium prices, but accounts for a relative sliver of U.S. production. The bulk of U.S. coal goes to electric power plants and they're not interested in buying these days.

There have been massive piles of unused coal outside of U.S. plants, a symptom of a country that is in a deep industrial funk.

As of August, electric plant stockpiles were up nearly 40 percent from the previous year, according to U.S. Department of Energy.

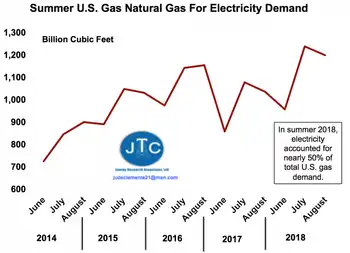
The recession, a very cool summer and cheap natural gas has slashed the amount of coal that power can use.

Producers have now idled enough U.S. mines to trim approximately 100 million tons of coal — roughly 9 percent — from production this year. Hundreds of miners in West Virginia, Kentucky and other key coal states have lost their jobs.

The cuts are continuing.

International Coal Group shuttered a West Virginia mine employing about 70 people in late September after electric utility Allegheny Energy stopped taking shipments.

Alpha trimmed another 1 million tons from its production guidance for mines in Wyoming's Powder River Basin.

Most U.S. producers believe things will not improve before next year, including Crutchfield. He suggested the market might begin to turn closer to 2011.

The problems at home only highlight the sharp rebound in Asia.

A half dozen U.S. producers including Peabody, Consol Energy, ICG, Alpha and Arch Coal reported stronger than expected third-quarter financial results on the strength of sales in China, in addition to high-priced contracts signed in 2008 and lower costs.

For the foreseeable future, the action is in China, where steel plants are operating at better than 90 percent capacity.

Peabody Energy quickly boosted activity in Australia because it is close to China, even opening a trading hub in Singapore during the third quarter.

Related News

Clean energy jobs energize Pennsylvania: Clean Energy Employment Report

Pennsylvania Clean Energy Employment surges, highlighting workforce growth in energy efficiency, solar, wind, grid and storage, and alternative transportation, supporting COVID-19 recovery, high-wage jobs, manufacturing, construction, and statewide economic resilience.


Key Points

Jobs across clean power, efficiency, grid, storage, and advanced transport fueling Pennsylvania's workforce growth.

✅ 8.7% job growth from 2017-2019, outpacing statewide average

✅ 97,000+ employed across efficiency, solar, wind, grid, and fuels

✅ 75% earn above median; strong full-time opportunities


The 2020 Pennsylvania Clean Energy Employment Report has been released, and Gov. Tom Wolf is energized by it.

This "comes at an opportune time, as government and industry leaders look to strengthen Pennsylvania's workforce and economy in response to the challenges of the COVID-19 pandemic," Wolf said Monday in a prepared statement. "This detailed analysis of data and trends in clean energy employment ... demonstrates the sector was a top job generator statewide, and shows which industries were hiring and looking for trained workers."

Foremost among the findings, released Monday, is that the clean energy sector was responsible for adding 7,794 jobs from 2017 through 2019. That is an 8.7% average job growth rate, well above the 1.9% overall average in the state, according to a news release from Wolf's office.

This report lists employment data in five industries: energy efficiency; clean energy generation; alternative transportation; clean grid and storage; and clean fuels, while some cleaner states still import dirty electricity in regional markets.

The energy efficiency industry was the biggest clean energy employer in the state last year, with more than 71,400 state residents working in construction, technology and manufacturing jobs related to energy-efficient systems.

Solar energy workers comprised the largest share of the clean energy generation workforce – 35.4%, or 5,173 individuals. Solar employment increased 8.3% from 2017 to 2019, while there was a slight decline nationwide amid clean energy job losses reported in May.

Wind energy firms employed 2,937, and policy moves such as Ontario's clean electricity regulations signal broader market shifts, with more than 21% of those roles in manufacturing.

Job losses, though, were recorded in nuclear generation (minus 4.5%) and coal generation (minus 8.6%) over the two-year period, as electricity deregulation remains a point of debate in the sector. This mirrors national declines in both categories.

Federal efforts to support coal community revitalization are channeling clean energy projects to hard-hit regions.

Natural gas electric generation capacity doubled across Pennsylvania over the past decade; even as residents could face winter electricity price increases according to recent reports, employment still grew 13.4% from 2017 through 2019. But increasing output from unconventional wells has outpaced demand, sparking reductions in siting and drilling for new wells.

The Clean Energy Employment Report was released along with – and as part of – the 2020 Pennsylvania Energy Employment Report, which asserts that energy remains a large employer in the state, and new clean energy funding announcements underscore the sector's momentum. As of the last quarter of 2019, according to the larger report, energy accounted for 269,031 jobs, or 4.5% of the overall statewide workforce.

Wolf, in summary, said: "This report shows that workforce training investment decisions can benefit Pennsylvanians right now and position the state going forward to grow and improve livelihoods, the economy and our environment."


Related News

View more

The Netherlands Outpaces Canada in Solar Power Generation

Netherlands vs Canada Solar Power compares per capita capacity, renewable energy policies, photovoltaics adoption, rooftop installations, grid integration, and incentives like feed-in tariffs and BIPV, highlighting efficiency, costs, and public engagement.


Key Points

Concise comparison of per capita capacity, policies, technology, and engagement in Dutch and Canadian solar adoption.

✅ Dutch per capita PV capacity exceeds Canada's by wide margin.

✅ Strong incentives: net metering, feed-in tariffs, rooftop focus.

✅ Climate, grid density, and awareness drive higher yields.


When it comes to harnessing solar power, the Netherlands stands as a shining example of efficient and widespread adoption, far surpassing Canada in solar energy generation per capita. Despite Canada's vast landmass and abundance of sunlight, the Netherlands has managed to outpace its North American counterpart, which some experts call a solar power laggard in solar energy production. This article explores the factors behind the Netherlands' success in solar power generation and compares it to Canada's approach.

Solar Power Capacity and Policy Support

The Netherlands has rapidly expanded its solar power capacity in recent years, driven by a combination of favorable policies, technological advancements, and public support. According to recent data, the Netherlands boasts a significantly higher per capita solar power capacity compared to Canada, where demand for solar electricity lags relative to deployment in many regions, leveraging its smaller geographical size and dense population centers to maximize solar panel installations on rooftops and in urban areas.

In contrast, Canada's solar energy development has been slower, despite having vast areas of suitable land for solar farms. Challenges such as regulatory hurdles, varying provincial policies, and the high initial costs of solar installations have contributed to a more gradual adoption of solar power across the country. However, provinces like Ontario have seen significant growth in solar installations due to supportive government incentives and favorable feed-in tariff programs, though growth projections were scaled back after Ontario scrapped a key program.

Innovation and Technological Advancements

The Netherlands has also benefited from ongoing innovations in solar technology and efficiency improvements. Dutch companies and research institutions have been at the forefront of developing new solar panel technologies, improving efficiency rates, and exploring innovative applications such as building-integrated photovoltaics (BIPV). These advancements have helped drive down the cost of solar energy and increase its competitiveness with traditional fossil fuels.

In contrast, while Canada has made strides in solar technology research and development, commercialization and widespread adoption have been more restrained due to factors like market fragmentation and the country's reliance on other energy sources such as hydroelectricity.

Public Awareness and Community Engagement

Public awareness and community engagement play a crucial role in the Netherlands' success in solar power adoption. The Dutch government has actively promoted renewable energy through public campaigns, educational programs, and financial incentives for homeowners and businesses to install solar panels. This proactive approach has fostered a culture of energy conservation and sustainability among the Dutch population.

In Canada, while there is growing public support for renewable energy, varying levels of awareness and engagement across different provinces have impacted the pace of solar energy adoption. Provinces like British Columbia and Alberta have seen increasing interest in solar power, driven by environmental concerns, technological advancements, and economic benefits, as the country is set to hit 5 GW of installed capacity in the near term.

Climate and Geographic Considerations

Climate and geographic considerations also influence the disparity in solar power generation between the Netherlands and Canada. The Netherlands, despite its northern latitude, benefits from relatively mild winters and a higher average annual sunlight exposure compared to most regions of Canada. This favorable climate has facilitated higher solar energy yields and made solar power a more viable option for electricity generation.

In contrast, Canada's diverse climate and geography present unique challenges for solar energy deployment. Northern regions experience extended periods of darkness during winter months, limiting the effectiveness of solar panels in those areas. Despite these challenges, advancements in energy storage technologies and hybrid solar-diesel systems are making solar power increasingly feasible in remote and off-grid communities across Canada, even as Alberta faces expansion challenges related to grid integration and policy.

Future Prospects and Challenges

Looking ahead, both the Netherlands and Canada face opportunities and challenges in expanding their respective solar power capacities. In the Netherlands, continued investments in solar technology, grid infrastructure upgrades, and policy support will be crucial for maintaining momentum in renewable energy development.

In Canada, enhancing regulatory consistency, scaling up solar installations in urban and rural areas, and leveraging emerging technologies will be essential for narrowing the gap with global leaders in solar energy generation and for seizing opportunities in the global electricity market as the energy transition accelerates.

In conclusion, while the Netherlands currently generates more solar power per capita than Canada, with the Prairie Provinces poised to lead growth in the Canadian market, both countries have unique strengths and challenges in their pursuit of a sustainable energy future. By learning from each other's successes and leveraging technological advancements, both nations can further accelerate the adoption of solar power and contribute to global efforts to combat climate change.


Related News

View more

Nonstop Records For U.S. Natural-Gas-Based Electricity

U.S. Natural Gas Power Demand is surging for electricity generation amid summer heat, with ERCOT, Texas grid reserves tight, EIA reporting coal and nuclear retirements, renewables intermittency, and pipeline expansions supporting combined-cycle capacity and prices.


Key Points

It is rising use of natural gas for power, driven by summer heat, plant retirements, and new combined-cycle capacity.

✅ ERCOT reserve margin 9%, below 14% target in Texas

✅ Gas share of U.S. power near 40-43% this summer

✅ Coal and nuclear retirements shift capacity to combined cycle


As the hot months linger, it will be natural gas that is leaned on most to supply the electricity that we need to run our air conditioning loads on the grid and keep us cool.

And this is surely a great and important thing: "Heat causes most weather-related deaths, National Weather Service says."

Generally, U.S. gas demand for power in summer is 35-40% higher than what it was five years ago, with so much more coming (see Figure).

The good news is regions across the country are expected to have plenty of reserves to keep up with power demand.

The only exception is ERCOT, covering 90% of the electric load in Texas, where a 9% reserve margin is expected, below the desired 14%.

Last summer, however, ERCOT’s reserve margin also was below the desired level, yet the grid operator maintained system reliability with no load curtailments.

Simply put, other states are very lucky that Texas has been able to maintain gas at 50% of its generation, despite being more than justified to drastically increase that.

At about 1,600 Bcf per year, the flatness of gas for power demand in Texas since 2000 has been truly remarkable, especially since Lone Star State production is up 50% since then.

Increasingly, other U.S. states (and even countries) are wanting to import huge amounts of gas from Texas, a state that yields over 25% of all U.S. output.

Yet if Texas justifiably ever wants to utilize more of its own gas, others would be significantly impacted.

At ~480 TWh per year, if Texas was a country, it would be 9th globally for power use, even ahead of Brazil, a fast growing economy with 212 million people, and France, a developed economy with 68 million people.

In the near-term, this explains why a sweltering prolonged heat wave in July in Texas, with a hot Houston summer setting new electricity records, is the critical factor that could push up still very low gas prices.

But for California, our second highest gas using state, above-average snowpack should provide a stronger hydropower for this summer season relative to 2018.

Combined, Texas and California consume about 25% of U.S. gas, with Texas' use double that of California.


Across the U.S., gas could supply a record 40-43% of U.S. electricity this summer even as the EIA expects solar and wind to be larger sources of generation across the mix

Our gas used for power has increased 35-40% over the past five years, and January power generation also jumped on the year, highlighting broad momentum.

Our gas used for power has increased 35-40% over the past five years. DATA SOURCE: EIA; JTC

Indeed, U.S. natural gas for electricity has continued to soar, even as overall electricity consumption has trended lower in some years, at nearly 10,700 Bcf last year, a 16% rise from 2017 and easily the highest ever.

Gas is expected to supply 37% of U.S. power this year, even as coal-fired generation saw a brief uptick in 2021 in EIA data, versus 27% just five years ago (see Figure).

Capacity wise, gas is sure to continue to surge its share 45% share of the U.S. power system.

"More than 60% of electric generating capacity installed in 2018 was fueled by natural gas."

We know that natural gas will continue to be the go-to power source: coal and nuclear plants are retiring, and while growing, wind and solar are too intermittent, geography limited, and transmission short to compensate like natural gas can.

"U.S. coal power capacity has fallen by a third since 2010," and last year "16 gigawatts (16,000 MW) of U.S. coal-fired power plants retired."

This year, some 2,000 MW of coal was retired in February alone, with 7,420 MW expected to be closed in 2019.

Ditto for nuclear.

Nuclear retirements this year include Pilgrim, Massachusetts’s only nuclear plant, and Three Mile Island in Pennsylvania.

This will take a combined ~1,600 MW of nuclear capacity offline.

Another 2,500 MW and 4,300 MW of nuclear are expected to be leaving the U.S. power system in 2020 and 2021, respectively.

As more nuclear plants close, EIA projects that net electricity generation from U.S. nuclear power reactors will fall by 17% by 2025.

From 2019-2025 alone, EIA expects U.S. coal capacity to plummet nearly 25% to 176,000 MW, with nuclear falling 15% to 83,000 MW.

In contrast, new combined cycle gas plants will grow capacity almost 30% to around 310,000 MW.

Lower and lower projected commodity prices for gas encourage this immense gas build-out, not to mention non-stop increases in efficiency for gas-based units.

Remember that these are official U.S. Department of Energy estimates, not coming from the industry itself.

In other words, our Department of Energy concludes that gas is the future.

Our hotter and hotter summers are therefore more and more becoming: "summers for natural gas"

Ultimately, this shows why the anti-pipeline movement is so dangerous.

"Affordable Energy Coalition Highlights Ripple Effect of Natural Gas Moratorium."

In April, President Trump signed two executive orders to promote energy infrastructure by directing federal agencies to remove bottlenecks for gas transport into the Northeast in particular, where New England oil-fired generation has spiked, and to streamline federal reviews of border-crossing pipelines and other infrastructure.

Builders, however, are not relying on outside help: all they know is that more U.S. gas demand is a constant, so more infrastructure is mandatory.

They are moving forward diligently: for example, there are now some 27 pipelines worth $33 billion already in the works in Appalachia.


Related News

View more

EU draft shows plan for more fixed-price electricity contracts

EU Electricity Market Reform advances two-way CfDs, PPAs, and fixed-price tariffs to cut volatility, support renewables and nuclear, stabilize investor revenues, and protect consumers from price spikes across wholesale power markets.


Key Points

An EU plan expanding two-way CfDs, PPAs, and fixed-price contracts to curb price swings and support low-carbon power.

✅ Two-way CfDs return excess revenues to consumers

✅ Boosts PPAs and fixed-price retail options

✅ Targets renewables, nuclear; limits fossil exposure


The European Union wants to expand the use of contracts that pay power plants a fixed price for electricity, a draft proposal showed, as part of an electricity market revamp to shield European consumers from big price swings.

The European Commission pledged last year to reform the EU's electricity market rules, after record-high gas prices, caused by cuts to Russian flows, sent power prices soaring, prompting debates over gas price cap strategies in response.

A draft of the EU executive's proposal, seen by Reuters on Tuesday and due to be published on Mar. 16, steered clear of the deep redesign of the electricity market that some member states have called for, even as nine EU countries opposed sweeping reforms as a fix earlier in the crisis, suggesting instead limited changes to nudge countries towards more predictable, fixed-price power contracts.

If EU countries want to support new investments in wind, solar, geothermal, hydropower and nuclear electricity, for example - a point over which France and Germany have wrestled - they should use a two-way contract for difference (CfD) or an equivalent contract, the draft said.

The aim is to provide a stable revenue stream to investors, and help make consumers' energy bills less volatile, even though rolling back electricity prices is tougher than it appears. Restricting this support to renewable and low-carbon electricity also aims to speed up Europe's shift away from fossil fuels.

Two-way CfDs offer generators a fixed "strike price" for their electricity, regardless of the price in short-term energy markets. If the market price is above the CfD strike price, then the extra revenue the generator receives should be handed out to final electricity consumers, the draft EU document said.

Countries should also make it easier for power buyers to sign power purchase agreements (PPA) - another type of long-term contract to directly buy electricity from a generator.

Governments should also make sure consumers have access to fixed-price electricity contracts - echoing France's new electricity pricing scheme to reassure Brussels - giving them the option to avoid a contract that would expose them to volatile prices swings in energy markets, the draft said.

If European energy prices were to spike to extreme levels again, the Commission suggested allowing national governments to temporarily intervene to fix prices while weighing emergency measures to limit prices where needed, and offer consumers and small businesses a share of their electricity at a lower price.


Related News

View more

Texas produces and consumes the most electricity in the US

Texas ERCOT Power Grid leads U.S. wind generation yet faces isolated interconnection, FERC exemption, and high industrial energy use, with distinct electricity and natural gas prices managed by a single balancing authority.


Key Points

The state-run interconnection that balances Texas electricity, isolated from FERC oversight and other U.S. grids.

✅ Largest U.S. wind power producer, high industrial demand

✅ Operates one balancing authority, independent interconnection

✅ Pays lower electricity, higher natural gas vs national average


For nearly two decades, the Lone Star State has generated more wind-sourced electricity than any other state in the U.S., according to the Energy Information Administration, or EIA.

In 2022, EIA reported Texas produced more electricity than any other state and generated twice as much as second-place Florida.

However, Texas also leads the country in another category. According to EIA, Texas is the largest energy-consuming state in the nation across all sectors with more than half of the state’s energy being used by the industrial sector.

As of May 2023, Texas residents paid 43% more for natural gas and around 10% less for electricity compared to the national average, according to EIA, and in competitive areas shopping for electricity is getting cheaper as well. Commercial and industrial sectors on average for the same month paid 25% less for electricity compared to the national average.


U.S. electric system compared to Texas
The U.S. electric system is essentially split into three regions called interconnections and are managed by a total of 74 entities called balancing authorities that ensure that power supply and demand are balanced throughout the region to prevent the possibility of blackouts, according to EIA.

The three regions (Interconnections):

Eastern Interconnection: Covers all U.S. states east of the Rocky Mountains, a portion of northern Texas, and consists of 36 balancing authorities.
Western Interconnection: Covers all U.S. states west of the Rockies and consists of 37 balancing authorities.
ERCOT: Covers the majority of Texas and consists of one balancing authority (itself).

During the 2021 winter storm, Texas electric cooperatives were credited with helping maintain service in many communities.

“ERCOT is unique in that the balancing authority, interconnection, and the regional transmission organization are all the same entity and physical system,” according to EIA, a structure often discussed in analyses of Texas power grid challenges today.

With this being the case, Texas is the only state in the U.S. that balances itself, the only state that is not subject to the jurisdiction of the Federal Energy Regulatory Commission, or FERC, and the only state that is not synchronously interconnected to the grid in the rest of the United States in the event of tight grid conditions, highlighting ongoing discussions about improving Texas grid reliability before peak seasons, according to EIA.

Every other state in the U.S. is connected to a web of multiple balancing authorities that contribute to ensuring power supply and demand are met.

California, for example, was the fourth largest electricity producer and the third largest electricity consumer in the nation in 2022, according to EIA, and California imports the most electricity from other states while Pennsylvania exports the most.

Although California produces significantly less electricity than Texas, it has the ability to connect with more than 10 neighboring balancing authorities within the Western Interconnection to interchange electricity, a dynamic that can see clean states importing dirty electricity under certain market conditions. ERCOT being independent only has electricity interchange with two balancing authorities, one of which is in Mexico.

Regardless of Texas’ unique power structure compared to the rest of the nation, the vast majority of the U.S. risked electricity supplies during this summer’s high heat, as outlined in severe heat blackout risks reports, according to EIA.


Related News

View more

Canada expected to miss its 2035 clean electricity goals

Canada 2035 Clean Electricity Target faces a 48.4GW shortfall as renewable capacity lags; accelerating wind, solar PV, grid upgrades, and coherent federal-provincial policy is vital to reach zero-emissions power and strengthen transmission and distribution.


Key Points

Canada's plan to supply nearly 100% of electricity from zero-emitting sources by 2035, requiring renewable buildout.

✅ Average adds 2.6GW; shortfall totals 48.4GW by 2035

✅ Expand wind, solar PV, storage, and grid modernization

✅ Align federal-province policy; retire or convert thermal plants


GlobalData’s latest report, ‘Canada Power Market Size and Trends by Installed Capacity, Generation, Transmission, Distribution and Technology, Regulations, Key Players and Forecast, 2022-2035’, discusses the power market structure of Canada and, amid looming power challenges, provides historical and forecast numbers for capacity, generation and consumption up to 2035. Detailed analysis of the country’s power market regulatory structure, competitive landscape and a list of major power plants are provided. The report also gives a snapshot of the power sector in the country on broad parameters of macroeconomics, supply security, generation infrastructure, transmission and distribution infrastructure, electricity import and export scenario, degree of competition, regulatory scenario, and future potential. An analysis of the deals in the country’s power sector is also included in the report.

Canada is expected to fall short of its 2035 clean electricity target after reviewing the country’s current renewable capacity activity. The country has targeted to produce nearly 100% of its electricity from zero-emitting sources by 2035, while electricity associations' net-zero goals extend to 2050; however, the country is adding only 2.6GW of annual renewable capacity additions on average every year, which would mean a cumulative shortfall of 48.4GW.

Canada has good governmental support, but it is not doing enough to ensure its targets are met. If the country is to meet its target to produce nearly 100% of electricity from zero-emitting sources by 2035, the country should both increase the capacity and efficiency of renewable power plants, as well as provide comprehensive end-to-end policies at both the federal and provincial levels, as debates over whether Ontario is embracing clean power continue across provinces. It should also involve communities and businesses in raising awareness of the benefits of adopting renewable energy.

The country has a large amount of proven natural gas and oil reserves that are proving too tempting an opportunity, and the Canadian Government is planning to increase the capacity of its gas-based plants under net-zero regulations permit some gas in the power mix, to secure real-time demand and supply. However, the country’s dependency on gas-based plants creates a major challenge to achieve its 2035 clean electricity target.

If the Canadian Government is to meet its 2035 targets, it should draw on examples from its European counterparts and add renewable capacity at a rapid pace, while balancing demand and emissions in key provinces. One advantage for Canada here is that it does not have land constraints, which is common in other major renewable power-generating countries. This could give the country an estimated 6.1GW of renewable capacity every year on average during the 2021-2035 period: enough capacity to meet its target. Most of these installations are expected to be for wind and solar PV.

Changing provincial governments are not helpful when it comes to implementing long-term projects, especially as Ontario faces looming electricity shortfalls that heighten planning risks, and continued stopping and starting of projects like this will only be damaging to renewable goals. Another way the country can achieve its target is by converting thermal power plants into clean energy plants and providing a roadmap or timeline for provinces to retire thermal power plants completely, even as scrapping coal can be costly for some systems.

Canada’s GDP (at constant prices) increased from $1,617.3bn in 2010 to $1,924.5bn in 2021, at a CAGR of 1.6%. The GDP (at constant prices) of the country declined sharply from $1,943.8bn in 2019 to $1,840.5bn in 2020 because of Covid-19 pandemic. After the recommencement of regular industrial and trade activities, the GDP grew by 4.6% in 2021 from 2020. The GDP is expected to cross pre-pandemic levels by the end of 2022.


Related News

View more

Sign Up for Electricity Forum’s Newsletter

Stay informed with our FREE Newsletter — get the latest news, breakthrough technologies, and expert insights, delivered straight to your inbox.

Electricity Today T&D Magazine Subscribe for FREE

Stay informed with the latest T&D policies and technologies.
  • Timely insights from industry experts
  • Practical solutions T&D engineers
  • Free access to every issue

Download the 2025 Electrical Training Catalog

Explore 50+ live, expert-led electrical training courses –

  • Interactive
  • Flexible
  • CEU-cerified