BC Hydro drought operations address climate change impacts with hydropower scheduling, reservoir management, water conservation, inflow forecasting, and fish habitat protection across the Lower Mainland and Vancouver Island while maintaining electricity generation from storage facilities.
Key Points
BC Hydro drought operations conserve water, protect fish, and sustain hydropower during extended heat and low inflows.
✅ Proactive reservoir releases protect downstream salmon spawning.
✅ Reduced flows at Puntledge, Coquitlam, and Ruskin/Stave facilities.
✅ System relies on northern storage to maintain electricity supply.
BC Hydro is adjusting its operating plans around power generation as extended heat and little forecast rain continue to impact the province, a report says.
“Unpredictable weather patterns related to climate change are expected to continue in the years ahead and BC Hydro is constantly adapting to these evolving conditions, especially after events such as record demand in 2021 that tested the grid,” said the report, titled “Casting drought: How climate change is contributing to uncertain weather and how BC Hydro’s generation system is adapting.”
The study said there is no concern with BC Hydro being able to continue to deliver power through the drought because there is enough water at its larger facilities, even as issues like crypto mining electricity use draw scrutiny from observers.
Still, it said, with no meaningful precipitation in the forecast, its smaller facilities in the Lower Mainland and on Vancouver Island will continue to see record low or near record low inflows for this time of the year.
“In the Lower Mainland, inflows since the beginning of September are ranked in the bottom three compared to historical records,” the report said.
The report said the hydroelectric system is directly impacted by variations in weather and the record-setting, unseasonably dry and warm weather this fall highlights the impacts of climate change, while demand patterns can be counterintuitive, as electricity use even increased during Earth Hour 2018 in some areas, hinting at challenges to come.
It noted symptoms of climate change include increased frequency of extreme events like drought and intense storms, and rapid glacial melt.
“With the extremely hot and dry conditions, BC Hydro has been taking proactive steps at many of our South Coast facilities for months to conserve water to protect the downstream fish habit,” spokesperson Mora Scott said. “We began holding back water in July and August at some facilities anticipating the dry conditions to help ensure we would have water storage for the later summer and early fall salmon spawning.”
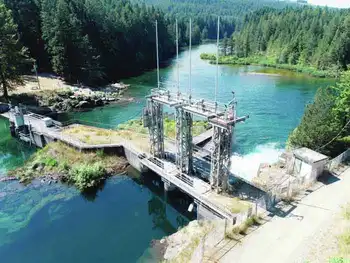
Scott said BC Hydro’s reservoirs play an important role in managing these difficult conditions by using storage and planning releases to provide protection to downstream river flows. The reservoirs are, in effect, a battery waiting to be used for power.
While the dry conditions have had an impact on BC Hydro’s watersheds, several unregulated natural river systems — not related to BC Hydro — have fared worse, with rivers drying up and thousands of fish killed, the report said.
BC Hydro is currently seeing the most significant impacts on operations at Puntledge and Campbell River on Vancouver Island as well as Coquitlam and Ruskin/Stave in the Lower Mainland.
To help manage water levels on Vancouver Island, BC Hydro reduced Puntledge River flows by one-third last week and on the Lower Mainland reduced flows at Coquitlam by one-third and Ruskin/Stave by one quarter.
However, the utility company said, there are no concerns about continued power delivery.
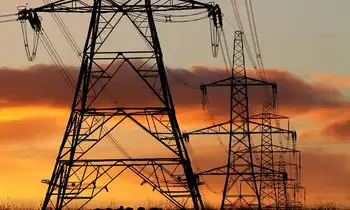
“British Columbians benefit from BC Hydro’s integrated, provincial electricity system, which helps send power across the province, including to Vancouver Island, and programs like the winter payment plan support customers during colder months,” staff said.
Most of the electricity generated and used in B.C. is produced by larger facilities in the north and southeast of the province — and while water levels in those areas are below normal levels, there is enough water to meet the province’s power needs, even as additions like Site C's electricity remain a subject of debate among observers.
The Glacier Media investigation found a quarter of BC Hydro's power comes from the Mica, Revelstoke and Hugh Keenleyside dams on the Columbia River. Some 29% comes from dams in the Peace region, including the under-construction Site C project that has faced cost overruns. At certain points of the year, those reservoirs are reliant on glacier water.
Still, BC Hydro remains optimistic.
Forecasts are currently showing little rain in the near-term; however, historically, precipitation and inflows show up by the end of October. If that does not happen, BC Hydro said it would continue to closely track weather and inflow forecasts to adapt its operations to protect fish, while regional cooperation such as bridging with Alberta remains part of broader policy discussions.
Among things BC Hydro said it is doing to adapt are:
Continuously working to improve its weather and inflow forecasting;
Expanding its hydroclimate monitoring technology, including custom-made solutions that have been designed in-house, as well as upgrading snow survey stations to automated, real-time snow and climate stations, and;
Investing in capital projects — like spillway gate replacements — that will increase resiliency of the system to climate change.
Related News