Five Nations Energy Transmission Line connects remote First Nations to the Ontario power grid, delivering clean, reliable electricity to Western James Bay through Indigenous-owned transmission infrastructure, replacing diesel generators and enabling sustainable community growth.
Key Points
An Indigenous-owned grid link providing reliable power to Western James Bay First Nations, replacing polluting diesel.
✅ Built by five First Nations; fully Indigenous-owned utility
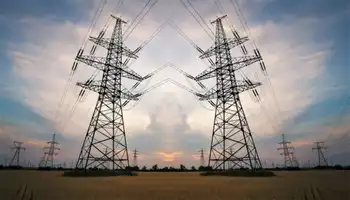
✅ 270 km line connecting remote James Bay communities
✅ Ended diesel dependence; enabled sustainable development
For the Indigenous communities along northern Ontario’s James Bay — the ones that have lived on and taken care of the lands as long as anyone can remember — the new millenium marked the start of a diesel-less future, even as Ontario’s electricity outlook raised concerns about getting dirtier in policy debates.
While the southern part of the province took Ontario’s power grid for granted, despite lessons from Europe’s power crisis about reliability, the vast majority of these communities had never been plugged in. Their only source of power was a handful of very loud diesel-powered generators. Because of that, daily life in the Attawapiskat, Kashechewan and Fort Albany First Nations involved deliberating a series of tradeoffs. Could you listen to the radio while toasting a piece of bread? How many Christmas lights could you connect before nothing else was usable? Was there enough power to open a new school?
The communities wanted a safe, reliable, clean alternative, with Manitoba’s clean energy illustrating regional potential, too. So did their chiefs, which is why they passed a resolution in 1996 to connect the area to Ontario’s grid, not just for basic necessities but to facilitate growth and development, and improve their communities’ quality of life.
The idea was unthinkable at the time — scorned and dismissed by those who held the keys to Ontario’s (electrical) power, much like independent power projects can be in other jurisdictions. Even some in the community didn’t fully understand it. When the idea was first proposed at a gathering of Nishnawbe Aski Nation, which represents 49 First Nations, one attendee said the only way he could picture the connection was as “a little extension cord running through the bush from Moosonee.”
But the leadership of Attawapiskat, Kashechewan and Fort Albany First Nations had been dreaming and planning. In 1997, along with members of Taykwa Tagamou and Moose Cree First Nations, they created the first, and thus far only, fully Indigenous-owned energy company in Canada: Five Nations Energy Inc., as partnerships like an OPG First Nation hydro project would later show in action, too.
Over the next five years, the organization built Omushkego Ishkotayo, the Cree name for the Western James Bay transmission line: “Omushkego” refers to the Swampy Cree people, and “Ishkotayo” to hydroelectric power, while other regions were commissioning new BC generating stations in parallel. The 270-kilometre-long transmission line is in one of the most isolated regions of Ontario, one that can only be accessed by plane, except for a few months in winter when ice roads are strong enough to drive on. The project went online in 2001, bringing reliable power to over 7,000 people who were previously underserved by the province’s energy providers. It also, somewhat controversially, enabled Ontario’s first diamond mine in Attawapiskat territory.
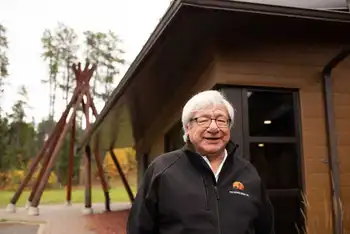
The future the First Nations created 25 years ago is blissfully quiet, now that the diesel generators are shut off. “When the power went on, you could hear the birds,” Patrick Chilton, the CEO of Five Nations Energy, said with a smile. “Our communities were glowing.”
Power, politics and money: Five Nations Energy needed government, banks and builders on board
Chilton took over in 2013 after the former CEO, his brother Ed, passed away. “This was all his idea,” Chilton told The Narwhal in a conversation over Zoom from his office in Timmins, Ont. The company’s story has never been told before in full, he said, because he felt “vulnerable” to the forces that fought against Omushkego Ishkotayo or didn’t understand it, a dynamic underscored by Canada’s looming power problem reporting in recent years.
The success of Five Nations Energy is a tale of unwavering determination and imagination, Chilton said, and it started with his older brother. “Ed was the first person who believed a transmission line was possible,” he said.
In a Timmins Daily Press death notice published July 2, 2013, Ed Chilton is described as having “a quiet but profound impact on the establishment of agreements and enterprises benefitting First Nations peoples and their lands.” Chilton doesn’t describe him that way, exactly.
“If you knew my brother, he was very stubborn,” he said. A certified engineering technologist, Ed was a visionary whose whole life was defined by the transmission line. He was the first to approach the chiefs with the idea, the first to reach out to energy companies and government officials and the one who persuaded thousands of people in remote, underserved communities that it was possible to bring power to their region.
After that 1996 meeting of Nishnawbe Aski Nation, there came a four-year-long effort to convince the rest of Ontario, and the country, the project was possible and financially viable. The chiefs of the five First Nations took their idea to the halls of power: Queen’s Park, Parliament Hill and the provincial power distributor Hydro One (then Ontario Hydro).
“All of them said no,” Chilton said. “They saw it as near to impossible — the idea that you could build a transmission line in the ‘swamp,’ as they called it.” The Five Nations Energy team kept a document at the time tracking how many times they heard no; it topped out at 37.
One of the worst times was in 1998, at a meeting on the 19th floor of the Ontario Hydro building in the heart of downtown Toronto. There, despite all their preparation and planning, a senior member of the Ontario Hydro team told Chilton, Martin and other chiefs “you’ll build that line over my dead body,” Chilton recalled.
At the time, Chilton said, Ontario Hydro was refusing to cooperate: unwilling to let go of its monopoly over transmission lines, but also saying it was unable to connect new houses in the First Nations to diesel generators it said were at maximum capacity. (Ontario Hydro no longer exists; Hydro One declined to comment.)
“There’s always naysayers no matter what you’re doing,” Martin said. “What we were doing had never been done before. So of course people were telling us how we had never managed something of this size or a budget of this size.”
“[Our people] basically told them to blow it up your ass. We can do it,” Chilton said.
So the chiefs of the five nations did something they’d never done before: they went to all of the big banks and many, many charitable foundations trying to get the money, a big ask for a project of this scale, in this location. Without outside support, their pitch was that they’d build it themselves.
This was the hardest part of the process, said Lawrence Martin, the former Grand Chief of Mushkegowuk Tribal Council and a member of the Five Nations Energy board. “We didn’t know how to finance something like this, to get loans,” he told The Narwhal. “That was the toughest task for all of us to achieve.”
Eventually, they got nearly $50 million in funding from a series of financial organizations including the Bank of Montreal, Pacific and Western Capital, the Northern Ontario Heritage Fund Corporation (an Ontario government agency) and the engineering and construction company SNC Lavalin, which did an assessment of the area and deemed the project viable.
And in 1999, Ed Chilton, other members of the Chilton family and the chiefs were able to secure an agreement with Ontario Hydro that would allow them to buy electricity from the province and sell it to their communities.
Related News