Bitcoin Energy Consumption drives debate on blockchain mining, proof-of-work, carbon footprint, and emissions, with CCAF estimates in terawatt hours highlighting electricity demand, fossil fuel reliance, and sustainability concerns for data centers and cryptocurrency networks.
Key Points
Electricity used by Bitcoin proof-of-work mining, often fossil-fueled, estimated by CCAF in terawatt hours.
✅ CCAF: 40-445 TWh, central estimate ~130 TWh
✅ ~66% of mining electricity sourced from fossil fuels
✅ Proof-of-work increases hash rate, energy, and emissions
The University of Cambridge Centre for Alternative Finance (CCAF) studies the burgeoning business of cryptocurrencies.
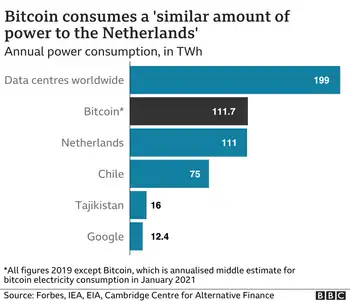
It calculates that Bitcoin's total energy consumption is somewhere between 40 and 445 annualised terawatt hours (TWh), with a central estimate of about 130 terawatt hours.
The UK's electricity consumption is a little over 300 TWh a year, while Argentina uses around the same amount of power as the CCAF's best guess for Bitcoin, as countries like New Zealand's electricity future are debated to balance demand.
And the electricity the Bitcoin miners use overwhelmingly comes from polluting sources, with the U.S. grid not 100% renewable underscoring broader energy mix challenges worldwide.
The CCAF team surveys the people who manage the Bitcoin network around the world on their energy use and found that about two-thirds of it is from fossil fuels, and some regions are weighing curbs like Russia's proposed mining ban amid electricity deficits.
Huge computing power - and therefore energy use - is built into the way the blockchain technology that underpins the cryptocurrency has been designed.
It relies on a vast decentralised network of computers.
These are the so-called Bitcoin "miners" who enable new Bitcoins to be created, but also independently verify and record every transaction made in the currency.
In fact, the Bitcoins are the reward miners get for maintaining this record accurately.
It works like a lottery that runs every 10 minutes, explains Gina Pieters, an economics professor at the University of Chicago and a research fellow with the CCAF team.
Data processing centres around the world, including hotspots such as Iceland's mining strain, race to compile and submit this record of transactions in a way that is acceptable to the system.
They also have to guess a random number.
The first to submit the record and the correct number wins the prize - this becomes the next block in the blockchain.
Estimates for bitcoin's electricity consumption
At the moment, they are rewarded with six-and-a-quarter Bitcoins, valued at about $50,000 each.
As soon as one lottery is over, a new number is generated, and the whole process starts again.
The higher the price, says Prof Pieters, the more miners want to get into the game, and utilities like BC Hydro suspending new crypto connections highlight grid pressures.
"They want to get that revenue," she tells me, "and that's what's going to encourage them to introduce more and more powerful machines in order to guess this random number, and therefore you will see an increase in energy consumption," she says.
And there is another factor that drives Bitcoin's increasing energy consumption.
The software ensures it always takes 10 minutes for the puzzle to be solved, so if the number of miners is increasing, the puzzle gets harder and the more computing power needs to be thrown at it.
Bitcoin is therefore actually designed to encourage increased computing effort.
The idea is that the more computers that compete to maintain the blockchain, the safer it becomes, because anyone who might want to try and undermine the currency must control and operate at least as much computing power as the rest of the miners put together.
What this means is that, as Bitcoin gets more valuable, the computing effort expended on creating and maintaining it - and therefore the energy consumed - inevitably increases.
We can track how much effort miners are making to create the currency.
They are currently reckoned to be making 160 quintillion calculations every second - that's 160,000,000,000,000,000,000, in case you were wondering.
And this vast computational effort is the cryptocurrency's Achilles heel, says Alex de Vries, the founder of the Digiconomist website and an expert on Bitcoin.
All the millions of trillions of calculations it takes to keep the system running aren't really doing any useful work.
"They're computations that serve no other purpose," says de Vries, "they're just immediately discarded again. Right now we're using a whole lot of energy to produce those calculations, but also the majority of that is sourced from fossil energy, and clean energy's 'dirty secret' complicates substitution."
The vast effort it requires also makes Bitcoin inherently difficult to scale, he argues.
"If Bitcoin were to be adopted as a global reserve currency," he speculates, "the Bitcoin price will probably be in the millions, and those miners will have more money than the entire [US] Federal budget to spend on electricity."
"We'd have to double our global energy production," he says with a laugh, even as some argue cheap abundant electricity is getting closer to reality today. "For Bitcoin."
He says it also limits the number of transactions the system can process to about five per second.
This doesn't make for a useful currency, he argues.
Rising price of bitcoin graphic
And that view is echoed by many eminent figures in finance and economics.
The two essential features of a successful currency are that it is an effective form of exchange and a stable store of value, says Ken Rogoff, a professor of economics at Harvard University in Cambridge, Massachusetts, and a former chief economist at the International Monetary Fund (IMF).
He says Bitcoin is neither.
"The fact is, it's not really used much in the legal economy now. Yes, one rich person sells it to another, but that's not a final use. And without that it really doesn't have a long-term future."
What he is saying is that Bitcoin exists almost exclusively as a vehicle for speculation.
So, I want to know: is the bubble about to burst?
"That's my guess," says Prof Rogoff and pauses.
"But I really couldn't tell you when."
Related News