2040 Energy Outlook projects a shifting energy mix as renewables scale, EV adoption accelerates, and IEA forecasts plateauing oil demand alongside rising natural gas, highlighting policy, efficiency, and decarbonization trends that shape global consumption.
Key Points
A data-driven view of future energy mix, covering renewables, fossil fuels, EVs, oil demand, and policy impacts.
✅ Renewables reach 16-30% by 2040, higher with strong policy support.
✅ Fossil fuels remain dominant, with oil flat and natural gas rising.
✅ EV share surges, cutting oil use; efficiency curbs demand growth.
Which is more plausible: flying taxis, wind turbine arrays stretching miles into the ocean, and a solar roof on every house--or a scorched-earth, flooded post-Apocalyptic world?
We have no way of peeking into the future, but we can certainly imagine it. There is plenty of information about where the world is headed and regardless of how reliable this information is—or isn’t—we never stop wondering. Will the energy world of 20 years from now be better or worse than the world we live in now?
The answer may very well lie in the observable trends.
A Growing Population
The global population is growing, and it will continue to grow in the next two decades. This will drive a steady growth in energy demand, at about 1 percent per year, according to the International Energy Agency.
This modest rate of growth is good news for all who are concerned about the future of the planet. Parts of the world are trying to reduce their energy consumption, and this should have a positive effect on the carbon footprint of humanity. The energy thirst of most parts of the world will continue growing, however, hence the overall growth.
The world’s population is currently growing at a rate of a little over 1 percent annually. This rate of growth has been slowing since its peak in the 1960s and forecasts suggest that it will continue to slow. Growth in energy demand, on the other hand, may at some point stop moving in tune with population growth trends as affluence in some parts of the world grows. The richer people get, the more energy they need. So, to the big question: where will this energy come from?
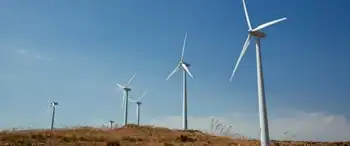
The Rise of Renewables
For all the headline space they have been claiming, it may come as a disappointing surprise to many that renewable energy, excluding hydropower, to date accounts for just 14 percent of the global primary energy mix.
Certainly, adoption of solar and wind energy has been growing in leaps and bounds, with their global share doubling in five years in many markets, but unless governments around the world commit a lot more money and effort to renewable energy, by 2040, solar and wind’s share in the energy mix will still only rise to about 16 to 17 percent. That’s according to the only comprehensive report on the future of energy that collates data from all the leading energy authorities in the world, by non-profit Resources for the Future.
The growth in renewables adoption, however, would be a lot more impressive if governments do make serious commitments. Under that scenario, the share of renewables will double to over 30 percent by 2040, echoing milestones like over 30% of global electricity reached recently: that’s the median rate of all authoritative forecasts. Amongst them, the adoption rates of renewables vary between 15 percent and 61 percent by 2040.
Even the most bullish of the forecasts on renewables is still far below the 100-percent renewable future many would like to fantasize about, although BNEF’s 50% by 2050 outlook points to what could be possible in the power sector.
But in 2040, most of the world’s energy will still come from fossil fuels.
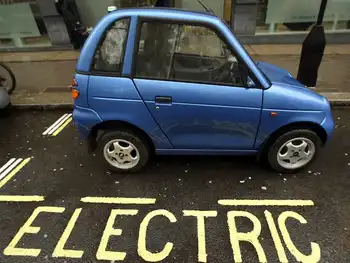
EV Energy
Here, forecasters are more optimistic. Again, there is a wide variation between forecasts, but in each and every one of them the share of electric vehicles on the world’s roads in 2040 is a lot higher than the meagre 1 percent of the global car fleet EVs constitute today.
Related: Gas Prices Languish As Storage Falls To Near-Record Lows
Government policy will be the key, as U.S. progress toward 30% wind and solar shows how policy steers the power mix that EVs ultimately depend on. Bans of internal combustion engines will go a long way toward boosting EV adoption, which is why some forecasters expect electric cars to come to account for more than 50 percent of cars on the road in 2040. Others, however, are more guarded in their forecasts, seeing their share of the global fleet at between 16 percent and a little over 40 percent.
Many pin their hopes for a less emission-intensive future on electric cars. Indeed, as the number of EVs rises, they displace ICE vehicles and, respectively, the emission-causing oil that fuels for ICE cars are made from. It should be a no brainer that the more EVs we drive, the less emissions we produce. Unfortunately, this is not necessarily the case: China is the world’s biggest EV market, and its solar PV expansion has been rapid, it has the most EVs—including passenger cars and buses—but it is also one of the biggest emitters.
Still, by 2040, if the more optimistic forecasts come true, the world will be consuming less oil than it is consuming now: anywhere from 1.2 million bpd to 20 million bpd less, the latter case envisaging an all-electric global fleet in 2040.
This Ain’t Your Daddy’s Oil
No, it ain’t. It’s your grandchildren’s oil, for good or for bad. The vision of an oil-free world where renewable power is both abundant and cheap enough to replace all the ways in which crude oil and natural gas are used will in 2040 still be just that--a vision, with practical U.S. grid constraints underscoring the challenges. Even the most optimistic energy scenarios for two decades from now see them as the dominant source of energy, with forecasts ranging between 60 percent and 79 percent. While these extremes are both below the over-80 percent share fossil fuels have in the world’s energy mix, they are well above 50 percent, and in the U.S. renewables are projected to reach about one-fourth of electricity soon, even as fossil fuels remain foundational.
Still, there is good news. Fuel efficiency alone will reduce oil demand significantly by 2040. In fact, according to the IEA, demand will plateau at a little over 100 million bpd by the mid-2030s. Combined with the influx of EVs many expect, the world of 20 years from now may indeed be consuming a lot less oil than the world of today. It will, however, likely consume a lot more natural gas. There is simply no way around fossil fuels, not yet. Unless a miracle of politics happens (complete with a ripple effect that will cost millions of people their jobs) in 2040 we will be as dependent on oil and gas as we are but we will hopefully breathe cleaner air.
By Irina Slav for Oilprice.com
Related News