Symbion Power awarded transmission project in Iraq

By Electricity Forum


CSA Z462 Arc Flash Training - Electrical Safety Essentials

Our customized live online or in‑person group training can be delivered to your staff at your location.

  • Live Online
  • 6 hours Instructor-led
  • Group Training Available
Regular Price:
$249
Coupon Price:
$199
Reserve Your Seat Today
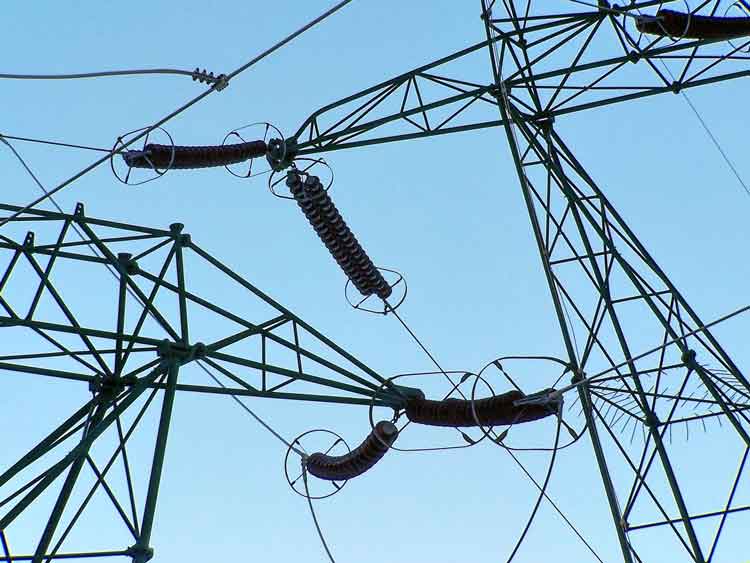
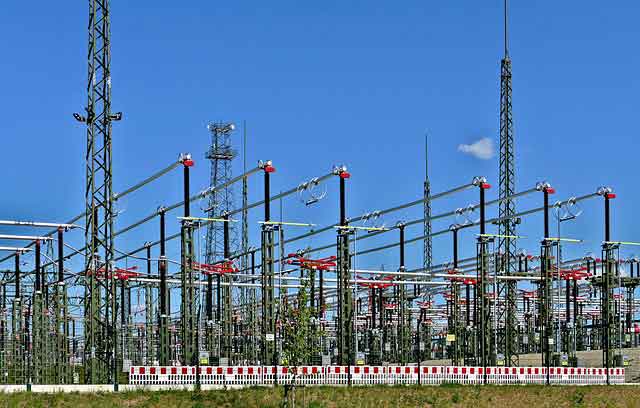
Symbion Power announced that it has been awarded the Aqra-Khabat 132kV electrical transmission and distribution project by the Ministry of Electricity of the Kurdish Regional Government (KRG).

The project is an extension of the Aqra-Dohuk substation that was recently completed by Symbion. Until this project was completed, there was no 132kV transmission to bridge the gap between the Dohuk and Erbil Governerates via the Aqra route. While the Dohuk to Aqra project provided much needed electricity to the villages of Aqra and closed the gap considerably, it did not fully bridge the line to Erbil.

Over the last few years, Symbion has been building extensive systems in partnership with local companies throughout Iraq, including 300 miles of 400kV and 132kV transmission line and eleven 132KV substations. Symbion is rated amongst the top ten U.S. firms in the Iraq reconstruction market.

In Iraq and other countries Symbion Power has developed a unique approach to meet labor needs. Symbion identifies local firms and people who have the basic skills to handle the work and then provides additional training. This is the approach they will take in Kurdistan.

The project is viewed by the KRG Ministry as one of the most important in the region since it will link Aqra to Erbil through a 4 bay extension of Aqra substation and 60km of overhead line where it will eventually terminate in Khabat in the Erbil Governerate.

“Symbion intends to invest heavily in the Kurdish region and will continue to work in the development of this important area and in the rest of Iraq," said Paul Hinks, Symbion Power CEO. "We have worked in Iraq in very difficult and traumatic times and we intend to remain here to participate in the reconstruction of the entire country. We have never been deterred by the adverse security situation and we consider the people of Iraq as our partners and our friends. I am very proud that I lead a US firm that has such excellent relations with the Iraqi people.”

Related News

Which of the cleaner states imports dirty electricity?

Hourly Electricity Emissions Tracking maps grid balancing areas, embodied emissions, and imports/exports, revealing carbon intensity shifts across PJM, ERCOT, and California ISO, and clarifying renewable energy versus coal impacts on health and climate.


Key Points

An hourly method tracing generation, flows, and embodied emissions to quantify carbon intensity across US balancing areas.

✅ Hourly traces of imports/exports and generation mix

✅ Consumption-based carbon intensity by balancing area

✅ Policy insights for renewables, coal, health costs


In the United States, electricity generation accounts for nearly 30% of our carbon emissions. Some states have responded to that by setting aggressive renewable energy standards; others are hoping to see coal propped up even as its economics get worse. Complicating matters further is the fact that many regional grids are integrated, and as America goes electric the stakes grow, meaning power generated in one location may be exported and used in a different state entirely.

Tracking these electricity exports is critical for understanding how to lower our national carbon emissions. In addition, power from a dirty source like coal has health and environment impacts where it's produced, and the costs of these aren't always paid by the parties using the electricity. Unfortunately, getting reliable figures on how electricity is produced and where it's used is challenging, even for consumers trying to find where their electricity comes from in the first place, leaving some of the best estimates with a time resolution of only a month.

Now, three Stanford researchers—Jacques A. de Chalendar, John Taggart, and Sally M. Benson—have greatly improved on that standard, and they have managed to track power generation and use on an hourly basis. The researchers found that, of the 66 grid balancing areas within the United States, only three have carbon emissions equivalent to our national average, and they have found that imports and exports of electricity have both seasonal and daily changes. de Chalendar et al. discovered that the net results can be substantial, with imported electricity increasing California's emissions/power by 20%.

Hour by hour
To figure out the US energy trading landscape, the researchers obtained 2016 data for grid features called balancing areas. The continental US has 66 of these, providing much better spatial resolution on the data than the larger grid subdivisions. This doesn't cover everything—several balancing areas in Canada and Mexico are tied in to the US grid—and some of these balancing areas are much larger than others. The PJM grid, serving Pennsylvania, New Jersey, and Maryland, for example, is more than twice as large as Texas' ERCOT, in a state that produces and consumes the most electricity in the US.

Despite these limitations, it's possible to get hourly figures on how much electricity was generated, what was used to produce it, and whether it was used locally or exported to another balancing area. Information on the generating sources allowed the researchers to attach an emissions figure to each unit of electricity produced. Coal, for example, produces double the emissions of natural gas, which in turn produces more than an order of magnitude more carbon dioxide than the manufacturing of solar, wind, or hydro facilities. These figures were turned into what the authors call "embodied emissions" that can be traced to where they're eventually used.

Similar figures were also generated for sulfur dioxide and nitrogen oxides. Released by the burning of fossil fuels, these can both influence the global climate and produce local health problems.

Huge variation
The results were striking. "The consumption-based carbon intensity of electricity varies by almost an order of magnitude across the different regions in the US electricity system," the authors conclude. The low is the Bonneville Power grid region, which is largely supplied by hydropower; it has typical emissions below 100kg of carbon dioxide per megawatt-hour. The highest emissions come in the Ohio Valley Electric region, where emissions clear 900kg/MW-hr. Only three regional grids match the overall grid emissions intensity, although that includes the very large PJM (where capacity auction payouts recently fell), ERCOT, and Southern Co balancing areas.

Most of the low-emissions power that's exported comes from the Pacific Northwest's abundant hydropower, while the Rocky Mountains area exports electricity with the highest associated emissions. That leads to some striking asymmetries. Local generation in the hydro-rich Idaho Power Company has embodied emissions of only 71kg/MW-hr, while its imports, coming primarily from Rocky Mountain states, have a carbon content of 625kg/MW-hr.

The reliance on hydropower also makes the asymmetry seasonal. Local generation is highest in the spring as snow melts, but imports become a larger source outside this time of year. As solar and wind can also have pronounced seasonal shifts, similar changes will likely be seen as these become larger contributors to many of these regional grids. Similar things occur daily, as both demand and solar production (and, to a lesser extent, wind) have distinct daily profiles.

The Golden State
California's CISO provides another instructive case. Imports represent less than 30% of its total electric use in 2016, yet California electricity imports provided 40% of its embodied emissions. Some of these, however, come internally from California, provided by the Los Angeles Department of Water and Power. The state itself, however, has only had limited tracking of imported emissions, lumping many of its sources as "other," and has been exporting its energy policies to Western states in ways that shape regional markets.

Overall, the 2016 inventory provides a narrow picture of the US grid, as plenty of trends are rapidly changing our country's emissions profile, including the rise of renewables and the widespread adoption of efficiency measures and other utility trends in 2017 that continue to evolve. The method developed here can, however, allow for annual updates, providing us with a much better picture of trends. That could be quite valuable to track things like how the rapid rise in solar power is altering the daily production of clean power.

More significantly, it provides a basis for more informed policymaking. States that wish to promote low-emissions power can use the information here to either alter the source of their imports or to encourage the sites where they're produced to adopt more renewable power. And those states that are exporting electricity produced primarily through fossil fuels could ensure that the locations where the power is used pay a price that includes the health costs of its production.


Related News

View more

Alberta's electricity rebate program extended until December

Alberta Electricity Rebate Extension provides $50 monthly credits, utility bill relief, and an natural gas rebate, supporting homes, farms, and small businesses with energy costs through December 2022, capped at 250 MWh per year.


Key Points

A provincial program extending $50 credits and energy relief, with a natural gas rebate for eligible consumers in 2022.

✅ Up to $300 in bill credits; auto-applied to eligible accounts

✅ Applies to whole bill; limit 250 MWh/year consumption

✅ Natural gas rebate triggers above $6.50/GJ Oct-Mar 2023


Alberta's electricity rebate program has been extended by three months amid an electricity price spike in Alberta, and will now be in effect until the end of December, the government said.

The program was originally to provide more than 1.9 million homes, farms and small businesses with $50 monthly credits on their electricity bills, complementing a consumer price cap on power bills, for July, August and September. It will now also cover the final three months of 2022.

Those eligible for the rebate could receive up to $300 in credits until the end of December, a relief for Alberta ratepayers facing deferral costs.

The program, designed to provide relief to Albertans hit hard by high utility bills and soaring energy prices, will cost the Alberta government $600 million.

Albertans who have consumed electricity within the past calendar year, up to a maximum of 250 megawatt hours per year, are eligible for the rebates, which will be automatically applied to consumer bills, as seen in Ontario electricity bill support initiatives.

The rebates will apply to the entire bill, similar to a lump-sum credit in Newfoundland and Labrador, not just the energy portion, the government said. The rebates will be automatic and no application will be needed.

Starting October, the government will enact a natural gas rebate program until March 2023 that will kick in when prices exceed $6.50 per gigajoule, and Alberta's consumer price cap on electricity will remain in place.


Related News

View more

Solar Plus Battery Storage Cheaper Than Conventional Power in Germany

Germany Solar-Plus-Storage Cost Parity signals grid parity as solar power with battery storage undercuts conventional electricity. Falling LCOE, policy incentives, and economies of scale accelerate the energy transition and decarbonization across Germany's power market.


Key Points

The point at which solar power with battery storage is cheaper than conventional grid electricity across Germany.

✅ Lower LCOE from tech advances and economies of scale

✅ EEG incentives and streamlined installs cut total costs

✅ Enhances energy security, reduces fossil fuel dependence


Germany, a global leader in renewable energy adoption, with clean energy supplying about half of its electricity in recent years, has reached a significant milestone: the cost of solar power combined with battery storage has now fallen below that of conventional electricity sources. This development marks a transformative shift in the energy landscape, showcasing the increasing affordability and competitiveness of renewable energy technologies and reinforcing Germany’s position as a pioneer in the transition to sustainable energy.

The decline in costs for solar power paired with battery storage represents a breakthrough in Germany’s energy sector, especially amid the recent solar power boost during the energy crisis, where the transition from traditional fossil fuels to cleaner alternatives has been a central focus. Historically, conventional power sources such as coal, natural gas, and nuclear energy have dominated electricity markets due to their established infrastructure and relatively stable pricing. However, the rapid advancements in solar technology and energy storage solutions are altering this dynamic, making renewable energy not only environmentally preferable but also economically advantageous.

Several factors contribute to the cost reduction of solar power with battery storage:

  1. Technological Advancements: The technology behind solar panels and battery storage systems has evolved significantly over recent years. Solar panel efficiency has improved, allowing for greater energy generation from smaller installations. Similarly, cheaper batteries have advanced, with reductions in cost and increases in energy density and lifespan. These improvements mean that solar installations can produce more electricity and store it more effectively, enhancing their economic viability.

  2. Economies of Scale: As demand for solar and battery storage systems has grown, manufacturers have scaled up production, leading to economies of scale. This scaling has driven down the cost of both solar panels and batteries, making them more affordable for consumers. As the market for these technologies expands, prices are expected to continue decreasing, further enhancing their competitiveness.

  3. Government Incentives and Policies: Germany’s commitment to renewable energy has been supported by robust government policies and incentives. The country’s Renewable Energy Sources Act (EEG) and other supportive measures, alongside efforts to remove barriers to PV in Berlin that could accelerate adoption, have provided financial incentives for the adoption of solar power and battery storage. These policies have encouraged investment in renewable technologies and facilitated their integration into the energy market, contributing to the overall reduction in costs.

  4. Falling Installation Costs: The cost of installing solar power systems and battery storage has decreased as the industry has matured. Advances in installation techniques, increased competition among service providers, and streamlined permitting processes have all contributed to lower installation costs. This reduction in upfront expenses has made solar with battery storage more accessible and financially attractive to both residential and commercial consumers.

The economic benefits of solar power with battery storage becoming cheaper than conventional power are substantial. For consumers, this shift translates into lower electricity bills and reduced reliance on fossil fuels. Solar installations with battery storage allow households and businesses to generate their own electricity, store it for use during times of low sunlight, and even sell excess power back to the grid, reflecting how solar is reshaping electricity prices in Northern Europe as markets adapt. This self-sufficiency reduces exposure to fluctuating energy prices and enhances energy security.

For the broader energy market, the decreasing cost of solar power with battery storage challenges the dominance of conventional power sources. As renewable energy becomes more cost-effective, it creates pressure on traditional energy providers to adapt and invest in cleaner technologies, including responses to instances of negative electricity prices during renewable surpluses. This shift can accelerate the transition to a low-carbon energy system and contribute to the reduction of greenhouse gas emissions.

Germany’s achievement also has implications for global energy markets. The country’s success in making solar with battery storage cheaper than conventional power serves as a model for other nations pursuing similar energy transitions. As the cost of renewable technologies continues to decline, other countries can leverage these advancements to enhance their own energy systems, reduce carbon emissions, and achieve energy independence amid over 30% of global electricity now from renewables trends worldwide.

The impact of this development extends beyond economics. It represents a significant step forward in addressing climate change and promoting sustainability. By reducing the cost of renewable energy technologies, Germany is accelerating the shift towards a cleaner and more resilient energy system. This progress aligns with the country’s ambitious climate goals and reinforces its role as a leader in global efforts to combat climate change.

Looking ahead, several challenges remain. The integration of renewable energy into existing energy infrastructure, grid stability, and the management of energy storage are all areas that require continued innovation and investment. However, the decreasing cost of solar power with battery storage provides a strong foundation for addressing these challenges and advancing the transition to a sustainable energy future.

In conclusion, the fact that solar power with battery storage in Germany has become cheaper than conventional power is a groundbreaking development with wide-ranging implications. It underscores the technological advancements, economic benefits, and environmental gains associated with renewable energy technologies. As Germany continues to lead the way in clean energy adoption, this achievement highlights the potential for renewable energy to drive global change and reshape the future of energy.


Related News

View more

UK EV Drivers Demand Fairer Vehicle Taxes

UK EV Per-Mile Taxes are reshaping road pricing and vehicle taxation for electric cars, raising fairness concerns, climate policy questions, and funding needs for infrastructure and charging networks across the country.


Key Points

They are per-mile road charges on EVs to fund infrastructure, raising fairness, emissions, and vehicle taxation concerns.

✅ Propose tax relief or credits for EV owners

✅ Consider emission-based road user charging

✅ Invest in charging networks and road infrastructure


As the UK continues its push towards a greener future with increased adoption of electric vehicles (EVs) and surging EV interest during supply disruptions, a growing number of electric car drivers are voicing their frustration over the current tax system. The debate centers around the per-mile vehicle taxes that are being proposed and implemented, which many argue are unfairly burdensome on EV owners. This issue has sparked a broader campaign advocating for a more equitable approach to vehicle taxation, one that reflects the evolving landscape of transportation and environmental policy.

Rising Costs for Electric Car Owners

Electric vehicles have been hailed as a crucial component in the UK’s strategy to reduce carbon emissions and combat climate change. Government incentives, such as grants for EV purchases and tax breaks, have been instrumental in encouraging the shift from petrol and diesel cars to cleaner alternatives, even as affordability concerns persist among many UK consumers. However, as the number of electric vehicles on the road grows, the financial dynamics of vehicle taxation are coming under scrutiny.

One of the key issues is the introduction and increase of per-mile vehicle taxes. While these taxes are designed to account for road usage and infrastructure costs, they have been met with resistance from EV drivers who argue that they are being disproportionately affected. Unlike traditional combustion engine vehicles, electric cars typically have lower running costs compared to petrol or diesel models and, in many cases, benefit from lower or zero emissions. Yet, the current tax system does not always reflect these advantages.

The Taxation Debate

The crux of the debate lies in how vehicle taxes are structured and implemented. Per-mile taxes are intended to ensure that all road users contribute fairly to the maintenance of transport infrastructure. However, the implementation of such taxes has raised concerns about fairness and affordability, particularly for those who have invested heavily in electric vehicles.

Critics argue that per-mile taxes do not adequately take into account the environmental benefits of driving an electric car, noting that the net impact depends on the electricity generation mix in each market. While EV owners are contributing to a cleaner environment by reducing emissions, they are also facing higher taxes that could undermine the financial benefits of their greener choice. This has led to calls for a reassessment of the tax system to ensure that it aligns with the UK’s climate goals and provides a fair deal for electric vehicle drivers.

Campaigns for Fairer Taxation

In response to these concerns, several advocacy groups and individual EV owners have launched campaigns calling for a more balanced approach to vehicle taxation. These campaigns emphasize the need for a system that supports the transition to electric vehicles and recognizes their role in reducing environmental impact, drawing on ambitious EV targets abroad as useful benchmarks.

Key proposals from these campaigns include:

  1. Tax Relief for EV Owners: Advocates suggest providing targeted tax relief for electric vehicle owners to offset the costs of per-mile taxes. This could include subsidies or tax credits that acknowledge the environmental benefits of EVs and help to make up for higher road usage fees.

  2. Emission-Based Taxation: An alternative approach is to design vehicle taxes based on emissions rather than mileage. This system would ensure that those driving high-emission vehicles contribute more to road maintenance, while EV owners, who are already reducing emissions, are not penalized.

  3. Infrastructure Investments: Campaigners also call for increased investments in infrastructure that supports electric vehicles, such as charging networks and proper grid management practices that balance load. This would help to address concerns about the adequacy of current road maintenance and support the growing number of EVs on the road.

Government Response and Future Directions

The UK government faces the challenge of balancing revenue needs with environmental goals. While there is recognition of the need to update the tax system in light of increasing EV adoption, there is also a focus on ensuring that any changes are equitable and do not disincentivize the shift towards cleaner vehicles, while considering whether the UK grid can handle additional EV demand reliably.

Discussions are ongoing about how to best implement changes that address the concerns of electric vehicle owners while ensuring that the transportation infrastructure remains adequately funded. The outcome of these discussions will be critical in shaping the future of vehicle taxation in the UK and supporting the country’s broader environmental objectives.

Conclusion

As electric vehicle adoption continues to rise in the UK, the debate over vehicle taxation becomes increasingly important. The campaign for fairer per-mile taxes highlights the need for a tax system that supports the transition to cleaner transportation while also being fair to those who have made environmentally conscious choices. Balancing these factors will be key to achieving the UK’s climate goals and ensuring that all road users contribute equitably to the maintenance of transport infrastructure. The ongoing dialogue and policy adjustments will play a crucial role in shaping a sustainable and just future for transportation in the UK.


Related News

View more

Vancouver's Reversal on Gas Appliances

Vancouver Natural Gas Ban Reversal spotlights energy policy, electrification tradeoffs, heat pumps, emissions, grid reliability, and affordability, reshaping building codes and decarbonization pathways while inviting stakeholders to weigh practical constraints and climate goals.


Key Points

Vancouver ending its ban on natural gas in new homes to balance climate goals with reliability, costs, and technology.

✅ Balances emissions goals with reliability and affordability

✅ Impacts builders, homeowners, and energy infrastructure

✅ Spurs debate on electrification, heat pumps, and grid capacity


In a significant policy shift, Vancouver has decided to lift its ban on natural gas appliances in new homes, a move that marks a pivotal moment in the city's energy policy and environmental strategy. This decision, announced recently and following the city's Clean Energy Champion recognition for Bloedel upgrades, has sparked a broader conversation about the future of energy systems and the balance between environmental goals and practical energy needs. Stewart Muir, CEO of Resource Works, argues that this reversal should catalyze a necessary dialogue on energy choices, highlighting both the benefits and challenges of such a policy change.

Vancouver's original ban on natural gas appliances was part of a broader initiative aimed at reducing greenhouse gas emissions and promoting sustainability, including progress toward phasing out fossil fuels where feasible over time. The city had adopted stringent regulations to encourage the use of electric heat pumps and other low-carbon technologies in new residential buildings. This move was aligned with Vancouver’s ambitious climate goals, which include achieving carbon neutrality by 2050 and significantly cutting down on fossil fuel use.

However, the recent decision to reverse the ban reflects a growing recognition of the complexities involved in transitioning to entirely new energy systems. The city's administration acknowledged that while electric alternatives offer environmental benefits, they also come with challenges that can affect homeowners, builders, and the broader energy infrastructure, including options for bridging the electricity gap with Alberta to enhance regional reliability.

Stewart Muir argues that Vancouver’s policy shift is not just about natural gas appliances but represents a larger conversation about energy system choices and their implications. He suggests that the reversal of the ban provides an opportunity to address key issues related to energy reliability, affordability, and the practicalities of integrating new technologies, including electrified LNG options for industry within the province into existing systems.

One of the primary reasons behind the reversal is the recognition of the practical limitations and costs associated with transitioning to electric-only systems. For many homeowners and builders, natural gas appliances have long been a reliable and cost-effective option. The initial ban on these appliances led to concerns about increased construction costs and potential disruptions for homeowners who were accustomed to natural gas heating and cooking.

In addition to cost considerations, there are concerns about the reliability and efficiency of electric alternatives. Natural gas has been praised for its stable energy supply and efficient performance, especially in colder climates where electric heating systems might struggle to maintain consistent temperatures or fully utilize Site C's electricity under peak demand. By reversing the ban, Vancouver acknowledges that a one-size-fits-all approach may not be suitable for every situation, particularly when considering diverse housing needs and energy demands.

Muir emphasizes that the reversal of the ban should prompt a broader discussion about how to balance environmental goals with practical energy needs. He argues that rather than enforcing a blanket ban on specific technologies, it is crucial to explore a range of solutions that can effectively address climate objectives while accommodating the diverse requirements of different communities and households.

The debate also touches on the role of technological innovation in achieving sustainability goals. As energy technologies continue to evolve, renewable electricity is coming on strong and new solutions and advancements could potentially offer more efficient and environmentally friendly alternatives. The conversation should include exploring these innovations and considering how they can be integrated into existing energy systems to support long-term sustainability.

Moreover, Muir advocates for a more inclusive approach to energy policy that involves engaging various stakeholders, including residents, businesses, and energy experts. A collaborative approach can help identify practical solutions that address both environmental concerns and the realities of everyday energy use.

In the broader context, Vancouver’s decision reflects a growing trend in cities and regions grappling with energy transitions. Many urban centers are evaluating their energy policies and considering adjustments based on new information and emerging technologies. The key is to find a balance that supports climate goals such as 2050 greenhouse gas targets while ensuring that energy systems remain reliable, affordable, and adaptable to changing needs.

As Vancouver moves forward with its revised policy, it will be important to monitor the outcomes and assess the impacts on both the environment and the community. The reversal of the natural gas ban could serve as a case study for other cities facing similar challenges and could provide valuable insights into how to navigate the complexities of energy transitions.

In conclusion, Vancouver’s decision to reverse its ban on natural gas appliances in new homes is a significant development that opens the door for a critical dialogue about energy system choices. Stewart Muir’s call for a broader conversation emphasizes the need to balance environmental ambitions with practical considerations, such as cost, reliability, and technological advancements. As cities continue to navigate their energy futures, finding a pragmatic and inclusive approach will be essential in achieving both sustainability and functionality in energy systems.


Related News

View more

During this Pandemic, Save Money - How To Better Understand Your Electricity Bill

Commercial Electric Tariffs explain utility rate structures, peak demand charges, kWh vs kW pricing, time-of-use periods, voltage, delivery, capacity ratchets, and riders, guiding facility managers in tariff analysis for accurate energy savings.


Key Points

Commercial electric tariffs define utility pricing for energy, demand, delivery, time-of-use periods, riders, and ratchet charges.

✅ Separate kWh charges from kW peak demand fees.

✅ Verify time-of-use windows and demand interval length.

✅ Review riders, capacity ratchets, and minimum demand clauses.


Especially during these tough economic times, as major changes to electric bills are debated in some states, facility executives who don’t understand how their power is priced have been disappointed when their energy projects failed to produce expected dollar savings. Here’s how not to be one of them.

Your electric rate is spelled out in a document called a “tariff” that can be downloaded from your utility’s web page. A tariff should clearly spell out the costs for each component that is part of your rate, reflecting cost allocation practices in your region. Don’t be surprised to learn that it contains a bunch of them. Unlike residential electric rates, commercial electric bills are not based solely on the quantity of kilowatt-hours (kWh) consumed in a billing period (in the United States, that’s a month). Instead, different rates may apply to how your power is supplied, how it is delivered via electricity delivery charges, when it was consumed, its voltage, how fast it was used (in kW), and other factors.

If a tariff’s lingo and word structure are too opaque, spend some time with a utility account rep to translate it. Many state utility commissions also have customer advocates that may assist as they explore new utility rate designs that affect customers. Alternatively, for a fee, facility managers can privately chat with an energy consultant.

Common mistakes

Many facility managers try to estimate savings based on an averaged electric rate, i.e., annual electric spend divided by annual kWh. However, in markets where electricity demand is flat, such a number may obscure the fastest rising cost component: monthly peak demand charges, measured in dollars per kW (or kilo-volt-amperes, kVA).

This charge is like a monthly speeding ticket, based solely on the highest speed you drove during that time. In some areas, peak demand charges now account for 30 to 60 percent of a facility’s annual electric spend. When projecting energy cost savings, failing to separately account for kW peak demand and kWh consumption may result in erroneous results, and a lot of questions from the C-suite.

How peak demand charges are calculated varies among utilities. Some base it on the highest average speed of use across one hour in a month, while others may use the highest average speed during a 15- or 30-minute period. Others may average several of the highest speeds within a defined time period (for example, 8 a.m. to 6 p.m. on weekdays). It is whatever your tariff says it is.

Because some power-consuming (or producing) devices, including those tied to smart home electricity networks, vary in their operation or abilities, they may save money on a few — but not all — of those rate components. If an equipment vendor calculates savings from its product by using an average electric rate, take pause. Tell the vendor to return after the proposal has been redone using tariff-based numbers.

When a vendor is the only person calculating potential savings from using a product, there’s also a built-in conflict of interest: The person profiting from an equipment sale should not also be the one calculating its expected financial return. Before signing any energy project contracts, it’s essential that someone independent of the deal reviews projected savings. That person (typically an energy or engineering consultant) should be quite familiar with your facility’s electric tariff, including any special provisions, riders, discounts, etc., that may pertain. When this doesn’t happen, savings often don’t occur as planned. 

For example, some utilities add another form of demand charge, based on the highest kW in a year. It has various names: capacity, contract demand, or the generic term “ratchet charge.” Some utilities also have a minimum ratchet charge which may be based on a percent of a facility’s annual kW peak. It ensures collection of sufficient utility revenue to cover the cost of installed transmission and distribution even when a customer significantly cuts its peak demand.


Related News

View more

Sign Up for Electricity Forum’s Newsletter

Stay informed with our FREE Newsletter — get the latest news, breakthrough technologies, and expert insights, delivered straight to your inbox.

Electricity Today T&D Magazine Subscribe for FREE

Stay informed with the latest T&D policies and technologies.
  • Timely insights from industry experts
  • Practical solutions T&D engineers
  • Free access to every issue

Download the 2025 Electrical Training Catalog

Explore 50+ live, expert-led electrical training courses –

  • Interactive
  • Flexible
  • CEU-cerified