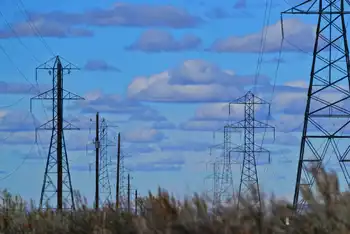
El Paso customers to get refund

By El Paso Times


Protective Relay Training - Basic

Our customized live online or in‑person group training can be delivered to your staff at your location.

  • Live Online
  • 12 hours Instructor-led
  • Group Training Available
Regular Price:
$699
Coupon Price:
$599
Reserve Your Seat Today
The low cost of natural gas will bring El Paso Electric customers a small windfall on their electric bills soon.

El Paso Electric asked the Texas Public Utility Commission to approve a $12 million refund to its El Paso-area customers for overpaid fuel charges.

That means residential customers will get refunds averaging $14 on their October bills, if the state commission approves the request by September 24, El Paso Electric officials said. The company received support from the El Paso City Council for the refund.

Most commercial customers also will receive a refund, but El Paso Electric officials had no average refund amount for them.

The company collected too much money under a fuel charge it set in October 2008, just as natural gas prices began to decrease, said David Carpenter, El Paso Electric chief financial officer. The fuel charge, which can be adjusted three times a year under state regulations, was decreased in August.

Under state regulations, the company is required to refund over-collected fuel charges when the charges total 4 percent of the company's fuel expenses for 12 months, Carpenter said.

Terry Hadley, a spokes man for the Texas Public Utility Commission, said that the commission staff has to verify El Paso Electric's refund numbers, but that this type of case usually moves quickly.

The other three regulated electric utilities in Texas are also are to have fuel charge refunds this year, Hadley said. For most of the state, which has a competitive electric retail market with limited state regulations, the price of natural gas, now at a seven-year low, will mean the lowest electricity prices seen in several years, the commission noted in a news release.

Natural gas is the largest source of fuel to generate electricity in Texas, the commission reported.

El Paso Electric has three natural-gas-fueled power plants in El Paso, and also buys electricity generated from natural gas on the open market. About half the utility's power comes from the Palo Verde nuclear power plant in Arizona.

El Paso Electric residential customers will receive a refund of 2.8 cents per kilowatt-hour of electricity charged on their October bills. Small commercial customers will get a refund of 7 cents per kilowatt-hour of electricity, and most commercial customers will get a refund of 2.25 cents per kilowatt-hour of electricity.

If the company's refund request is delayed, the company will move the refund to November bills, Carpenter said.

Related News

OPINION | Bridging the electricity gap between Alberta and B.C. makes perfect climate sense

BC-Alberta Transmission Intertie enables clean hydro to balance wind and solar, expanding transmission capacity so Site C hydro can dispatch power, cut emissions, lower costs, and accelerate electrification across provincial grids under federal climate policy.


Key Points

A cross-provincial grid link using BC hydro to firm Alberta wind and solar, cutting emissions and costs.

✅ Balances variable renewables with dispatchable hydro from Site C.

✅ Enables power trade: peak exports, low-cost wind imports.

✅ Lowers decarbonization costs and supports electrification goals.


By Mark Jaccard

Lost in the news and noise of the federal government's newly announced $170-per-tonne carbon tax was a single, critical sentence in Canada's updated climate plan, one that signals a strategy that could serve as the cornerstone for a future free of greenhouse gas emissions.

"The government will work with provinces and territories to connect parts of Canada that have abundant clean hydroelectricity with parts that are currently more dependent on fossil fuels for electricity generation — including by advancing strategic intertie projects."

Why do we think this one sentence is so important? And what has it got to do with the controversial Site C project Site C electricity debate under construction in British Columbia?

The answer lies in the huge amount of electricity we'll need to generate in Canada to achieve our climate goals for 2030 and 2050. Even while we aggressively pursue energy efficiency, our electric cars, buses and perhaps trucks in Canada's net-zero race will need a huge amount of new electricity, as will our buildings and industries. 

Luckily, Canada is blessed with an electricity system that is the envy of the world — already over 80 per cent zero emission, the bulk being from flexible hydro-electricity, with a backbone of nuclear power largely in Ontario, a national electricity success and rapidly growing shares of cheap wind and solar. 

Provincial differences
Yet the story differs significantly from one province to another. While B.C.'s electricity is nearly emissions free, the opposite is true of its neighbour, Alberta, where more than 80 per cent still comes from fossil fuels. This, despite an impressive shift away from coal power in recent years.

Now imagine if B.C. and Alberta were one province.

This might sound like the start of a bad joke, or a horror movie to some, but it's the crux of new research by a trio of energy economists who put a fine point on the value of such co-operation.

The study, by Brett Dolter, Kent Fellows and Nic Rivers, takes a detailed look at the economic case for completing Site C, BC Hydro's controversial large hydro project under construction, and makes three key conclusions.

First, they argue Site C should likely not have been started in the first place. Only a narrow set of assumptions can now justify its total cost. But what's done is done, and absent a time machine, the decision to complete the dam rests on go-forward costs.

On that note, their second conclusion is no more optimistic. Considering the cost to complete the project, even accounting for avoiding termination costs should it be cancelled, they find the economics of completing Site C over-budget status to be weak. If the New York Times had a Site C needle in the style of the newspaper's election visual, it would be "leaning cancel" at this point.

In Alberta, more than 80 per cent of the electricity still comes from fossil fuels, despite an impressive shift away from coal power in recent years. (CBC)
But it is their third conclusion that stands out as worthy of attention. They argue there is a case for completing Site C if the following conditions are met:

B.C. and Alberta reduce their electricity sector emissions by more than 75 per cent (this really means Alberta, given B.C.'s already clean position); and

B.C. and Alberta expand their ability to move electricity between their respective provinces by building new transmission lines.

Let's deal with each of these in turn.

On Condition 1, we give an emphatic: YES! Reducing electricity emissions is an absolute must to meet climate pledges if Canada is to come even close to achieving its net-zero goals. As noted above, a clean electricity grid will be the cornerstone of a decarbonized economy as we generate a great deal more power to electrify everything from industrial processes to heating to transportation and more. 

Condition 2 is more challenging. Talk of increasing transmission connections across Canada, including Hydro-Québec's U.S. strategy has been ongoing for over 50 years, with little success to speak of. But this time might well be different. And the implications for a completed Site C, should the government go that route, are profound.

Wind and solar costs rapidly declining
Somewhat ironically, the case for Site C is made stronger by the rapidly declining costs of two of its apparent renewable competitors: wind and solar.

The cost of wind and solar generation has fallen by 70 per cent and 90 per cent, respectively, a dramatic decline in the past 10 years. No longer can these variable sources of power be derided as high cost; they are unequivocally the cheapest sources of raw energy in electricity systems today.

However, electricity system operators must deal with their "non-dispatchability," a seemingly complicated term that simply means they produce electricity only when the sun shines and the wind blows, which is not necessarily when electricity customers want their electricity delivered (dispatched) to them. And because of this characteristic, the value of dispatchable electricity sources, like a completed Site C, will grow as a complement to wind and solar. 

Thus, as Alberta's generation of cheap wind and solar grows, so too does the value of connecting it with the firm, dispatchable resources available in B.C.

Rather than displacing wind and solar, large hydro facilities with the ability to increase or decrease output on short notice can actually enable more investment in these renewable sources. Expanding the transmission connection, with Site C on one side of that line, becomes even more valuable.

Many in B.C. might read this and rightly ask themselves, why should we foot the bill for this costly project to help out Albertans? The answer is that it won't be charity — B.C. will get paid handsomely for the power it delivers in peak periods and will be able to import wind power at low prices from Alberta in other times. B.C. will benefit greatly from these gains of trade.

Turning to Alberta, why should Albertans support B.C. reaping these gains? The answer is two-fold.

First, Site C will actually enable more low-cost wind and solar to be built in Alberta due to hydro's ability to balance these non-dispatchable renewables. Jobs and economic opportunity will occur in Alberta from this renewable energy growth.

Second, while B.C. imports won't come cheap, they will be less costly than the decarbonization alternatives Alberta would need without B.C.'s flexible hydro, as the economists' study shows. This means lower overall costs to Alberta's power consumers.

A clear role for Ottawa
To be sure, there are challenges to increasing the connectedness of B.C. and Alberta's power systems, not least of which is BC Hydro being a regulated, government-owned monopoly while Alberta is a competitive market amongst private generators. Some significant accommodations in climate policy and grids will be needed to ensure both sides can compete and benefit from trade on an equal footing.

There is also the pesky matter of permitting and constructing thousands of kilometres of power lines. Getting linear energy infrastructure built in Canada has not exactly been our forte of late.

We are not naive to the significant challenges in such an approach, but it's not often that we see such a clear narrative for beneficial climate action that, when considered at the provincial level, is likely to be thwarted, but when considered more broadly can produce a big win.

It's the clearest example yet of a role for the federal government to bridge the gap, to facilitate the needed regulatory conversations, and, let's be frank, to bring money to the table to make the line happen. Neither provincial side is likely to do it on their own, nor, as history has shown, are they likely to do it together. 

For a government committed to reducing emissions, and with a justified emphasis on the electricity sector, the opportunity to expand the Alberta-B.C. transmission intertie, leveraging the flexibility of B.C.'s hydro with the abundance of wind and solar potential on the Prairies, offers a potential massive decarbonization win for Western Canada that is too good to ignore.


Mark Jaccard, a professor at Simon Fraser University, and Blake Shaffer, a professor at the University of Calgary


Related News

View more

NRC Makes Available Turkey Point Renewal Application

Turkey Point Subsequent License Renewal seeks NRC approval for FP&L to extend Units 3 and 4, three-loop pressurized water reactors near Homestead, Miami; public review, docketing, and an Atomic Safety and Licensing Board hearing.


Key Points

The NRC is reviewing FP&L's request to extend Turkey Point Units 3 and 4 operating licenses by 20 years.

✅ NRC will docket if application is complete

✅ Public review and opportunity for adjudicatory hearing

✅ Units commissioned in 1972 and 1973, near Miami


The U.S. Nuclear Regulatory Commission said Thursday that it had made available the first-ever "subsequent license renewal application," amid milestones at nuclear power projects worldwide, which came from Florida Power and Light and applies to the company's Turkey Point Nuclear Generating Station's Units 3 and 4.

The Nuclear Regulatory Commission recently made available for public review the first-ever subsequent license renewal application, which Florida Power & Light Company submitted on Jan. 1.

In the application, FP&L requests an additional 20 years for the operating licenses of Turkey Point Nuclear Generating Units 3 and 4, three-loop, pressurized water reactors located in Homestead, Florida, where the Florida PSC recently approved a municipal solid waste energy purchase, approximately 40 miles south of Miami.

The NRC approved the initial license renewal in June 2002, as new reactors at Georgia's Vogtle plant continue to take shape nationwide. Unit 3 is currently licensed to operate through July 19, 2032. Unit 4 is licensed to operate through April 10, 2033.

#google#

NRC staff is currently reviewing the application, while a new U.S. reactor has recently started up, underscoring broader industry momentum. If the staff determines the application is complete, they will docket it and publish a notice of opportunity to request an adjudicatory hearing before the NRC’s Atomic Safety and Licensing Board.

The first-ever subsequent license renewal application, submitted by Florida Power & Light Company asks for an additional 20 years for the already-renewed operating licenses of Turkey Point, even as India moves to revive its nuclear program internationally, which are currently set to expire in July of 2032 and April of 2033. The two thee-loop, pressurized water reactors, located about 40 miles south of Miami, were commissioned in July 1972 and April 1973.

If the application is determined to be complete, the staff will docket it and publish a notice of opportunity to request an adjudicatory hearing before the NRC’s Atomic Safety and Licensing Board, the agency said.

The application is available for public review on the NRC website. Copies of the application will be available at the Homestead Branch Library in Homestead, the Naraja Branch Library in Homestead and the South Dade Regional Library in Miami.


Related News

View more

Germany's Energy Crisis Deepens as Local Utilities Cry for Help

Germany energy liquidity crisis is straining municipal utilities as gas and power prices surge, margin calls rise, and Russian supply cuts bite, forcing state support, interventions, and emergency financing to stabilize households and businesses.


Key Points

A cash squeeze on German municipal utilities as soaring gas and power prices trigger margin calls and funding gaps.

✅ Margin calls and spot-market purchases strain cash flow

✅ State liquidity lines and EU collateral support proposed

✅ Gazprom cuts, Uniper distress heighten default risks


Germany’s fears that soaring power prices and gas prices could trigger a deeper crisis is starting to get real. 

Several hundred local utilities are coming under strain and need support, according to the head of Germany’s largest energy lobby group. The companies, generally owned by municipalities, supply households and small businesses directly and are a key part of the country’s power and gas network.

“The next step from the government and federal states must be to secure liquidity for these municipal companies,” Kerstin Andreae, chairwoman of the German Association of Energy and Water Industries, told Bloomberg in Berlin. “Prices are rising, and they have no more money to pay the suppliers. This is a big problem.”

Germany’s energy crunch intensified over the weekend after Russia’s Gazprom PJSC halted its key gas pipeline indefinitely, a stark wake-up call for policymakers to reduce fossil fuel dependence. European energy prices have surged again amid concerns over shortages this winter and fears of a worst-case energy scenario across the bloc. 

Many utilities are running into financial issues as they’re forced to cover missing Russian deliveries with expensive supplies on the spot market. German energy giant Uniper SE, which supplies local utilities, warned it will likely burn through a 7 billion-euro ($7 billion) government safety net and will need more help already this month.

Some German local utilities have already sought help, according to a government official, who asked not to be identified in line with briefing rules.  

With Europe’s largest economy already bracing for recession, Chancellor Olaf Scholz’s administration is battling on several fronts, testing the government’s financial capacity. The ruling coalition agreed Sunday on a relief plan worth about 65 billion euros -- part of an emerging energy shield package to contain the fallout of surging costs for households and businesses. 

Starting in October, local utilities will have to pay a levy for the gas acquired, which will further increase their financial burden, Andreae said.

Margin Calls
European gas prices are more than four times higher than usual for this time of year, underscoring why rolling back electricity prices is tougher than it appears for policymakers, as Russia cuts supplies in retaliation for sanctions related to its invasion of Ukraine. When prices peak, energy companies have to pay margin calls, extra collateral required to back their trades.

Read more: Energy Trade Risks Collapsing Over Margin Calls of $1.5 Trillion

The problem has hit local utilities in other countries as well. In Austria, the government approved a 2 billion-euro loan for Vienna’s municipal utility last month. 

The European Union is also planning help, floating gas price cap strategies among other tools. The bloc’s emergency measures will include support for electricity producers struggling to find enough cash to guarantee trades, according to European Commission President Ursula von der Leyen.

The situation has worsened in Germany as some of the country’s big gas importers are reluctant to sell more supplies to some of municipal companies amid fears they could default on payments, Andreae said. 


Related News

View more

Toronto Prepares for a Surge in Electricity Demand as City Continues to Grow

Toronto Electricity Demand Growth underscores IESO projections of rising peak load by 2050, driven by population growth, electrification, new housing density, and tech economy, requiring grid modernization, transmission upgrades, demand response, and local renewable energy.


Key Points

It refers to the projected near-doubling of Toronto's peak load by 2050, driven by electrification and urban growth.

✅ IESO projects peak demand nearly doubling by 2050

✅ Drivers: population, densification, EVs, heat pumps

✅ Solutions: efficiency, transmission, storage, demand response


Toronto faces a significant challenge in meeting the growing electricity needs of its expanding population and ambitious development plans. According to a new report from Ontario's Independent Electricity System Operator (IESO), Toronto's peak electricity demand is expected to nearly double by 2050. This highlights the need for proactive steps to secure adequate electricity supply amidst the city's ongoing economic and population growth.


Key Factors Driving Demand

Several factors are contributing to the projected increase in electricity demand:

Population Growth: Toronto is one of the fastest-growing cities in North America, and this trend is expected to continue. More residents mean more need for housing, businesses, and other electricity-consuming infrastructure.

  • New Homes and Density: The city's housing strategy calls for 285,000 new homes within the next decade, including significant densification in existing neighbourhoods. High-rise buildings in urban centers are generally more energy-intensive than low-rise residential developments.
  • Economic Development: Toronto's robust economy, a hub for tech and innovation, attracts new businesses, including energy-intensive AI data centers that fuel further demand for electricity.
  • Electrification: The push to reduce carbon emissions is driving the electrification of transportation and home heating, further increasing pressure on Toronto's electricity grid.


Planning for the Future

Ontario and the City of Toronto recognize the urgency to secure stable and reliable electricity supplies to support continued growth and prosperity without sacrificing affordability, drawing lessons from British Columbia's clean energy shift to inform local approaches. Officials are collaborating to develop a long-term plan that focuses on:

  • Energy Efficiency: Efforts aim to reduce wasteful electricity usage through upgrades to existing buildings, promoting energy-efficient appliances, and implementing smart grid technologies. These will play a crucial role in curbing overall demand.
  • New Infrastructure: Significant investments in building new electricity generation, transmission lines, and substations, as well as regional macrogrids to enhance reliability, will be necessary to meet the projected demands of Toronto's future.
  • Demand Management: Programs incentivizing energy conservation during peak hours will help to avoid strain on the grid and reduce the need to build expensive power plants only used at peak demand times.


Challenges Ahead

The path ahead isn't without its hurdles.  Building new power infrastructure in a dense urban environment like Toronto can be time-consuming, expensive, and sometimes disruptive, especially as grids face harsh weather risks that complicate construction and operations. Residents and businesses might worry about potential rate increases required to fund these necessary investments.


Opportunity for Innovation

The IESO and the city view the situation as an opportunity to embrace innovative solutions. Exploring renewable energy sources within and near the city, developing local energy storage systems, and promoting distributed energy generation such as rooftop solar, where power is created near the point of use, are all vital strategies for meeting needs in a sustainable way.

Toronto's electricity future depends heavily on proactive planning and investment in modernizing its power infrastructure.  The decisions made now will determine whether the city can support economic growth, address climate goals and a net-zero grid by 2050 ambition, and ensure that lights stay on for all Torontonians as the city continues to expand.


Related News

View more

COVID-19 closures: It's as if Ottawa has fallen off the electricity grid

Ontario Electricity Demand Drop During COVID-19 reflects a 1,000-2,000 MW decline as IESO balances the grid, shifts peak demand later, throttles generators and baseload nuclear, and manages exports amid changing load curves.


Key Points

An about 10% reduction in Ontario's load, shifting peaks and requiring IESO grid balancing measures.

✅ Demand down 1,000-2,000 MW; roughly 10% below normal.

✅ Peak shifts later in morning as home use rises.

✅ IESO throttles generators; baseload nuclear stays online.


It’s as if the COVID-19 epidemic had tripped a circuit breaker, shutting off all power to a city the size of Ottawa.

Virus-induced restrictions that have shut down large swaths of normal commercial life across Canada has led to a noticeable drop in demand for power in Ontario and reflect a global demand dip according to reports, insiders said on Friday.

Terry Young, vice-president with the Independent Electricity System Operator, said planning was underway for further declines in usage and for whether Ontario will embrace more clean power in the long term, given the delicate balance that needs to be maintained between supply and demand.

“We’re now seeing demand that is running about 1,000 to 2,000 megawatts less than we would normally see,” Young said. “You’re essentially seeing a city the size of Ottawa drop off demand during the day.”

At the high end, a 2,000 megawatt reduction would be close to the equivalent peak demand of Ottawa and London, Ont., combined.

The decline, in the order of 10 per cent from the 17,000 to 18,000 megawatts of usage that might normally be expected and similar to the UK’s 10% drop reported during lockdowns, began last week, Young said. The downward trend became more noticeable as governments and health authorities ordered non-essential businesses to close and people to stay home. However, residential and hospital usage has climbed.

Experts say frequent hand-washing and staying away from others is the most effective way to curb the spread of the highly contagious coronavirus, which poses a special risk to older people and those with underlying health conditions. As a result, factories and other big users have reduced production or closed entirely.

Because electricity cannot be stored, generators need to throttle back their output as domestic demand shrinks and exports to places such as the United States, including New York City, which is also being hit hard by the coronavirus, fall.

“We’re watching this carefully,” Young said. “We’re able to manage this drop, but it’s something we obviously have to keep watching…and making sure we’re not over-generating electricity.”

Turning off generation, especially for nuclear plants, is an intensive process, as are restarts and would likely happen only if the downward demand trend intensifies significantly, amid concerns over Ontario’s electricity getting dirtier if baseload is displaced. However, one of North America’s largest generators, Bruce Power near Kincardine, Ont., said it had a large degree of flexibility to scale down or up.

“We have the ability to provide one-third of our output as a dynamic response, which is unique to our facility,” said James Scongack, an executive vice-president with Bruce Power. “We developed this coming out of the 2008 downturn and it’s been a critical system asset for the last decade.”

“We don’t see there being a scenario where our baseload will not be needed,” he said, even as some warn Ontario may be short of electricity in the coming years.

The province’s publicly owned Ontario Power Generation said it was also in conversations with the system operator, which provides direction to generators, and is often cited in the Ontario election discussion.

One clear shift in normal work-day usage with so many people staying at home has been the change in demand patterns. Typically, Young said, there’s a peak from about 7 a.m. to 8 a.m. as people wake and get ready to go to work or school. The peak is now occurring later in the morning, Young said.


Related News

View more

UK low-carbon electricity generation stalls in 2019

UK low-carbon electricity 2019 saw stalled growth as renewables rose slightly, wind expanded, nuclear output fell, coal hit record lows, and net-zero targets demand faster deployment to cut CO2 intensity below 100gCO2/kWh.


Key Points

Low-carbon sources supplied 54% of UK power in 2019, up just 1TWh; wind grew, nuclear fell, and coal dropped to 2%.

✅ Wind up 8TWh; nuclear down 9TWh amid outages

✅ Fossil fuels 43% of generation; coal at 2%

✅ Net-zero needs 15TWh per year added to 2030


The amount of electricity generated by low-carbon sources in the UK stalled in 2019, Carbon Brief analysis shows.

Low-carbon electricity output from wind, solar, nuclear, hydro and biomass rose by just 1 terawatt hour (TWh, less than 1%) in 2019. It represents the smallest annual increase in a decade, where annual growth averaged 9TWh. This growth will need to double in the 2020s to meet UK climate targets while replacing old nuclear plants as they retire.

Some 54% of UK electricity generation in 2019 came from low-carbon sources, including 37% from renewables and 20% from wind alone, underscoring wind's leading role in the power mix during key periods. A record-low 43% was from fossil fuels, with 41% from gas and just 2% from coal, also a record low. In 2010, fossil fuels generated 75% of the total.

Carbon Brief’s analysis of UK electricity generation in 2019 is based on figures from BM Reports and the Department for Business, Energy and Industrial Strategy (BEIS). See the methodology at the end for more on how the analysis was conducted.

The numbers differ from those published earlier in January by National Grid, which were for electricity supplied in Great Britain only (England, Wales and Scotland, but excluding Northern Ireland), including via imports from other countries.

Low-carbon low
In 2019, the UK became the first major economy to target net-zero greenhouse gas emissions by 2050, increasing the ambition of its legally binding Climate Change Act.

To date, the country has cut its emissions by around two-fifths since 1990, with almost all of its recent progress coming from the electricity sector.

Emissions from electricity generation have fallen rapidly in the decade since 2010 as coal power has been almost phased out and even gas output has declined. Fossil fuels have been displaced by falling demand and by renewables, such as wind, solar and biomass.

But Carbon Brief’s annual analysis of UK electricity generation shows progress stalled in 2019, with the output from low-carbon sources barely increasing compared to a year earlier.

The chart below shows low-carbon generation in each year since 2010 (grey bars) and the estimated level in 2019 (red). The pale grey bars show the estimated future output of existing low-carbon sources after old nuclear plants retire and the pale red bars show the amount of new generation needed to keep electricity sector emissions to less than 100 grammes of CO2 per kilowatt hour (gCO2/kWh), the UK’s nominal target for the sector.

 Annual electricity generation in the UK by fuel, terawatt hours, 2010-2019. Top panel: fuel by fuel. Bottom panel: cumulative total generation from all sources. Source: BEIS energy trends, BM Reports and Carbon Brief analysis. Chart by Carbon Brief using Highcharts.
As the chart shows, the UK will require significantly more low-carbon electricity over the next decade as part of meeting its legally binding climate goals.

The nominal 100gCO2/kWh target for 2030 was set in the context of the UK’s less ambitious goal of cutting emissions to 80% below 1990 levels by 2050. Now that the country is aiming to cut emissions to net-zero by 2050, that 100gCO2/kWh indicator is likely to be the bare minimum.

Even so, it would require a rapid step up in the pace of low-carbon expansion, compared to the increases seen over the past decade. On average, low-carbon generation has risen by 9TWh each year in the decade since 2010 – including a rise of just 1TWh in 2019.

Given scheduled nuclear retirements and rising demand expected by the Committee on Climate Change (CCC) – with some electrification of transport and heating – low-carbon generation would need to increase by 15TWh each year until 2030, just to meet the benchmark of 100gCO2/kWh.

For context, the 3.2 gigawatt (GW) Hinkley C new nuclear plant being built in Somerset will generate around 25TWh once completed around 2026. The world’s largest offshore windfarm, the 1.2GW Hornsea One scheme off the Yorkshire coast, will generate around 5TWh each year.

The new Conservative government is targeting 40GW of offshore wind by 2030, up from today’s figure of around 8GW. If policies are put in place to meet this goal, then it could keep power sector emissions below 100gCO2/kWh, depending on the actual performance of the windfarms built.

However, new onshore wind and solar, further new nuclear or other low-carbon generation, such as gas with carbon capture and storage (CCS), is likely to be needed if demand is higher than expected, or if the 100gCO2/kWh benchmark is too weak in the context of net-zero by 2050.

The CCC says it is “likely” to “reflect the need for more rapid deployment” of low-carbon towards net-zero emissions in its advice on the sixth UK carbon budget for 2033-2037, due in September.

Trading places
Looking more closely at UK electricity generation in 2019, Carbon Brief’s analysis shows why there was so little growth for low-carbon sources compared to the previous year.

There was another increase for wind power in 2019 (up 8TWh, 14%), with record wind generation as several large new windfarms were completed including the 1.2GW Hornsea One project in October and the 0.6GW Beatrice offshore windfarm in Q2 of 2019. But this was offset by a decline for nuclear (down 9TWh, 14%), due to ongoing outages for reactors at Hunterston in Scotland and Dungeness in Kent.

(Analysis of data held by trade organisation RenewableUK suggests some 0.6GW of onshore wind capacity also started operating in 2019, including the 0.2GW Dorenell scheme in Moray, Scotland.)

As a result of these movements, the UK’s windfarms overtook nuclear for the first time ever in 2019, becoming the country’s second-largest source of electricity generation, and earlier, wind and solar together surpassed nuclear in the UK as momentum built. This is shown in the figure below, with wind (green line, top panel) trading places with nuclear (purple) and gas (dark blue) down around 25% since 2010 but remaining the single-largest source.

 Annual electricity generation in the UK by fuel, terawatt hours, 2010-2019. Top panel: fuel by fuel. Bottom panel: cumulative total generation from all sources. Source: BEIS energy trends, BM Reports and Carbon Brief analysis. Chart by Carbon Brief using Highcharts.
The UK’s currently suspended nuclear plants are due to return to service in January and March, according to operator EDF, the French state-backed utility firm. However, as noted above, most of the UK’s nuclear fleet is set to retire during the 2020s, with only Sizewell B in Suffolk due to still be operating by 2030. Hunterston is scheduled to retire by 2023 and Dungeness by 2028.

Set against these losses, the UK has a pipeline of offshore windfarms, secured via “contracts for difference” with the government, at a series of auctions. The most recent auction, in September 2019, saw prices below £40 per megawatt hour – similar to current wholesale electricity prices.

However, the capacity contracted so far is not sufficient to meet the government’s target of 40GW by 2030, meaning further auctions – or some other policy mechanism – will be required.

Coal zero
As well as the switch between wind and nuclear, 2019 also saw coal fall below solar for the first time across a full year, echoing the 2016 moment when wind outgenerated coal across the UK, after it suffered another 60% reduction in electricity output. Just six coal plants remain in the UK, with Aberthaw B in Wales and Fiddlers Ferry in Cheshire closing in March.

Coal accounted for just 2% of UK generation in 2019, a record-low coal share since centralised electricity supplies started to operate in 1882. The fuel met 40% of UK needs as recently as 2012, but has plummeted thanks to falling demand, rising renewables, cheaper gas and higher CO2 prices.

The reduction in average coal generation hides the fact that the fuel is now often not required at all to meet the UK’s electricity needs. The chart below shows the number of days each year when coal output was zero in 2019 (red line) and the two previous years (blue).

 Cumulative number of days when UK electricity generation from renewable sources has been higher than that from fossil fuels. Source: BEIS energy trends, BM Reports and Carbon Brief analysis. Chart by Carbon Brief using Highcharts.
The 83 days in 2019 with zero coal generation amount to nearly a quarter of the year and include the record-breaking 18-day stretch without the fuel.

Great Britain has been running for a record TWO WEEKS without using coal to generate electricity – the first time this has happened since 1882.

The country’s grid has been coal-free for 45% of hours in 2019 so far.https://www.carbonbrief.org/countdown-to-2025-tracking-the-uk-coal-phase-out …

Coal generation was set for significant reductions around the world in 2019 – including a 20% reduction for the EU as a whole – according to analysis published by Carbon Brief in November.

Notably, overall UK electricity generation fell by another 9TWh in 2019 (3%), bringing the total decline to 58TWh since 2010. This is equivalent to more than twice the output from the Hinkley C scheme being built in Somerset. As Carbon Brief explained last year, falling demand has had a similar impact on electricity-sector CO2 emissions as the increase in output from renewables.

This is illustrated by the fact that the 9TWh reduction in overall generation translated into a 9TWh (6%) cut in fossil-fuel generation during 2019, with coal falling by 10TWh and gas rising marginally.

Increasingly renewable
As fossil-fuel output and overall generation have declined, the UK’s renewable sources of electricity have continued to increase. Their output has risen nearly five-fold in the past decade and their share of the UK total has increased from 7% in 2010 to 37% in 2019.

As a result, the UK’s increasingly renewable grid is seeing more minutes, hours and days during which the likes of wind, solar and biomass collectively outpace all fossil fuels put together, and on some days wind is the main source as well.

The chart below shows the number of days during each year when renewables generated more electricity than fossil fuels in 2019 (red line) and each of the previous four years (blue lines). In total, nearly two-fifths of days in 2019 crossed this threshold.

 Cumulative number of days when the UK has not generated any electricity from coal. Source: BEIS energy trends, BM Reports and Carbon Brief analysis. Chart by Carbon Brief using Highcharts.
There were also four months in 2019 when renewables generated more of the UK’s electricity than fossil fuels: March, August, September and December. The first ever such month came in September 2018 and more are certain to follow.

National Grid, which manages Great Britain’s high-voltage electricity transmission network, is aiming to be able to run the system without fossil fuels by 2025, at least for short periods. At present, it sometimes has to ask windfarm operators to switch off and gas plants to start running in order to keep the electricity grid stable.

Note that biomass accounted for 11% of UK electricity generation in 2019, nearly a third of the total from all renewables. Some two-thirds of the biomass output is from “plant biomass”, primarily wood pellets burnt at Lynemouth in Northumberland and the Drax plant in Yorkshire. The remainder was from an array of smaller sites based on landfill gas, sewage gas or anaerobic digestion.

The CCC says the UK should “move away” from large-scale biomass power plants, once existing subsidy contracts for Drax and Lynemouth expire in 2027.

Using biomass to generate electricity is not zero-carbon and in some circumstances could lead to higher emissions than from fossil fuels. Moreover, there are more valuable uses for the world’s limited supply of biomass feedstock, the CCC says, including carbon sequestration and hard-to-abate sectors with few alternatives.

Methodology
The figures in the article are from Carbon Brief analysis of data from BEIS Energy Trends chapter 5 and chapter 6, as well as from BM Reports. The figures from BM Reports are for electricity supplied to the grid in Great Britain only and are adjusted to include Northern Ireland.

In Carbon Brief’s analysis, the BM Reports numbers are also adjusted to account for electricity used by power plants on site and for generation by plants not connected to the high-voltage national grid. This includes many onshore windfarms, as well as industrial gas combined heat and power plants and those burning landfill gas, waste or sewage gas.

By design, the Carbon Brief analysis is intended to align as closely as possible to the official government figures on electricity generated in the UK, reported in BEIS Energy Trends table 5.1.

Briefly, the raw data for each fuel is in most cases adjusted with a multiplier, derived from the ratio between the reported BEIS numbers and unadjusted figures for previous quarters.

Carbon Brief’s method of analysis has been verified against published BEIS figures using “hindcasting”. This shows the estimates for total electricity generation from fossil fuels or renewables to have been within ±3% of the BEIS number in each quarter since Q4 2017. (Data before then is not sufficient to carry out the Carbon Brief analysis.)

For example, in the second quarter of 2019, a Carbon Brief hindcast estimates gas generation at 33.1TWh, whereas the published BEIS figure was 34.0TWh. Similarly, it produces an estimate of 27.4TWh for renewables, against a BEIS figure of 27.1TWh.

National Grid recently shared its own analysis for electricity in Great Britain during 2019 via its energy dashboard, which differs from Carbon Brief’s figures.


Related News

View more

Sign Up for Electricity Forum’s Newsletter

Stay informed with our FREE Newsletter — get the latest news, breakthrough technologies, and expert insights, delivered straight to your inbox.

Electricity Today T&D Magazine Subscribe for FREE

Stay informed with the latest T&D policies and technologies.
  • Timely insights from industry experts
  • Practical solutions T&D engineers
  • Free access to every issue

Download the 2025 Electrical Training Catalog

Explore 50+ live, expert-led electrical training courses –

  • Interactive
  • Flexible
  • CEU-cerified