Alberta-BC Pipeline Dispute centers on Trans Mountain expansion, diluted bitumen shipments, federal approval, spill response capacity, and electricity trade, as Alberta suspends power talks and Ottawa insists the Kinder Morgan project proceeds in national interest.
Key Points
Dispute over Trans Mountain expansion, bitumen limits, and jurisdiction between Alberta, B.C., and Canada.
✅ Alberta suspends BC electricity talks as leverage
✅ Ottawa affirms federal approval and spill response
✅ BC plans advisory panel on diluted bitumen risks
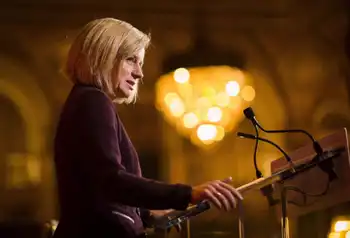
Alberta Premier Rachel Notley says her government is suspending talks with British Columbia on the purchase of electricity from the western province.
It’s the first step in Alberta’s fight against the B.C. government’s proposal to obstruct the Kinder Morgan oil pipeline expansion project by banning increased shipments of diluted bitumen to the province’s coast.
Up to $500 million annually for B.C.’s coffers from electricity exports hangs in the balance, Notley said.
“We’re prepared to do what it takes to get this pipeline built — whatever it takes,” she told a news conference Thursday after speaking with Prime Minister Justin Trudeau on the phone.
Notley said she told Trudeau, who’s in Edmonton for a town-hall meeting, that the federal government needs to act decisively to end the dispute.
Speaking on Edmonton talk radio station CHED earlier in the day, Trudeau said the pipeline expansion is in the national interest and will go ahead, even as the federal government undertakes a study on electrification across sectors.
“That pipeline is going to get built,” Trudeau said. “We will stand by our decision. We will ensure that the Kinder Morgan pipeline gets built.”
B.C.’s environment minister has said his minority government plans to ban increased shipments until it can determine that shippers are prepared and able to properly clean up a spill, and, separately, has implemented an electricity rate freeze affecting consumers. He said he will establish an independent scientific advisory panel to study the issue.
The move infuriated Notley, who has accused B.C. of trying to change the rules after the federal government gave the project the green light. B.C. has the right to regulate how any spills would be cleaned up, but can’t dictate what flows through pipelines, she said.
Trudeau said Canada needs to get Alberta’s oil safely to markets other than the U.S. energy market today. He said the federal government did the research and has spent billions on spill response.
“The Kinder Morgan pipeline is not a danger to the B.C. coast,” he said.
Notley said she thanked Trudeau for his assurance that the project will go ahead, but the federal government has to do more to ensure the pipeline’s expansion.
“This is not an Alberta-B.C. issue. This is a Canada-B.C. issue,” she said. “This kind of uncertainty is bad for investment and bad for working people
“Enough is enough. We need to get these things built.”
B.C. Premier John Horgan said his government consulted Alberta and Ottawa about his province’s intentions, noting that Columbia River Treaty talks also shape regional electricity policy.
“I don’t see what the problem is,” Horgan said Thursday at a school opening north of Kelowna, B.C. “It’s within our jurisdiction to put in place regulations to protect the public interest.
“That’s what we are doing.”
He downplayed any possibility of court action or sanctions by Alberta.
“There’s nothing to take to court,” Horgan said. “We are consulting with the people of B.C. It’s way too premature to talk about those sorts of issues.
“Sabre-rattling doesn’t get you very far.”
Speaking in Ottawa, Natural Resources Minister Jim Carr wouldn’t say what Canada might do if British Columbia implements its regulation.
“That’s speculative,” said Carr.
He noted at this point, B.C. has just pledged to consult. He said the federal government heard from thousands of people before the pipeline was approved.
“That’s what they have announced — an intention to consult. We have already consulted.”
B.C.’s proposal creates more uncertainty for Kinder Morgan’s already-delayed Trans Mountain expansion project that would nearly triple the capacity of its pipeline system to 890,000 barrels a day.
Related News