Closing coal plant cuts child development problems

By International Herald Tribune


CSA Z463 Electrical Maintenance

Our customized live online or in‑person group training can be delivered to your staff at your location.

  • Live Online
  • 6 hours Instructor-led
  • Group Training Available
Regular Price:
$249
Coupon Price:
$199
Reserve Your Seat Today
Children born after the closure of a coal-burning plant in China had 60 percent fewer developmental problems, a new study says, giving ammunition to those who argue the country should embrace cleaner sources of energy.

The study in the peer-reviewed Environmental Health Perspectives journal found that after the coal plant was shut in the midwestern city of Tongliang, pregnant mothers living in the area had far less exposure to pollutants and their children showed significantly fewer delays in developing motor skills such as muscle coordination by the age of 2.

"This study provides direct evidence that the Chinese government's action to shut down a polluting power plant had measurable benefits on the development of children," said Frederica Perera, lead author of the study and the director of the Columbia Center for Children's Environmental Health in New York.

"These findings have major implications for environmental health and energy policy in China and elsewhere," she said.

The study tested the development of two groups of about 100 children, one group born before the Tongliang coal plant's closure in 2004 and the other born after it was shut.

Barbara Finamore, director of the Natural Resources Defense Council's China program whose group helped researchers identify a site, said she was hopeful the findings would persuade authorities to weigh the affordability of coal against the health costs.

"Coal is much cheaper than the alternatives. But when you factor in the cost of coal to children's health, it changes the equation," Finamore said. "With the one-child policy, children are one of China's most precious resources. They cannot afford to be raising a new generation of children with serious developmental difficulties."

China introduced rules in the late 1970s that limit many couples to only one child.

But Peter D. Sly, who heads the World Health Organization's Collaborating Center for Research on Children's Environmental Health and is based in Australia, was more cautious.

He said it was an "interesting study" that shows how reducing exposure to pollutants during gestation can improve health outcomes for children, especially brain development. But he said the results do not have implications for "modern, coal-fired power stations" in China.

The Tongliang coal plant did not have pollution control equipment to limit the emission of toxins that typically include carbon dioxide, sulfur dioxide, nitrogen oxide and particulate matter.

"My personal opinion is that modern power stations may be better, but we don't know how much better," said Sly, who was not part of the study. "These data are not strong enough to call for closing all coal-fired power stations but do suggest the need for studies to examine the potential health effects of modern, so-called, clean power stations."

China relies on coal for three-quarters of its electricity and has been slow to switch to cleaner options such as wind, solar and hydropower.

While it has fueled the country's economic boom, the burning of coal has caused widespread air pollution in China, contributed to worsening acid rain and helped make the country the world's top emitter of carbon dioxide and other heat-trapping gases blamed for global warming.

The study found that mothers living near the coal-fired plant breathed in polycyclic aromatic hydrocarbons, which are produced when coal is burned and were passed onto their babies through the mother's placenta. Researchers tested the levels of polycyclic aromatic hydrocarbons in the fetal umbilical cord blood of the children in the two groups.

Researchers found the group that was born after the power plant closed had 40 percent lower levels of the contaminant in the cord blood and a 60 percent reduction in the frequency of "delayed motor development."

Development delays typically reflect that a child is not meeting certain benchmarks for his age, for example a 2-year-old who is not yet climbing stairs well or grasping objects securely, researchers said.

All the women in the study were nonsmokers and exposure to secondhand smoke and lead was carefully measured and recorded to ensure it did not affect the findings, the researchers said.

"The government action of shutting down a polluting plant allowed us to do something we couldn't do before," said Perera, who collaborated with Columbia colleague Deliang Tang, Tin-yu Li of the Children's Hospital of Chongqing Medical University as well as other Chinese scientists.

"In the past, almost all research has evaluated the adverse effects of pollution," she said. "This in a very real sense is a good news story."

The China research builds on ongoing work conducted by Perera and her team which found reduced fetal growth in babies born to mothers from coal-burning regions of Poland who were exposed to PAH. A separate study the group did in New York City also found that mothers exposed to more of the contaminant were likely to have children who scored lower on mental development tests.

Related News

Solar PV and wind power in the US continue to grow amid favourable government plans

US Renewable Power Outlook 2030 projects surging capacity, solar PV and wind growth, grid modernization, and favorable tax credits, detailing market trends, CAGR, transmission expansion, and policy drivers shaping clean energy generation and consumption.


Key Points

A forecast of US power capacity, generation, and consumption, highlighting solar, wind, tax credits, and grid modernization.

✅ Targets 48.4% renewable capacity share by 2030

✅ Strong growth in solar PV and onshore wind installations

✅ Investment and tax credits drive grid and transmission upgrades


GlobalData’s latest report, ‘United States Power Market Outlook to 2030, Update 2021 – Market Trends, Regulations, and Competitive Landscape’ discusses the power market structure of the United States and provides historical and forecast numbers for capacity, generation and consumption up to 2030. Detailed analysis of the country’s power market regulatory structure, competitive landscape and a list of major power plants are provided. The report also gives a snapshot of the power sector in the country on broad parameters of macroeconomics, supply security, generation infrastructure, transmission and distribution infrastructure, about a quarter of U.S. electricity from renewables in recent years, electricity import and export scenario, degree of competition, regulatory scenario, and future potential. An analysis of the deals in the country’s power sector is also included in the report.

Renewable power held a 19% share of the US’s total power capacity in 2020, and in that year renewables became the second-most prevalent source in the U.S. electricity mix by generation; this share is expected to increase significantly to 48.4% by 2030. Favourable policies introduced by the US Government will continue to drive the country’s renewable sector, particularly solar photovoltaics (PV) and wind power, with wind now the most-used renewable source in the U.S. generation mix. Installed renewable capacity* increased from 16.5GW in 2000 to 239.2GW in 2020, growing at a compound annual growth rate (CAGR) of 14.3%. By 2030, the cumulative renewable capacity is expected to rise to 884.6GW, growing at a CAGR of 14% from 2020 to 2030. Despite increase in prices of renewable equipment, such as solar modules, in 2021, the US renewable sector will show strong growth during the 2021 to 2030 period as this increase in equipment prices are short term due to supply chain disruptions caused by the Covid-19 pandemic.

The expansion of renewable power capacity during the 2000 to 2020 period has been possible due to the introduction of federal schemes, such as Production Tax Credits, Investment Tax Credits and Manufacturing Tax Credits. These have massively aided renewable installations by bringing down the cost of renewable power generation and making it at par with power generated from conventional sources. Over the last few years, the cost of solar PV and wind power installations has declined sharply, and by 2023 wind, solar, and batteries made up most of the utility-scale pipeline across the US, highlighting investor confidence. Since 2010, the cost of utility-scale solar PV projects decreased by around 82% while onshore wind installations decreased by around 39%. This has supported the rapid expansion of the renewable market. However, the price of solar equipment has risen due to an increase in raw material prices and supply shortages. This may slightly delay the financing of some solar projects that are already in the pipeline.

The US will continue to add significant renewable capacity additions during the forecast period as industry outlooks point to record solar and storage installations over the coming years, to meet its target of reaching 80% clean energy by 2030. In November 2021, President Biden signed a $1tr Infrastructure Bill, within which $73bn is designated to renewables. This includes not just renewable capacity building, but also strengthening the country’s power grid and laying new high voltage transmission lines, both of which will be key to driving solar and wind power capacity additions as wind power surges in the U.S. electricity mix nationwide.

The US was one of the worst hit countries in the world due to the Covid-19 pandemic in 2020. With respect to the power sector, the electricity consumption in the country declined by 2.5% in 2020 as compared to 2019, even as renewable electricity surpassed coal in 2022 in the generation mix, highlighting continued structural change. Power plants that were under construction faced delays due to unavailability of components due to supply chain disruptions and unavailability of labour due to travel restrictions.

According to the US Energy Information Administration, 61 power projects, having a total capacity of 2.4GWm which were under construction during March and April 2020 were delayed because of the Covid-19 pandemic. Among renewable power technologies, solar PV and wind power projects were the most badly affected due to the pandemic.

In March and April 2020, 53 solar PV projects, having a total capacity of 1.3GW, and wind power projects, having a total capacity of 1.2GW, were delayed due to the Covid-19 pandemic. Moreover, several states suspended renewable energy auctions due to the pandemic.

For instance, New York State Energy Research and Development Authority (NYSERDA) had issued a new offshore wind solicitation for 1GW and up to 2.5GW in April 2020, but this was suspended due to the Covid-19 pandemic. In July 2020, the authority relaunched the tender for 2.5GW of offshore wind capacity, with a submission deadline in October 2020.

To ease the financial burden on consumers during the pandemic, more than 1,000 utilities in the country announced disconnection moratoria and implemented flexible payment plans. Duke Energy, American Electric Power, Dominion Power and Southern California Edison were among the major utilities that voluntarily suspended disconnections.


Related News

View more

IEA warns fall in global energy investment may lead to shortages

Global Energy Investment Decline risks future oil and electricity supply, says the IEA, as spending on upstream, coal plants, and grids falls while renewables, storage, and flexible generation lag in the energy transition.


Key Points

Multi-year cuts to oil, power, and grid spending that increase risks of future supply shortages and market tightness.

✅ IEA warns underinvestment risks oil supply squeeze

✅ China and India slow coal plant additions; renewables rise

✅ Batteries aid flexibility but cannot replace seasonal storage


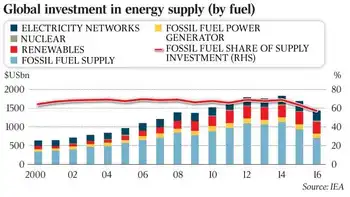
An almost 20 per cent fall in global energy investment over the past three years could lead to oil and electricity shortages, as surging electricity demand persists, and there are concerns about whether current business models will encourage sufficient levels of spending in the future, according a new report.

The International Energy Agency’s second annual IEA benchmark analysis of energy investment found that while the world spent $US1.7 trillion ($2.2 trillion) on fossil-fuel exploration, new power plants and upgrades to electricity grids last year, with electricity investment surpassing oil and gas even as global energy investment was down 12 per cent from a year earlier and 17 per cent lower than 2014.

While the IEA said continued oversupply of oil and electricity globally would prevent any imminent shock, falling investment “points to a risk of market tightness and undercapacity at some point down the line’’.

The low crude oil price drove a 44 per cent drop in oil and gas investment between 2014 and 2016. It fell 26 per cent last year. It was due to falls in upstream activity and a slowdown in the sanctioning of conventional oilfields to the lowest level in more than 70 years.

“Given the depletion of existing fields, the pace of investment in conventional fields will need to rise to avoid a supply squeeze, even on optimistic assumptions about technology and the impact of climate policies on oil demand,’’ the IEA warned in its report released yesterday evening. “The energy transition has barely begun in several key sectors, such as transport and industry, which will continue to rely heavily on oil, gas and coal for the foreseeable future.’’

The fall in global energy spending also reflected declining investment in power generation, particularly from coal plants.

While 21 per cent of global ­energy investment was made by China in 2016, the world’s fastest growing economy had a 25 per cent decline in the commissioning of new coal-fired power plants, due largely to air pollution issues and investment in renewables.

Investment in new coal-fired plants also fell in India.

“India and China have slammed the brakes on coal-fired generation. That is the big change we have seen globally,’’ said ­Bruce Mountain a director at CME Australia.

“What it confirms is the ­pressures and the changes we are seeing in Australia, the restructuring of our energy supply, is just part of a global trend. We are facing the pressures more sharply in Australia because our power prices are very high. But that same shift in energy source in Australia are being mirrored internationally.’’ The IEA — a Paris-based adviser to the OECD on energy policy — also highlighted Australia’s reduced power reserves in its report and called for regulatory change to encourage greater use of renewables.

“Australia has one of the highest proportions of households with PV systems on their roof of any country in the world, and its ­electricity use in its National ­Electricity Market is spread out over a huge and weakly connected network,’’ the report said.

“It appears that a series of accompanying investments and regulatory changes are needed, including a plan to avoid supply threats, to use Australia’s abundant wind and solar potential: changing system operation methods and reliability procedures as well as investment into network capacity, flexible generation and storage.’’ The report found that in Australia there had been an increase in grid-scale installations mostly associated with large-scale solar PV plants.

Last month the Turnbull ­government revealed it was prepared to back the construction of new coal-fired power stations to prevent further shortfalls in electricity supplies, while the PM ruled out taxpayer-funded plants and declared it was open to using “clean coal” technology to replace existing generators.

He also pledged “immediate” ­action to boost the supply of gas by forcing exporters to divert ­production into the domestic ­market.

Since then technology billionaire Elon Musk has promised to solve South Australia’s energy ­issues by building the world’s largest lithium-ion battery in the state.

But the IEA report said batteries were unlikely to become a “one size fits all” single solution to ­electricity security and flexibility provision.

“While batteries are well-suited to frequency control and shifting hourly load, they cannot provide seasonal storage or substitute the full range of technical services that conventional plants provide to stabilise the system,’’ the report said.

“In the absence of a major technological breakthrough, it is most likely that batteries will complement rather than substitute ­conventional means of providing system flexibility. While conventional plants continue to provide essential system services, their business model is increasingly being called into question in ­unbundled systems.’’


Related News

View more

Why California's Climate Policies Are Causing Electricity Blackouts

California Rolling Blackouts expose grid reliability risks amid a heatwave, as CAISO curtails power while solar output fades at sunset, wind stalls, and scarce natural gas and nuclear capacity plus PG&E issues strain imports.


Key Points

Grid outages during heatwaves from low reserves, fading solar, weak wind, and limited firm capacity.

✅ Heatwave demand rose as solar output dropped at sunset

✅ Limited imports and gas, nuclear shortfalls cut reserves

✅ Policy, pricing, and maintenance gaps increased outage risk


Millions of Californians were denied electrical power and thus air conditioning during a heatwave, raising the risk of heatstroke and death, particularly among the elderly and sick. 

The blackouts come at a time when people, particularly the elderly, are forced to remain indoors due to Covid-19, and as later heat waves would test the grid again statewide.

At first, the state’s electrical grid operator last night asked customers to voluntarily reduce electricity use. But after lapses in power supply pushed reserves to dangerous levels it declared a “Stage 3 emergency” cutting off power to people across the state at 6:30 pm.

The immediate reason for the black-outs was the failure of a 500-megawatt power plant and an out-of-service 750-megawatt unit not being available. “There is nothing nefarious going on here,” said a spokeswoman for California Independent System Operator (CAISO). “We are just trying to run the grid.”

But the underlying reasons that California is experiencing rolling black-outs for the second time in less than a year stem from the state’s climate policies, which California policymakers have justified as necessary to prevent deaths from heatwaves, and which it is increasingly exporting to Western states as a model.

In October, Pacific Gas and Electric cut off power to homes across California to avoid starting forest fires after reports that its power lines may have started fires in recent seasons. The utility and California’s leaders had over the previous decade diverted billions meant for grid maintenance to renewables. 

And yesterday, California had to impose rolling blackouts because it had failed to maintain sufficient reliable power from natural gas and nuclear plants, or pay in advance for enough guaranteed electricity imports from other states.

It may be that California’s utilities and their regulator, the California Public Utilities Commission, which is also controlled by Gov. Newsom, didn’t want to spend the extra money to guarantee the additional electricity out of fears of raising California’s electricity prices even more than they had already raised them.

California saw its electricity prices rise six times more than the rest of the United States from 2011 to 2019, helping explain why electricity prices are soaring across the state, due to its huge expansion of renewables. Republicans in the U.S. Congress point to that massive increase to challenge justifications by Democrats to spend $2 trillion on renewables in the name of climate change.

Even though the cost of solar panels declined dramatically between 2011 and 2019, their unreliable and weather-dependent nature meant that they imposed large new costs in the form of storage and transmission to keep electricity as reliable. California’s solar panels and farms were all turning off as the blackouts began, with no help available from the states to the East already in nightfall.

Electricity from solar goes away at the very moment when the demand for electricity rises. “The peak demand was steady in late hours,” said the spokesperson for CAISO, which is controlled by Gov. Gavin Newsom, “and we had thousands of megawatts of solar reducing their output as the sunset.”

The two blackouts in less than a year are strong evidence that the tens of billions that Californians have spent on renewables come with high human, economic, and environmental costs.

Last December, a report by done for PG&E concluded that the utility’s customers could see blackouts double over the next 15 years and quadruple over the next 30.

California’s anti-nuclear policies also contributed to the blackouts. In 2013, Gov. Jerry Brown forced a nuclear power plant, San Onofre, in southern California to close.

Had San Onofre still been operating, there almost certainly would not have been blackouts on Friday as the reserve margin would have been significantly larger. The capacity of San Onofre was double that of the lost generation capacity that triggered the blackout.

California's current and former large nuclear plants are located on the coast, which allows for their electricity to travel shorter distances, and through less-constrained transmission lines than the state’s industrial solar farms, to get to the coastal cities where electricity is in highest demand.

There has been very little electricity from wind during the summer heatwave in California and the broader western U.S., further driving up demand. In fact, the same weather pattern, a stable high-pressure bubble, is the cause of heatwaves, since it brought very low wind for days on end along with very high temperatures.

Things won’t be any better, and may be worse, in the winter, with a looming shortage as it produces far less solar electricity than the summer. Solar plus storage, an expensive attempt to fix problems like what led to this blackout, cannot help through long winters of low output.

California’s electricity prices will continue to rise if it continues to add more renewables to its grid, and goes forward with plans to shut down its last nuclear plant, Diablo Canyon, in 2025.

Had California spent an estimated $100 billion on nuclear instead of on wind and solar, it would have had enough energy to replace all fossil fuels in its in-state electricity mix.

To manage the increasingly unreliable grid, California will either need to keep its nuclear plant operating, build more natural gas plants, underscoring its reliance on fossil fuels for reliability, or pay ever more money annually to reserve emergency electricity supplies from its neighbors.

After the blackouts last October, Gov. Newsom attacked PG&E Corp. for “greed and mismanagement” and named a top aide, Ana Matosantos, to be his “energy czar.” 

“This is not the new normal, and this does not take 10 years to solve,” Newsom said. “The entire system needs to be reimagined.”


Related News

View more

Roads Need More Electricity: They Will Make It Themselves

Electrically Smart Roads integrate solar road surfaces, inductive charging, IoT sensors, AI analytics, and V2X to power lighting, deicing, and monitoring, reducing grid dependence while enabling dynamic EV charging and real-time traffic management.


Key Points

Electrically smart roads generate power, sense conditions, and charge EVs using solar, IoT, AI, and dynamic infrastructure.

✅ Solar surfaces, verges, and gantries generate on-site electricity

✅ Inductive lanes enable dynamic EV charging at highway speeds

✅ Embedded IoT sensors and AI deliver real-time traffic insights


As more and more capabilities are added to roads instead of simply covering a country with extra roads, they are starting to make their own electricity, notably as solar road surface but then with added silent wind turbines, photovoltaic verges and barriers and more.

That toll gate, street light and traffic monitoring system all need electricity. Later, roads that deice and charge vehicles at speed will need huge amounts of electricity. For now, electricity for road systems is provided by very expensive infrastructure to the grid, and grid flexibility for EVs remains a concern, except for a few solar/ wind street lights in China and Korea for example. However, as more and more capabilities are added to roads instead of simply covering a country with extra roads, they are starting to make their own electricity, notably as solar road surface but then with added silent wind turbines, photovoltaic verges and barriers and more. There is also highly speculative work in the USA and UK on garnering power from road surface movement using piezoelectrics and electrodynamics and even its heat. 

#google#

China plans to create an intelligent transport system by 2030. The country hopes to build smart roads that will not only be able to charge electric cars as they drive but also monitor temperature, traffic flow and weight load using artificial intelligence. Indeed, like France, the Netherlands and the USA, where U.S. EV charging capacity is under scrutiny, it already has trials of extended lengths of solar road which cost no more than regular roads. In an alternative approach, vehicles go under tunnels of solar panels that also support lighting, light-emitting signage and monitoring equipment using the electricity made where it is needed. See the IDTechEx Research report, Electrically Smart Roads 2018-2028 for more.

Raghu Das, CEO of IDTechEx says, "The spiral vertical axis wind turbines VAWT in Asia rarely rotate because they are too low but much higher versions are planned on large UK roadside vehicle charging centres that should work well. H shaped VAWT is also gaining traction - much slower and quieter than the propeller shape which vibrates and keeps you awake at night in an urban area.

The price gap between the ubiquitous polycrystalline silicon solar cell and the much more efficient single crystal silicon is narrowing. That means that road furniture such as bus shelters and smart gantries will likely go for more solar rather than adding wind power in many cases, a shift mirrored by connected solar tech in homes, because wind power needs a lot of maintenance and its price is not dropping as rapidly."

The IDTechEx Research report, Off Grid Electric Vehicle Charging: Zero Emission 2018-2028 analyses that aspect, while vehicle-to-grid strategies may complement grid resources. The prototype of a smart road is already in place on an expressway outside of Jinan, providing better traffic updates as well as more accurate mapping. Verizon's IoT division has launched a project around intelligent asphalt, which it thinks has the potential to significantly reduce fossil fuel emissions and save time by reducing up to 44% of traffic backups. It has partnered with Sacramento, California, to test this theory.

"By embedding sensors into the pavement as well as installing cameras on traffic lights, we will be able to study and analyze the flow of traffic. Then, we will take all of that data and use it to optimize the timing of lights so that traffic flows easier and travel times are shorter," explains Sean Harrington, vice president of Verizon Smart Communities.

Colorado's Department of Transportation has recently announced its intention to be the first state to pilot smart roads by striking a five-year deal with a smart road company to test the technology. Like planned auto-deicing roads elsewhere, the aim of this project is, first and foremost, to save lives. The technology will detect when a car suddenly leaves a road and send emergency assistance to the area. The IDTechEx Research report Electrically Smart Roads 2018-2028 describes how others work on real time structural monitoring of roads and embedded interactive lighting and road surface signage.

"Smart pavement can make that determination and send that information directly into a vehicle," Peter Kozinski, director of CDOT's RoadX division, tells the Denver Post. "Data is the new asphalt of transportation."   Sensors, processors and other technology are embedded in the Colorado road to extend capability beyond accidents and reach into better road maintenance. Fast adoption relies on the ability to rapidly install sensor-laden pavement or lay concrete slabs. Attention therefore turns to fast adaptation of existing roads. Indeed, even for the heavy coil arrays used for dynamic vehicle charging, even as state power grids face new challenges, in Israel there are machines that can retrofit into the road surface at a remarkable two kilometres of cut and insert in a day.

"It's hard to imagine that these things are inexpensive, with all the electronics in them," Charles Schwartz, a professor of civil and environmental engineering at the University of Maryland, tells the Denver Post concerning the vehicle sensing project, "but CDOT is a fairly sophisticated agency, and this is an interesting pilot project. We can learn a lot, even if the test is only partially successful."


Related News

View more

Here are 3 ways to find out where your electricity comes from

US energy mix shows how the electric grid blends renewables, fossil fuels, nuclear, and hydro, varying by ISO/RTO markets, utilities, and state policies, affecting carbon emissions, pricing, reliability, and access.


Key Points

The US energy mix is the grid's source breakdown by region: fossil fuels, renewables, nuclear, and hydro.

✅ Check ISO or RTO dashboards for real-time generation by fuel source.

✅ Utilities may offer green power plans or RECs at modest premiums.

✅ Energy mix shifts with policy, pricing, and grid reliability needs.


There are few resources more important than energy. Sure, you may die if you don't eat for days. But your phone will die if you go too long without charging it. Energy feeds tech, the internet, city infrastructure, refrigerators, lights, and has evolved throughout U.S. history in profound ways. You get the idea. Yet unlike our other common needs, such as food, energy sources aren't exactly front of mind for most people. 

"I think a lot of people don't put a lot of bandwidth into thinking about this part of their lives," said Richard McMahon, the SVP of energy supply and finance at Edison Electric Institute, a trade group that represents investor-owned electric companies in the US. 

It makes sense. For most Americans, electricity is always there, and in many locations, there's not much of a choice involved, even as electricity demand is flat across the U.S. today. You sign up with a utility when you move into a new residence and pay your bills when they're due. 

But there's an important reality that indifference eschews: In 2018, a third of the energy-related carbon-dioxide emissions in the US came from the electric power sector, according to the US Energy Information Administration (EIA). 

A good chunk of that is from the residential sector, which consistently uses more energy than commercial customers, per EIA data.

Just as many people exercise choice when they eat, you typically also have a choice when it comes to your energy supply. That's not to say your current offering isn't what you want, or that switching will be easy or affordable, but "if you're a customer and want power with a certain attribute," McMahon said, "you can pretty much get it wherever you are." 

But first, you need to know the energy mix you have right now. As it turns out, it's not so straightforward. At all.

This brief guide may help. 

For some utility providers, you can find out if it publishes the energy mix online. Dominion Energy, which serves Idaho, North Carolina, Ohio, South Carolina, Utah, Virginia, West Virginia, and Wyoming, provides this information in a colored graphic. 

"Once you figure out who your utility is you can figure out what mix of resources they use," said Heidi Ratz, an electricity markets researcher at the World Resources Institute.

But not all utilities publish this information.

It has to do with their role in the grid and reflects utility industry trends in structure and markets. Some utility companies are vertically integrated; they generate power through nuclear plants or wind farms and distribute those electrons directly to their customers. Other utilities just distribute the power that different companies produce. 

Consider Consolidated Edison, or Con Ed, which distributes energy to parts of New York City. While reporting this story, Business Insider could not find information about the utility's energy mix online. When reached for comment, a spokesperson said, "we're indifferent to where it comes from."

That's because, in New York, distribution utilities like Con Ed often buy energy through a wholesale marketplace.

Take a look at this map. If you live in one of the colored regions, your electricity is sold on a wholesale market regulated by an organization called a regional transmission organization (RTO) or independent system operator (ISO). Distribution utilities like Con Ed often buy their energy through these markets, based on availability and cost, while raising questions about future utility revenue models as prices shift. 

Still, it's pretty easy to figure out where your energy comes from. Just look up the ISO or RTO website (such as NYISO or CAISO). Usually, these organizations will provide energy supply information in near-real time. 

That's exactly what Con Edison (which buys energy on the NYISO marketplace) suggested. As of Friday morning, roughly 40% of the energy on the market place was natural gas or other fossil fuels, 34% was nuclear, and about 22% was hydro. 

If you live in another region governed by an ISO or RTO, such as in most of California, you can do the same thing. Like NYISO, CAISO has a dashboard that shows (again, as of Friday morning) about 36% of the energy on the market comes from natural gas and more than 20% comes from renewables. 

In the map linked above, you'll notice that some of the ISOs and RTOs like MISO encompass enormous regions. That means that even if you figure out where the energy in your market comes from, it's not going to be geographically specific. But there are a couple of ways to drill down even further. 

The Environmental Protection Agency has a straightforward tool called Power Profiler. You can enter your zip code to see the fuel mix in your area. But it's not perfect. The data are from 2016 and, in some regions of the country like the upper Midwest, they aren't much more localized, and some import dirty electricity due to regional trading. 

The World Resources Institute also has a tool that allows you to see the electricity mix by state, based on 2017 data from EIA. These numbers represent power generation, not the electricity actually flowing into your sockets, but they offer a rough idea of what energy resources are operating in your state. 

One option is to check with your utility to see if it has a "green power" offering. Over 600 utilities across the country have one, according to the Climate Reality Project, though they often come at a slightly higher cost. It's typically on the scale of just a few more cents per kilowatt-hour. 

There are also independent, consumer-facing companies like Arcadia and Green Mountain Energy that allow you to source renewable energy, by virtually connecting you to community solar projects or purchasing Renewable Energy Certificates, or RECs, on your behalf, as America goes electric and more options emerge. 

"RECs measure an investment in a clean energy resource," Ratz said, in an email. "The goal of putting that resource on the grid is to push out the need for dirtier resources."

The good news: Even if you do nothing, your energy mix will get cleaner. Coal production has fallen to lows not seen since the 1980s, amid disruptions in coal and nuclear sectors that affect reliability and costs, while renewable electricity generation has doubled since 2008. So whether you like it or not, you'll be roped into the clean energy boom one way or another. 


Related News

View more

Project examines potential for Europe's power grid to increase HVDC Technology

HVDC-WISE Project accelerates HVDC technology integration across the European transmission system, delivering a planning toolkit to boost grid reliability, resilience, and interconnectors for renewables and offshore wind amid climate, cyber, and physical threats.


Key Points

EU-funded project delivering tools to integrate HVDC into Europe's grid, improving reliability, resilience, and security.

✅ EU Horizon Europe-backed consortium of 14 partners

✅ Toolkit to assess extreme events and grid operability

✅ Supports interconnectors, offshore wind, and renewables


A partnership of 14 leading European energy industry companies, research organizations and universities has launched a new project to identify opportunities to increase integration of HVDC technology into the European transmission system, echoing calls to invest in smarter electricity infrastructure from abroad.

The HVDC-WISE project, in which the University of Strathclyde is the UK’s only academic partner, is supported by the European Union’s Horizon Europe programme.

The project’s goal is to develop a toolkit for grid developers to evaluate the grid’s performance under extreme conditions and to plan systems, leveraging a digital grid approach that supports coordination to realise the full range of potential benefits from deep integration of HVDC technology into the European transmission system.

The project is focused on enhancing electric grid reliability and resilience while navigating the energy transition. Building and maintaining network infrastructure to move power across Europe is an urgent and complex task, and reducing losses with superconducting cables can play a role, particularly with the continuing growth of wind and solar generation. At the same time, threats to the integrity of the power system are on the rise from multiple sources, including climate, cyber, and physical hazards.


Mutual support

At a time of increasing worries about energy security and as Europe’s electricity systems decarbonise, connections between them to provide mutual support and routes to market for energy from renewables, a dynamic also highlighted in discussions of the western Canadian electricity grid in North America, become ever more important.

In modern power systems, this means making use of High Voltage Direct Current (HVDC) technology.

The earliest forms of technology have been around since the 1960s, but the impact of increasing reliance on HVDC and its ability to enhance a power system’s operability and resilience are not yet fully understood.

Professor Keith Bell, Scottish Power Professor of Future Power Systems at the University of Strathclyde, said:

As an island, HVDC is the only practical way for us to build connections to other countries’ electricity systems. We’re also making use of it within our system, with one existing and more planned Scotland-England subsea link projects connecting one part of Britain to another.

“These links allow us to maximise our use of wind energy. New links to other countries will also help us when it’s not windy and, together with assets like the 2GW substation now in service, to recover from any major disturbances that might occur.

“The system is always vulnerable to weather and things like lightning strikes or short circuits caused by high winds. As dependency on electricity increases, insights from electricity prediction specialists can inform planning as we enhance the resilience of the system.”

Dr Agusti Egea-Alvarez, Senior Lecturer at Strathclyde, said: “HVDC systems are becoming the backbone of the British and European electric power network, either interconnecting countries, or connecting offshore wind farms.

“The tools, procedures and guides that will be developed during HVDC-WISE will define the security, resilience and reliability standards of the electric network for the upcoming decades in Europe.”

Other project participants include Scottish Hydro Electric Transmission, the Supergrid Institute, the Electric Power Research Institute (EPRI) Europe, Tennet TSO, Universidad Pontificia Comillas, TU Delft, Tractebel Impact and the University of Cyprus.


Climate change

Eamonn Lannoye, Managing Director of EPRI Europe, said: “The European electricity grid is remarkably reliable by any standard. But as the climate changes and the grid becomes exposed to more extreme conditions, energy interdependence between regions intensifies and threats from external actors emerge. The new grid needs to be robust to those challenges.”

Juan Carlos Gonzalez, a senior researcher with the SuperGrid Institute which leads the project said: “The HVDC-WISE project is intended to provide planners with the tools and know-how to understand how grid development options perform in the context of changing threats and to ensure reliability.”

HVDC-WISE is supported by the European Union’s Horizon Europe programme under agreement 101075424 and by the UK Research and Innovation Horizon Europe Guarantee scheme.


Related News

View more

Sign Up for Electricity Forum’s Newsletter

Stay informed with our FREE Newsletter — get the latest news, breakthrough technologies, and expert insights, delivered straight to your inbox.

Electricity Today T&D Magazine Subscribe for FREE

Stay informed with the latest T&D policies and technologies.
  • Timely insights from industry experts
  • Practical solutions T&D engineers
  • Free access to every issue

Live Online & In-person Group Training

Advantages To Instructor-Led Training – Instructor-Led Course, Customized Training, Multiple Locations, Economical, CEU Credits, Course Discounts.

Request For Quotation

Whether you would prefer Live Online or In-Person instruction, our electrical training courses can be tailored to meet your company's specific requirements and delivered to your employees in one location or at various locations.