Exelon now selling Green-e Energy Certified RECs

By CSRwire


NFPA 70e Training

Our customized live online or in‑person group training can be delivered to your staff at your location.

  • Live Online
  • 6 hours Instructor-led
  • Group Training Available
Regular Price:
$199
Coupon Price:
$149
Reserve Your Seat Today
The Center for Resource Solutions announced that Exelon Energy can now sell Green-e Energy Certified renewable energy certificates (RECs). Exelon Energy joins the growing network of renewable energy providers that offer products certified by Green-e Energy, the nationÂ’s leading certification and verification program for renewable energy.

"We are very pleased to announce that Exelon will participate in Green-e Energy by offering a certified renewable energy option," said Andrew Nourafshan, Green-e Program Analyst. "Exelon Energy Company's customized REC solutions will serve to make it even easier for businesses and institutions nationwide to reduce the environmental impact of the electricity they use."

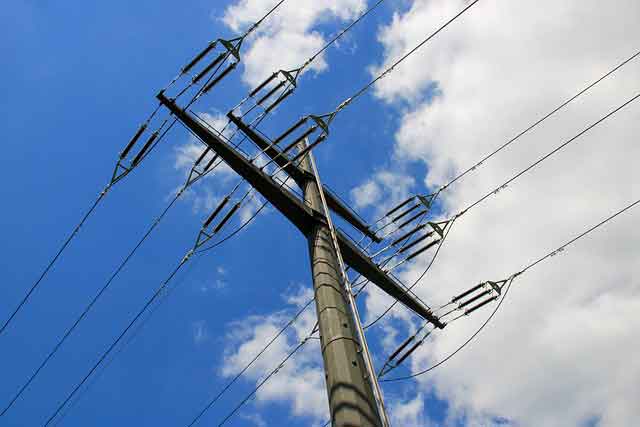
Exelon Energy can now offer Green-e Energy Certified RECs to commercial and industrial customers, adding to a flexible suite of existing renewable energy products. By purchasing Exelon Energy Company RECs, businesses will support currently available renewable resources as well as aid the development of new renewable resources to be built in the United States.

Exelon Energy Vice President Sheree Petrone said, "We're excited about being able to offer our customers Green-e Energy Certified renewable energy certificates. This certification is another important step forward in helping Exelon's customers reduce greenhouse gas emissions associated with their energy use, a key component of our recently announced Exelon 2020 plan."

The Exelon 2020 plan sets a goal of reducing, offsetting, or displacing more than 15 million metric tons of greenhouse gas emissions (in carbon dioxide-equivalent terms) per year by 2020, the equivalent to taking nearly three million cars off American roads and highways, according to Exelon. A key component of the Exelon 2020 plan is helping customers reduce their greenhouse gas emissions through products like the Green-e Energy Certified renewable energy certificates.

Green-e Energy is the leading renewable energy certification and verification program in the U.S., with over 190 participating vendors selling nearly 10 million MWhs of renewable energy in 2006. The program provides independent, third-party certification to ensure certified renewable energy meets strict environmental and consumer protection standards.

Providers of Green-e Energy Certified renewable energy agree to abide by the Green-e Energy Code of Conduct and meet strict disclosure and truth-in-advertising requirements. All marketers of Green-e Energy Certified products undergo an annual verification audit to document that the company purchased and/or generated enough quantity and type of renewable energy to meet customer demand and marketing claims.

The Green-e logo, the national symbol for renewable energy excellence, enables a growing number of consumers to easily identify high quality, certified renewable energy options, as well as everyday consumer products that are produced by companies that use renewable energy in their operations.

Related News

Imported coal volumes up 17% during Apr-Oct as domestic supplies shrink

India Thermal Power Coal Imports surged 17.6% as CEA-monitored plants offset weaker CIL and SCCL supplies, driven by Saubhagya-led electricity demand, regional power deficits, and varied consumption across Uttar Pradesh, Bihar, Maharashtra, and Gujarat.


Key Points

Fuel volumes imported for Indian thermal plants, tracked by CEA, reflecting shifts in CIL/SCCL supply, demand, and regional power deficits.

✅ Imports up 17.6% as domestic CIL/SCCL deliveries lag targets

✅ Saubhagya-driven demand lifts generation in key beneficiary states

✅ Industrial slowdowns cut usage in Maharashtra, Tamil Nadu, Gujarat


The receipt of imported coal by thermal power plants, where plant load factors have risen, has shot up by 17.6 per cent during April-October. The coal import volumes refer to the power plants monitored by the Central Electricity Authority (CEA), and come amid moves to ration coal supplies as electricity demand surges, a power update report from CARE Ratings showed.

Imports escalated as domestic supplies by Coal India Ltd (CIL) and another state run producer- Singareni Collieries Company Ltd (SCCL) dipped in the period, after earlier shortages that have since eased in later months. Rate of supplies by the two coal companies to the CEA monitored power stations stood at 80.4 per cent, indicating a shortfall of 19.6 per cent against the allocated quantity.

According to the study by CARE Ratings, total coal supplied by CIL and SCCL to the power sector stood at 315.9 million tonnes (mt) during April-October as against 328.5 mt in the comparable period of last fiscal year.

The study noted that growth in power generation during the April-October 2019, with India now the third-largest electricity producer globally, was on account of higher demand from Pradhan Mantri Sahaj Bijli Har Ghar Yojana or Saubhagya Scheme beneficiary states. Providing connection to households in order to achieve 100% per cent electrification has in part helped the sector avert de-growth, as part of efforts to rewire Indian electricity and expand access.

Large states namely Uttar Pradesh, Bihar, Punjab, West Bengal and Rajasthan have recorded over five per cent growth in consumption of power. These states along with Odisha, Madhya Pradesh and Assam accounted for 75 per cent of the beneficiaries under the Saubhagya Scheme (Household Electrification Scheme). The ongoing economic downturn has led to a sharp fall in electricity demand from industrialised states. Maharashtra, which is also the largest power consuming state in India, recorded a decline in consumption of 5.6 per cent.

Other states namely Tamil Nadu, Telangana, Gujarat and Odisha too recorded fall in power consumed, echoing global dips in daily electricity demand seen later during the pandemic. These states house large clusters of mining, automobile, cement and other manufacturing industries, and a decline in these sectors led to fall in demand for power across these states. - The demand-supply gap or power deficit has remained at 0.6 per cent during the April-October 2019. North-East reported 4.8 per cent of power deficit followed by Northern Region at 1.3 per cent. Within Northern Region, Jammu & Kashmir and Uttar Pradesh accounted for 65 per cent and 30 per cent respectively of the regions power supply deficit.


Related News

View more

Brazilian electricity workers call for 72-hour strike

Eletrobras Privatization Strike sparks a 72-hour CNE walkout by Brazil's electricity workers, opposing asset sell-offs and grid privatization while pledging essential services; unions target President Wilson Ferreira Jr. over energy-sector reforms.


Key Points

A 72-hour CNE walkout by Brazil's electricity workers opposing Eletrobras sell-offs, while keeping essential services.

✅ 72-hour strike led by CNE unions and federations

✅ Targets privatization plans and leadership at Eletrobras

✅ Essential services maintained to avoid consumer impact


Brazil's national electricity workers' collective (CNE) has called for a 72-hour strike to protest the privatization of state-run electric company Eletrobras and its subsidiaries.

The CNE, which gathers the electricity workers' confederation, federations, unions and associations, said the strike is to begin at Monday midnight (0300 GMT) and last through midnight Wednesday, even as some utilities elsewhere have considered asking staff to live on site to maintain operations.

Workers are demanding the ouster of Eletrobras President Wilson Ferreira Jr., who they say is the leading promoter of the privatization move.

Some 24,000 workers are expected to take part in the strike. However, the CNE said it will not affect consumers by ensuring essential services, a pledge echoed by utilities managing costs elsewhere such as Manitoba Hydro's unpaid days off during the pandemic.

#google#

Eletrobras accounts for 32 percent of Brazil's installed energy generation capacity, mainly via hydroelectric plants. Besides, it also operates nuclear and thermonuclear plants, and solar and wind farms, reflecting trends captured by young Canadians' interest in electricity jobs in recent years.

The company distributes electricity in six northern and northeastern states, and handles 47 percent of the nation's electricity transmission lines, even as a U.S. grid pandemic warning has highlighted reliability risks.

The government owns a 63-percent stake in the company, a reminder that public policy shapes the sector, similar to Canada's future-of-work investment initiatives announced recently.


Related News

View more

WY Utility's First Wind Farm Faces Replacement

Foote Creek I Wind Farm Repowering upgrades Wyoming turbines with new nacelles, towers, and blades, cutting 68 units to 12 while sustaining 41.6 MW, under PacifiCorp and Rocky Mountain Power's Energy Vision 2020 plan.


Key Points

Replacement at Foote Creek Rim I, cutting to 12 turbines while sustaining about 41.6 MW using modern 2-4.2 MW units.

✅ 12 turbines replace 68, output steady near 41.6 MW

✅ New nacelles, towers, blades; taller 500 ft turbines

✅ Part of PacifiCorp Energy Vision 2020 and Gateway West


A Wyoming utility company has filed a permit to replace its first wind farm—originally commissioned in 1998, composed of over 65 turbines—amid new gas capacity competing with nuclear in Ohio, located at Foote Creek Rim I. The replacement would downsize the number of turbines to 12, which would still generate roughly the same energy output.

According to the Star Tribune, PacifiCorp’s new installation would involve new nacelles, new towers and new blades. The permit was filed with Carbon County.


New WY Wind Farm

The replacement wind turbines will stand more than twice as tall as the old: Those currently installed stand 200 feet tall, whereas their replacements will tower closer to 500 feet. Though this move is part of the company’s overall plan to expand its state wind fleet as some utilities respond to declining coal returns in the Midwest, the work going into the Foote Creek site is somewhat special, noted David Eskelsen, spokesperson for Rocky Mountain Power, the western arm of PacifiCorp.

“Foote Creek I repowering is somewhat different from the repowering projects announced in the (Energy Vision) 2020 initiative,” he said. “Foote Creek is a complete replacement of the existing 68 foundations, towers, turbine nacelles and rotors (blades).”

Currently, the turbines at Foote Creek have 600 kilowatts capacity each; the replacements’ maximum production ranges from 2 megawatts to 4.2 megawatts each, with the total output remaining steady at 41.4 megawatts, a scale similar to a 30-megawatt wind expansion in Eastern Kings, though there will be a slight capacity increase to 41.6 megawatts, according to the Star Tribune.

As part of the wind farm repowering initiative, PacifiCorp is to become full owner and operator of the Foote Creek site. When the farm was originally built, an Oregon-based water and electric board was 21 percent owner; 37 percent of the project’s output was tied into a contract with the Bonneville Power Administration.

Otherwise, PacifiCorp is moving to further expand its state wind fleet in line with initiatives like doubling renewable electricity by 2030 in Saskatchewan, with the addition of three new wind farms—to be located in Carbon, Albany and Converse counties—which may add up to 1,150 megawatts of power.

According to PacifiCorp, the company has more than 1,000 megawatts of owned wind generation capability, along with long-term purchase agreements for more than 600 megawatts from other wind farms owned by other entities. Energy Vision 2020 refers to a $3.5 billion investment and company move that is looking to upgrade the company's existing wind fleet with newer technology, adding 1,150 megawatts of new wind resources by 2020 and a a new 140-mile Gateway West transmission segment in Wyoming, comparable to a transmission project in Missouri just energized.


Related News

View more

Peterborough Distribution sold to Hydro One for $105 million.

Peterborough Distribution Inc. Sale to Hydro One delivers a $105 million deal pending Ontario Energy Board approval, a 1% distribution rate cut, five-year rate freeze, job protections, and a new operations centre and fleet facility.


Key Points

A $105M acquisition of PDI by Hydro One, with OEB review, rate freeze, job protections, and a new operations centre.

✅ $105 million purchase; Ontario Energy Board approval required

✅ 1% distribution rate cut and a five-year rate freeze

✅ New operations centre; PDI employees offered roles at Hydro One


The City of Peterborough said Wednesday it has agreed to sell Peterborough Distribution Inc. to Hydro One for $105 million, amid a period when Hydro One shares fell after leadership changes.

The deal requires approval from the Ontario Energy Board before it can proceed.

According to the city, the deal includes a one per cent distribution rate reduction and a five-year freeze in distribution rates for customers, plus:

  • A second five-year period with distribution rate increases limited to inflation and an earnings sharing mechanism to offset rates in year 11 and onward
  • Protections for PDI employees with employees receiving employment offers to move to Hydro One
  • A sale price of $105 million
  • An agreement to develop a regional operations centre and new fleet maintenance facility in Peterborough

“Hydro One was unique in its ability to offer new investment and job creation in our community through the addition of a new operations centre to serve customers throughout the broader region,” Mayor Daryl Bennett said.

“We’re surrounded by Hydro One territory — in fact, we already have Hydro One customers within the City of Peterborough and new subdivisions will be in Hydro One territory. Hydro One will be able to create efficiencies by better utilizing its existing infrastructure, benefiting customers and supporting growth.”

The sale comes after months of negotiations amid investor concerns about Hydro One’s uncertainties. At one point, it looked like the sale wouldn’t go through, after it was announced that Hydro One had walked away from the bargaining table.

City council approved the sale of PDI in December 2016, despite a strong public opposition and debate over proposals to make hydro public again among some parties.

Elsewhere in Canada, political decisions around utilities have also sparked debate, as seen when Manitoba Hydro faced controversy over policy shifts.


Related News

View more

Trump's Vision of U.S. Energy Dominance Faces Real-World Constraints

U.S. Energy Dominance envisions deregulation, oil and gas growth, LNG exports, pipelines, and geopolitical leverage, while facing OPEC pricing power, infrastructure bottlenecks, climate policy pressures, and accelerating renewables in global markets.


Key Points

U.S. policy to grow fossil fuel output and exports via deregulation, bolstering energy security, geopolitical influence.

✅ Deregulation to expand drilling, pipelines, and export capacity

✅ Exposed to OPEC pricing, global shocks, and cost competitiveness

✅ Faces infrastructure, ESG finance, and renewables transition risks


Former President Donald Trump has consistently advocated for “energy dominance” as a cornerstone of his energy policy. In his vision, the United States would leverage its abundant natural resources to achieve energy self-sufficiency, flood global markets with cheap energy, and undercut competitors like Russia and OPEC nations. However, while the rhetoric resonates with many Americans, particularly those in energy-producing states, the pursuit of energy dominance faces significant real-world challenges that could limit its feasibility and impact.

The Energy Dominance Vision

Trump’s energy dominance strategy revolves around deregulation, increased domestic production of oil and gas, and the rollback of climate-oriented restrictions. During his presidency, he emphasized opening federal lands to drilling, accelerating the approval of pipelines, and, through an executive order, boosting uranium and nuclear energy initiatives, as well as withdrawing from international agreements like the Paris Climate Accord. The goal was not only to meet domestic energy demands but also to establish the U.S. as a major exporter of fossil fuels, thereby reducing reliance on foreign energy sources.

This approach gained traction during Trump’s first term, with the U.S. achieving record levels of oil and natural gas production. Energy exports surged, making the U.S. a net energy exporter for the first time in decades. Yet, critics argue that this policy prioritizes short-term economic gains over long-term sustainability, while supporters believe it provides a roadmap for energy security and geopolitical leverage.

Market Realities

The energy market is complex, influenced by factors beyond the control of any single administration, with energy crisis impacts often cascading across sectors. While the U.S. has significant reserves of oil and gas, the global market sets prices. Even if the U.S. ramps up production, it cannot insulate itself entirely from price shocks caused by geopolitical instability, OPEC production cuts, or natural disasters.

For instance, despite record production in the late 2010s, American consumers faced volatile gasoline prices during an energy crisis driven by $5 gas and external factors like tensions in the Middle East and fluctuating global demand. Additionally, the cost of production in the U.S. is often higher than in countries with more easily accessible reserves, such as Saudi Arabia. This limits the competitive advantage of U.S. energy producers in global markets.

Infrastructure and Environmental Concerns

A major obstacle to achieving energy dominance is infrastructure. Expanding oil and gas production requires investments in pipelines, export terminals, and refineries. However, these projects often face delays due to regulatory hurdles, legal challenges, and public opposition. High-profile pipeline projects like Keystone XL and Dakota Access have become battlegrounds between industry proponents and environmental activists, and cross-border dynamics such as support for Canadian energy projects amid tariff threats further complicate permitting, highlighting the difficulty of reconciling energy expansion with environmental and community concerns.

Moreover, the transition to cleaner energy sources is accelerating globally, with many countries committing to net-zero emissions targets. This trend could reduce the demand for fossil fuels in the long run, potentially leaving U.S. producers with stranded assets if global markets shift more quickly than anticipated.

Geopolitical Implications

Trump’s energy dominance strategy also hinges on the belief that U.S. energy exports can weaken adversaries like Russia and Iran. While increased American exports of liquefied natural gas (LNG) to Europe have reduced the continent’s reliance on Russian gas, achieving total energy independence for allies is a monumental task. Europe’s energy infrastructure, designed for pipeline imports from Russia, cannot be overhauled overnight to accommodate LNG shipments.

Additionally, the influence of major producers like Saudi Arabia and the OPEC+ alliance remains significant, even as shifts in U.S. policy affect neighbors; in Canada, some viewed Biden as better for the energy sector than alternatives. These countries can adjust production levels to influence prices, sometimes undercutting U.S. efforts to expand its market share.

The Renewable Energy Challenge

The growing focus on renewable energy adds another layer of complexity. Solar, wind, and battery storage technologies are becoming increasingly cost-competitive with fossil fuels. Many U.S. states and private companies are investing heavily in clean energy to align with consumer preferences and global trends, amid arguments that stepping away from fossil fuels can bolster national security. This shift could dampen the domestic demand for oil and gas, challenging the long-term viability of Trump’s energy dominance agenda.

Moreover, international pressure to address climate change could limit the expansion of fossil fuel infrastructure. Financial institutions and investors are increasingly reluctant to fund projects perceived as environmentally harmful, further constraining growth in the sector.

While Trump’s call for U.S. energy dominance taps into a desire for economic growth and energy security, it faces numerous challenges. Global market dynamics, infrastructure bottlenecks, environmental concerns, and the transition to renewable energy all pose significant barriers to achieving the ambitious vision.

For the U.S. to navigate these challenges effectively, a balanced approach that incorporates both traditional energy sources and investments in clean energy is likely needed. Striking this balance will require careful policymaking that considers not just immediate economic gains but also long-term sustainability and global competitiveness.


Related News

View more

U.S. Electricity and natural gas prices explained

Energy Pricing Factors span electricity generation, transmission, and distribution costs, plus natural gas supply-demand, renewables, seasonal peaks, and wholesale pricing effects across residential, commercial, and industrial customers, usage patterns, weather, and grid constraints.


Key Points

They are the costs and market forces driving electricity and natural gas prices, from generation to delivery and demand.

✅ Generation, transmission, distribution shape electricity rates

✅ Gas prices hinge on supply, storage, imports/exports

✅ Demand shifts: weather, economy, and fuel alternatives


There are a lot of factors that affect energy prices globally. What’s included in the price to heat homes and supply them with electricity may be a lot more than some people may think.

Electricity
Generating electricity is the largest component of its price, according to the U.S. Energy Information Administration (EIA). Generation accounts for 56% of the price of electricity, while distribution and transmission account for 31% and 13% respectively.

Homeowners and businesses pay more for electricity than industrial companies, and U.S. electricity prices have recently surged, highlighting broader inflationary pressures. This is because industrial companies can take electricity at higher voltages, reducing transmission costs for energy companies.

“Industrial consumers use more electricity and can receive it at higher voltages, so supplying electricity to these customers is more efficient and less expensive. The price of electricity to industrial customers is generally close to the wholesale price of electricity,” EIA explains.

NYSEG said based on the average use of 600 kilowatt-hours per month, its customers spent the most money on delivery and transition charges in 2020, 57% or about $42, and residential electricity bills increased 5% in 2022 after inflation, according to national data. They also spent on average 35% (~$26) on supply charges and 8% (~$6) on surcharges.

Electricity prices are usually higher in the summer. Why? Because energy companies use sources of electricity that cost more money. It used to be that renewable sources, like solar and wind, were the most expensive sources of energy but increased technological advances have changed this, according to the International Energy Agency’s 2021 World Energy Outlook.

“In most markets, solar PV or wind now represents the cheapest available source of new electricity generation. Clean energy technology is becoming a major new area for investment and employment – and a dynamic arena for international collaboration and competition,” the report said.

Natural gas
The price of natural gas is driven by supply and demand. If there is more supply, prices are generally lower. If there is not as much supply, prices are generally higher the EIA explains. On the other side of the equation, more demand can also increase the price and less demand can decrease the price.

High natural gas prices mean people turn their home thermostats down a few degrees to save money, so the EIA said reduced demand can encourage companies to produce more natural gas, which would in turn help lower the cost. Lower prices will sometimes cause companies to reduce their production, therefore causing the price to rise.

The three major supply factors that affect prices: the amount of natural gas produced, how much is stored, and the volume of gas imported and exported. The three major demand factors that affect price are: changes in winter/summer weather, economic growth, and the broader energy crisis dynamics, as well as how much other fuels are available and their price, said EIA.

To think the price of natural gas is higher when the economy is thriving may sound counterintuitive but that’s exactly what happens. The EIA said this is because of increases in demand.


Related News

View more

Sign Up for Electricity Forum’s Newsletter

Stay informed with our FREE Newsletter — get the latest news, breakthrough technologies, and expert insights, delivered straight to your inbox.

Electricity Today T&D Magazine Subscribe for FREE

Stay informed with the latest T&D policies and technologies.
  • Timely insights from industry experts
  • Practical solutions T&D engineers
  • Free access to every issue

Download the 2025 Electrical Training Catalog

Explore 50+ live, expert-led electrical training courses –

  • Interactive
  • Flexible
  • CEU-cerified