Central Asia power shortages strain grids across Kazakhstan, Uzbekistan, Kyrgyzstan, Tajikistan, and Turkmenistan, driven by drought-hit hydropower, aging coal and gas plants, rising demand, cryptomining loads, and winter peak consumption risks.
Key Points
Regionwide blackouts from drought, aging plants and grids, rising demand, and winter peaks stressing Central Asia.
✅ Drought slashes hydropower in Kyrgyzstan, Tajikistan, Uzbekistan
✅ Aging coal and gas TPPs and weak grids cause frequent outages
✅ Cryptomining loads and winter heating spike demand and stress supply
Central Asians from western Kazakhstan to southern Tajikistan are suffering from power and energy shortages that have caused hardship and emergency situations affecting the lives of millions of people.
On October 14, several units at three power plants in northeastern Kazakhstan were shut down in an emergency that resulted in a loss of more than 1,000 megawatts (MW) of electricity.
It serves as an example of the kind of power failures that plague the region 30 years after the Central Asian countries gained independence and despite hundreds of millions of dollars being invested in energy infrastructure and power grids, and echo risks seen in other advanced markets such as Japan's near-blackouts during recent cold snaps.
Some of the reasons for these problems are clear, but with all the money these countries have allocated to their energy sectors and financial help they have received from international financial institutions, it is curious the situation is already so desperate with winter officially still weeks away.
The Current Problems
Three power plants were affected in the October 14 shutdowns of units: Ekibastuz-1, Ekibastuz-2, and the Aksu power plant.
Ekibastuz-1 is the largest power plant in Kazakhstan, capable of generating some 4,000 MW, roughly 13 percent of Kazakhstan’s total power output.
The Kazakhstan Electricity Grid Operating Company (KEGOC) explained the problems resulted partially from malfunctions and repair work, but also from overuse of the system that the government would later say was due to cryptominers, a large number of whom have moved to Kazakhstan recently from China after Beijing banned the mining needed by Bitcoin and other cryptocurrencies, amid its own China's power cuts across several provinces in 2021.
But between November 8 and 9, rolling blackouts were reported in the East Kazakhstan, North Kazakhstan, and Kyzylorda provinces, as well as the area around Almaty, Kazakhstan’s biggest city, and Shymkent, its third largest city.
People in Uzbekistan say they, too, are facing blackouts that the Energy Ministry described as “short-term outages,” even as authorities have looked to export electricity to Afghanistan to support regional demand, though it has been clear for several weeks that the country will have problems with natural gas supplies this winter.
Power lines in Uzbekistan
Kyrgyz President Sadyr Japarov continues to say there won't be any power rationing in Kyrgyzstan this winter, but at the end of September the National Energy Holding Company ordered “restrictions on the lighting of secondary streets, advertisements, and facades of shops, cafes, and other nonresidential customers.”
Many parts of Tajikistan are already experiencing intermittent supplies of electricity.
Even in Turkmenistan, a country with the fourth-largest reserves of natural gas in the world, there were reports of problems with electricity and heating in the capital, Ashgabat.
What Is Going On?
The causes of some of these problems are easy to see.
The population of the region has grown significantly, with the population of Central Asia when the Soviet Union collapsed in late 1991 being some 50 million and today about 75 million.
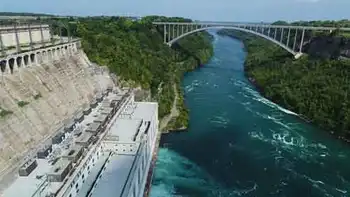
Kyrgyzstan and Tajikistan are mountainous countries that have long been touted for their hydropower potential and some 90 percent of Kyrgyzstan’s domestically produced electricity and 98 percent of Tajikistan’s come from hydropower.
But a severe drought that struck Central Asia this year has resulted in less hydropower and, in general, less energy for the region, similar to constraints seen in Europe's reduced hydro and nuclear output this year.
Tajik authorities have not reported how low the water in the country’s key reservoirs is, but Kyrgyzstan has reported the water level in the reservoir at its Toktogul hydropower plant (HPP) is 11.8 billion cubic meters (bcm), the lowest level in years and far less than the 14.7 bcm of water it had in November 2020.
The Toktogul HPP, with an installed capacity of 1,200 MW, provides some 40 percent of the country's domestically produced electricity, but operating the HPP this winter to generate desperately needed energy brings the risk of leaving water levels at the reservoir critically low next spring and summer when the water is also needed for agricultural purposes.
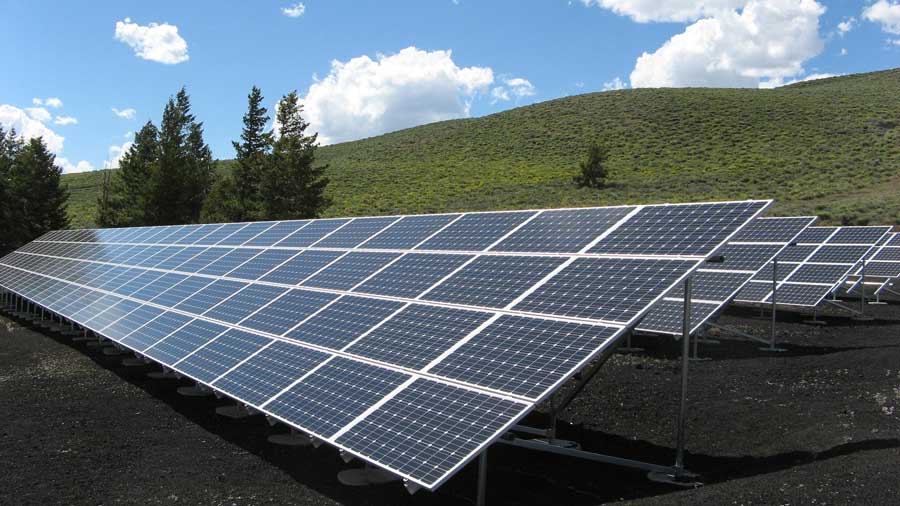
This year’s drought is something Kyrgyzstan and Tajikistan will have to take into consideration as they plan how to provide power for their growing populations in the future. Hydropower is a desirable option but may be less reliable with the onset of climate change, prompting interest in alternatives such as Ukraine's wind power to diversify generation.
Uzbekistan is also feeling the effects of this year’s drought, and, like the South Caucasus where Georgia's electricity imports have increased, supply shortfalls are testing grids.
According to the International Energy Agency, HPPs account for some 12 percent of Uzbekistan’s generating capacity.
Uzbekistan’s Energy Ministry attributed low water levels at HPPs that have caused a 23 percent decrease in hydropower generation this year.
A reservoir in Kyrgyzstan
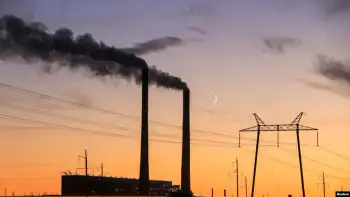
Kazakhstan and Uzbekistan are the most populous Central Asian countries, and both depend on thermal power plants (TPP) for generating most of their electricity.
Most of the TPPs in Kazakhstan are coal-fired, while most of the TPPs in Uzbekistan are gas-fired.
Kazakhstan has 68 power plants, 80 percent of which are coal-fired TPPs, and most are in the northern part of the country where the largest deposits of coal are located. Kazakhstan has the world's 10th largest reserves of coal.
About 88 percent of Uzbekistan’s electricity comes from TTPs, most of which use natural gas.
Uzbekistan’s proven reserves are some 800 billion cubic meters, but gas production in Uzbekistan has been decreasing.
In December 2020, Uzbek President Shavkat Mirziyoev ordered a halt to the country’s gas exports and instructed that gas to be redirected for domestic use. Mirziyoev has already given similar instructions for this coming winter.
How Did It Come To This?
The biggest problem with the energy infrastructure in Central Asia is that it is generally very old. Nearly all of its power plants date back to the Soviet era -- and some well back into the Soviet period.
The use of power plants and transmission lines that some describe as “obsolete” and a few call “decrepit” has unfortunately been a necessity in Central Asia, even as regional players pursue new interconnections like Iran's plan to transmit electricity to Europe as a power hub.
Reporting on Kazakhstan in September 2016, the Asian Development Bank (ADB) said, “70 percent of the power generation infrastructure is in need of rehabilitation.”
The Ekibastuz-1 TPP is relatively new by the power-plant standards of Central Asia. The first unit of the eight units of the TPP was commissioned in 1980.
The first unit at the AKSU TPP was commissioned in 1968, and the first unit of the gas- and fuel-fired TPP in southern Kazakhstan’s Zhambyl Province was commissioned in 1967.
Related News