Electrical Commissioning In Industrial Power Systems
Our customized live online or in‑person group training can be delivered to your staff at your location.

- Live Online
- 12 hours Instructor-led
- Group Training Available
Regular Price:
$599
Coupon Price:
$499
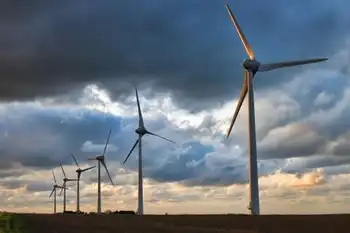
US offshore wind faces high capital costs, permitting delays, and environmental reviews, as projects like Cape Wind in Nantucket Sound promise renewable energy, jobs, and zero-emission power, competing with Europe and China.
Key Information
US offshore wind is ocean-based wind generation delivering renewable electricity to coastal states via marine turbines.
- DOE targets 54 GW by 2030, about 4% of U.S. capacity
- Cape Wind awaits federal decision after years of review
- Northeast states rely on offshore wind for RPS mandates
- Higher upfront costs than onshore; subsidies often required
- Europe and China lead in manufacturing and early projects
The Obama administration decides this month after a nineyear review whether the nations first wind farm should be built off Cape Cod. If it says no, the industry faces another question with no easy answer: Whats next?
Not one of the countrys halfdozen or so offshore wind proposals has entered the arduous review the Cape Wind project is just finishing. Cape Winds developers say the earliest they could begin harnessing the breezes of Nantucket Sound is 2012.
The nations onshore wind industry is the worlds largest, but higher upfront costs, tougher technological challenges and environmental concerns have held back the development of offshore wind farms.
Offshore wind is especially important in areas like the Northeast, which lack major landbased winds but are mandated by state rules to use more renewables. Developers promise jobs and a plentiful offshore wind energy source that emits no greenhouse gas emissions. They say there is enough wind offshore to power the entire country — twice over.
Theres a vast ocean that can be tapped right now, says Jeremy Firestone, an ocean policy professor at the University of Delaware. But, you know, weve got to do it.
Denmark installed the worlds first offshore wind turbine 20 years ago. As the U.S. lags behind Europe and China, and wonders whether it can compete with Canada as well, offshore wind technology and manufacturing jobs get entrenched elsewhere, Firestone says.
General Electric recently announced a $450 million expansion of its European offshore wind turbine business. China plans to begin operating its first commercial offshore wind farm off Shanghai by May 1 and has several other projects planned.
The Department of Energy envisions 54 gigawatts in U.S. offshore wind by 2030, or about 4 percent of the countrys electric generating capacity. The U.S. already produces 35 gigawatts of power from onshore wind. One gigawatt of wind powers about 300,000 homes.
The Cape Wind project, proposed in 2001, and with a planned project start timetable, aims to provide up to threequarters of the Capes power. But opposition has been relentless.
Critics say it would threaten animal life and mar historic vistas, including the view from the Kennedy family compound in Hyannisport. The late Sen. Edward Kennedy called the project a special interest giveaway and was pressing his opposition until weeks before his death last August.
Two Wampanoag Indian tribes also object to the project, saying it would destroy sacred rituals near Nantucket Sound and destroy longsubmerged tribal burial grounds.
This month, Interior Secretary Ken Salazar will make the final call, a decision with political impact for wind development. President Obama has pushed renewables and his recent decision to expand offshore drilling indicates a willingness to tap oceanbased energy sources. But Obama, who was close to Sen. Kennedy, has never spoken publicly about Cape Wind.
Offshore wind has had strong political backing in Northeast states, such as Massachusetts, Delaware and Rhode Island, where governors have pushed utilities to buy the power through a major offshore wind contract approach in some cases. In New Jersey, former Gov. John Corzine also set ambitious offshore wind goals.
Steven Kopits, an analyst with DouglasWestwood energy consultants, says if Salazar kills the industrys most promising proposal in Cape Wind, crucial political support could wither. It would gut the industry, he says.
Peter Mandelstam, president of offshore wind developer NRG Bluewater, a division of utility NRG Energy Inc., says U.S. projects have solid backing from state governments and a successful European model to give investors confidence.
The industry is much more than Cape Wind now, Mandelstam says. It is a series of strong projects, each of which have their own path to success.
Major U.S. proposals include a project in Texas state waters, off Galveston, which could see faster permitting because it doesnt need to go through federal review. But most are concentrated above Maryland in the East Coasts northern half, including Bluewater projects in Delaware and New Jersey.
Each state in the Northeast requires utilities to get a rising percentage of power from renewables over the next several years, such as the 15 percent requirement in Massachusetts by 2020. Many are relying on offshore wind to help them do it.
Todays turbines cant be built beyond 50 meters depth, which is no problem at various East and Gulf Coast sites, though it shuts out the West Coast and its steeply descending sea floors.


The Northeasts heavy coastal population also makes offshore wind a good option because costs increase the further electricity travels over transmission lines.
Last year, the federal government released new rules for permitting offshore projects. Theyre intended to help companies avoid the twisting route Cape Wind has taken. But officials estimate it will still take 7 1/2 years to get a federal permit. Developers face a web of local considerations along the way, too, including maritime traffic and ecological effects.
The path is too long, Mandelstam says.
The high upfront costs of building and maintaining massive turbines at sea help make it significantly more expensive than onshore wind. For instance, the Department of Energy says building an offshore plant where wind power density ranges between 400 and 500 watts per square meter costs about $120 per megawatt hour, compared to about $80 for a landbased wind plant.
Cape Wind officials wont disclose the projects price, but Kopits estimates its at least $2 billion.
Offshore developers need substantial subsidies, such as tax and production credits, and developers in Europe benefit from far more government help.
The expense puts the power at a premium that not everyone is willing to pay. This month, Rhode Island regulators rejected a deal between a local utility and developer Deepwater Wind, citing a high price per kilowatt hour, even as the National Grid purchase of Cape Wind moved forward elsewhere. Only one other project, Bluewaters project in Delaware, has a power purchase deal, considered crucial to investors.
With natural gas prices dropping considerably from five years ago, offshore wind prices look even more pricey by comparison.
Advocates say focusing on todays prices is shortsighted, arguing that free offshore wind is a good longterm bet compared to fossil fuels, with their unstable and inevitably increasing prices.
Costs will go down, says Walt Musial, an engineer at the National Renewable Energy Laboratory. We may have some slow starts... and we may have some pushback, but eventually I think were going to see offshore wind grow.
Related News
Related News
Michigan Public Service Commission grants Consumers Energy request for more wind generation
Consumers Energy Wind Expansion gains MPSC approval in Michigan, adding up to 525 MW of…
View more
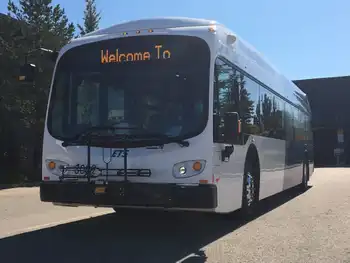
Edmonton's 1st electric bus hits city streets
Edmonton Electric Buses usher in zero-emission public transit with Proterra battery-electric vehicles, 350 km range,…
View more
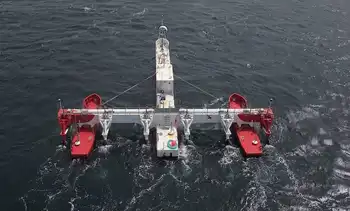
How waves could power a clean energy future
Wave Energy Converters can deliver marine power to the grid, with DOE-backed PacWave enabling offshore…
View more
TCS Partners with Schneider Electric Marathon de Paris to Boost AI and Technology
TCS AI Partnership Paris Marathon integrates predictive analytics, digital twin simulations, real-time runner tracking, and…
View more
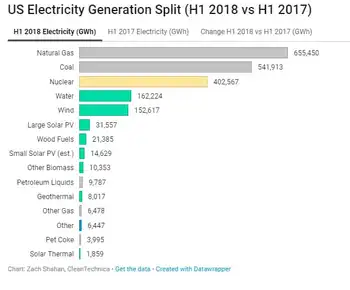
Solar + Wind = 10% of US Electricity Generation in 1st Half of 2018
US Electricity Generation H1 2018 saw wind and solar gains but hydro declines, as natural…
View more

Consumers Coalition wants Manitoba Hydro's proposed rate increase rejected
Manitoba Hydro Interim Rate Increase faces PUB scrutiny as consumers coalition challenges a 5% electricity…
View more
Sign Up for Electricity Forum’s Newsletter
Stay informed with our FREE Newsletter — get the latest news, breakthrough technologies, and expert insights, delivered straight to your inbox.
Electricity Today T&D Magazine Subscribe for FREE

Stay informed with the latest T&D policies and technologies.
- Timely insights from industry experts
- Practical solutions T&D engineers
- Free access to every issue
